0
2022
Ble Beacon Market

BLE Beacon Market

by by Type (iBeacon, Eddystone, Others), by Application (Proximity Marketing, Asset Tracking, Indoor Navigation, Others), by Industry Vertical (Retail, Healthcare, Travel and Tourism, BFSI, Automotive, Others): Global Opportunity Analysis and Industry Forecast, 2019-2030

Report Code: A10405
Sep 2022 | Pages: 296
Tables: 213
Charts: 69
  • Formats*:

  • pdf

    Single User License, Five User
    License & Enterprise User License

  • xls

    Data Pack Excel License

  • ppt

    It comes with the additional cost
    of $2500.00 contact sales.


The global BLE beacon market was valued at $2 billion in 2019, and is projected to reach $69.2 billion by 2030, growing at a CAGR of 36.9% from 2022 to 2030 

Bluetooth low energy is referred to as BLE. It is a power-saving variation of Bluetooth that was first released in 2010 by Bluetooth SIG. Beacons depend on BLE's low energy requirements as it enables them to operate for years on tiny coin-cell batteries. In addition, it uses a lot less energy than the outdated, cumbersome Bluetooth. BLE is a key factor on the Internet of Things, enabling technology to function for longer with fewer pieces.

BLE uses a different set of channels but the same frequency range as Bluetooth Classic (2.400-2.4835 GHz ISM band). It has three major ad channels, which speeds up device connections and reduces the amount of time to scan a device. To address concerns related to narrowband interference, BLE implements direct sequence spread spectrum or frequency hopping using digital modulation techniques. A Bluetooth beacon's theoretical maximum radius is less than 100 meters. Furthermore, latency from a disconnected state can be up to 6 meters. The beacon's real range and reaction time are determined by the operation for which it was intended.

The global BLE Beacon market has been moderately impacted by the COVID-19 outbreak. Production and manufacturing facilities across the region have been shut down, owing to the outbreak of the health crisis and the unavailability of a workforce. This has further impacted the regional economy and is causing economic hardship for businesses and communities. Countries across the region have suffered major losses in terms of business and revenue, owing to lockdown and lack of availability of raw materials globally. Production and manufacturing sectors regionally have been heavily impacted by the outbreak of the COVID-19 disease, which in turn, led to a moderate downfall, thereby declining the growth of the BLE Beacon market in 2020. COVID-19 has enforced the global BLE Beacon market in the region to make short-term decisions with long-term implications.

BLE Beacon Market

The outbreak of COVID-19 has significantly impacted the growth of the global BLE beacon market solutions such as ibeacon devices and ibeacon proximity devices in 2021, owing to a significant impact on prime players operating in the supply chain. With the use of BLE beacon technology, numerous organizations are developing different applications to stop the spread of false information regarding the number of fatalities, available diagnoses & treatments, and immunization.

For instance, Google and Facebook teamed up to support the National Health Service (NHS) in the fight against false coronavirus news. In addition, it is expected that the BLE Beacon market will dominate the market in 2021, owing to the increase in implementation of this technology by governments around the world to conduct various efforts to prevent close contact. For instance, the government of India has installed a few gadgets at the Bangalore Airport to eliminate passenger interaction and reduce the spread of coronavirus. It has been observed that using infrared cards allows a user to make purchases without ever touching a swiping machine. For instance, PayPal has established a beacon protocol to prevent the use of cash or swipe cards. Therefore, during the forecast period, it is expected to drive the BLE beacon market opportunity, owing to the demand for location-based marketing solutions and the growing adoption of mobile devices.

The BLE beacon market is segmented into Industry Vertical, Type, and Application.
BLE Beacon Market

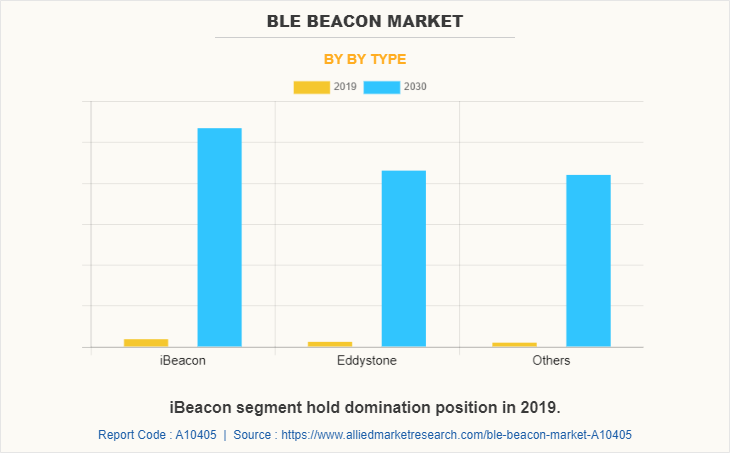
On the basis of type, the market is divided into IBeacon, Eddystone, and others. The iBeacon segment was the highest revenue contributor to the market and is expected to grow at the highest CAGR during the BLE beacon market forecast period from 2022 to 2030.
BLE Beacon Market

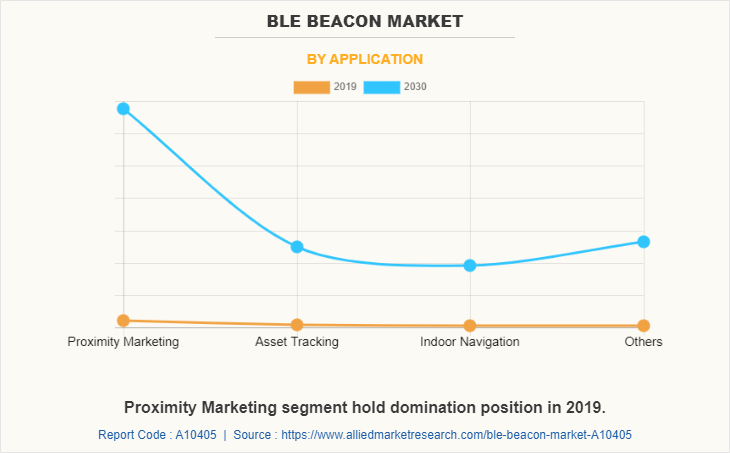
By application, the BLE beacon market size is segmented into proximity marketing, asset tracking, indoor navigation, and others. The proximity marketing segment was the highest revenue contributor to the BLE beacon market share and is estimated to grow at a high CAGR%during the forecast period.
BLE Beacon Market

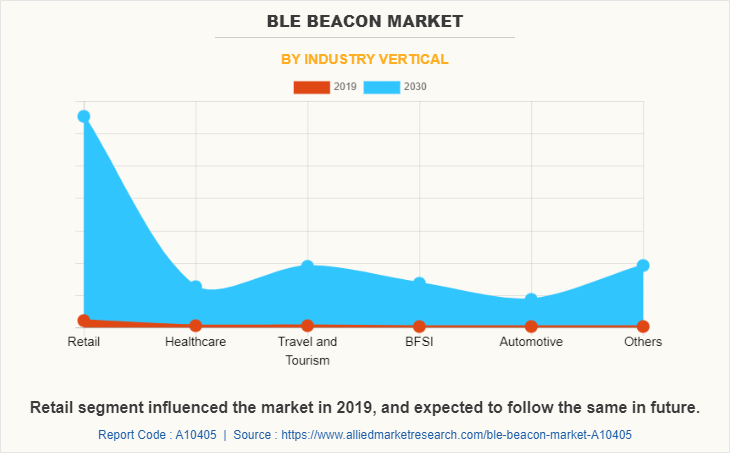
By industry vertical, the BLE beacon market growth is segregated into retail, healthcare, travel, and tourism, BFSI, automotive, and others. The retail segment acquired the largest share in 2019 and is expected to grow at a high CAGR% from 2022 to 2030.
BLE Beacon Market

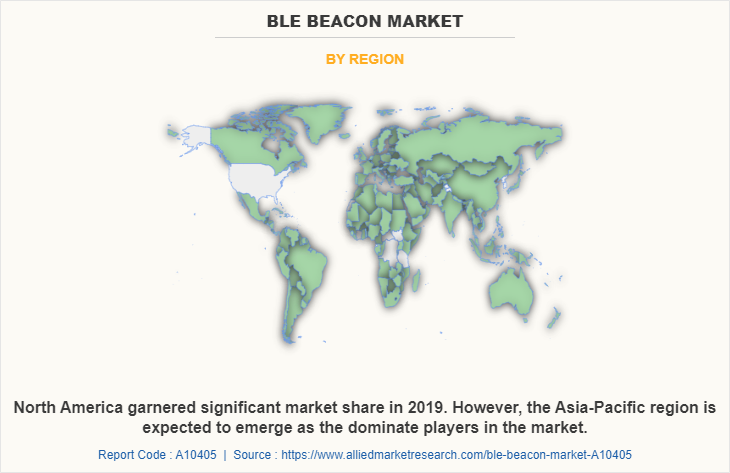
Region-wise, the BLE Beacon market outlook is analyzed across North America (the U.S., Canada, and Mexico), Europe (the UK, Germany, France, Italy, Spain, and the Rest of Europe), Asia-Pacific (China, India, Japan, South Korea, and, Rest of Asia-Pacific), and LAMEA (Latin America, the Middle East, and Africa). Asia-Pacific remains a significant participant in the BLE Beacon industry. Major organizations and government institutions in emerging countries are intensely putting resources into technology.

Competitive analysis and profiles of major BLE Beacon market players, such as Accent Systems, Apple Inc, Bluvision, Estimote Inc, Google LLC, Hewlett Packard Enterprise Development LP, K2B Solutions, Kontakt.io, Onyx Beacon, and UFO Beacons are focusing their investments on technologically advanced, cost-effective, and more secure products and solutions for various applications.

Key Benefits For Stakeholders

  • This report provides a quantitative analysis of the market segments, current trends, estimations, and dynamics of the BLE beacon market analysis from 2019 to 2030 to identify the prevailing BLE beacon market opportunities.
  • Market research is offered along with information related to key drivers, restraints, and opportunities.
  • Porter's five forces analysis highlights the potency of buyers and suppliers to enable stakeholders to make profit-oriented business decisions and strengthen their supplier-buyer network.
  • An in-depth analysis of the BLE beacon market segmentation assists to determine the prevailing market opportunities.
  • Major countries in each region are mapped according to their revenue contribution to the global market.
  • Market player positioning facilitates benchmarking and provides a clear understanding of the present position of the market players.
  • The report includes the analysis of the regional as well as global BLE beacon market trends, key players, market segments, application areas, and market growth strategies.

BLE Beacon Market Report Highlights

Aspects Details
Market Size By 2030 USD 69.2 billion
Growth Rate CAGR of 36.9%
Forecast period 2019 - 2030
Report Pages 296
By Industry Vertical
  • Retail
  • Healthcare
  • Travel and Tourism
  • BFSI
  • Automotive
  • Others
By Type
  • iBeacon
  • Eddystone
  • Others
By Application
  • Indoor Navigation
  • Others
  • Proximity Marketing
  • Asset Tracking
    • Asset Tracking
      • BLE Readers
      • BLE Tags
By Region
  • North America  (U.S., Canada, Mexico)
  • Europe  (UK, Germany, France, Italy, Spain, Rest Of Europe)
  • Asia-Pacific  (China, Japan, India, South Korea, Australia, Rest Of Asia-Pacific)
  • LAMEA  (Africa, Latin America, Middle East)
Key Market Players Bluecats, Estimote Inc., Google LLC (Alphabet), Apple Inc., Accent Systems, MobileCoderz Technologies Pvt Ltd, UFO Beacons, GCell, Onyx Beacon, Proximity Solutions, K2B Solutions, JK Tech, Hewlett Packard Enterprise, Kontakt, Mobstac Inc, GeLo Inc., Bluvision
 
  • CHAPTER 1:INTRODUCTION

    • 1.1.Report description

    • 1.2.Key market segments

    • 1.3.Key benefits to the stakeholders

    • 1.4.Research Methodology

      • 1.4.1.Secondary research

      • 1.4.2.Primary research

      • 1.4.3.Analyst tools and models

  • CHAPTER 2:EXECUTIVE SUMMARY

    • 2.1.Key findings of the study

    • 2.2.CXO Perspective

  • CHAPTER 3:MARKET OVERVIEW

    • 3.1.Market definition and scope

    • 3.2.Key findings

      • 3.2.1.Top investment pockets

    • 3.3.Porter’s five forces analysis

    • 3.4.Top player positioning

    • 3.5.Market dynamics

      • 3.5.1.Drivers

      • 3.5.2.Restraints

      • 3.5.3.Opportunities

    • 3.6.COVID-19 Impact Analysis on the market

  • CHAPTER 4: BLE BEACON MARKET, BY BY TYPE

    • 4.1 Overview

      • 4.1.1 Market size and forecast

    • 4.2 iBeacon

      • 4.2.1 Key market trends, growth factors and opportunities

      • 4.2.2 Market size and forecast, by region

      • 4.2.3 Market analysis by country

    • 4.3 Eddystone

      • 4.3.1 Key market trends, growth factors and opportunities

      • 4.3.2 Market size and forecast, by region

      • 4.3.3 Market analysis by country

    • 4.4 Others

      • 4.4.1 Key market trends, growth factors and opportunities

      • 4.4.2 Market size and forecast, by region

      • 4.4.3 Market analysis by country

  • CHAPTER 5: BLE BEACON MARKET, BY APPLICATION

    • 5.1 Overview

      • 5.1.1 Market size and forecast

    • 5.2 Proximity Marketing

      • 5.2.1 Key market trends, growth factors and opportunities

      • 5.2.2 Market size and forecast, by region

      • 5.2.3 Market analysis by country

    • 5.3 Asset Tracking

      • 5.3.1 Key market trends, growth factors and opportunities

      • 5.3.2 Market size and forecast, by region

      • 5.3.3 Market analysis by country

      • 5.3.4 Asset Tracking BLE Beacon Market by Asset Tracking

        • 5.3.4.1 BLE Readers Market size and forecast, by region
        • 5.3.4.2 BLE Readers Market size and forecast, by country
        • 5.3.4.3 BLE Tags Market size and forecast, by region
        • 5.3.4.4 BLE Tags Market size and forecast, by country
    • 5.4 Indoor Navigation

      • 5.4.1 Key market trends, growth factors and opportunities

      • 5.4.2 Market size and forecast, by region

      • 5.4.3 Market analysis by country

    • 5.5 Others

      • 5.5.1 Key market trends, growth factors and opportunities

      • 5.5.2 Market size and forecast, by region

      • 5.5.3 Market analysis by country

  • CHAPTER 6: BLE BEACON MARKET, BY INDUSTRY VERTICAL

    • 6.1 Overview

      • 6.1.1 Market size and forecast

    • 6.2 Retail

      • 6.2.1 Key market trends, growth factors and opportunities

      • 6.2.2 Market size and forecast, by region

      • 6.2.3 Market analysis by country

    • 6.3 Healthcare

      • 6.3.1 Key market trends, growth factors and opportunities

      • 6.3.2 Market size and forecast, by region

      • 6.3.3 Market analysis by country

    • 6.4 Travel and Tourism

      • 6.4.1 Key market trends, growth factors and opportunities

      • 6.4.2 Market size and forecast, by region

      • 6.4.3 Market analysis by country

    • 6.5 BFSI

      • 6.5.1 Key market trends, growth factors and opportunities

      • 6.5.2 Market size and forecast, by region

      • 6.5.3 Market analysis by country

    • 6.6 Automotive

      • 6.6.1 Key market trends, growth factors and opportunities

      • 6.6.2 Market size and forecast, by region

      • 6.6.3 Market analysis by country

    • 6.7 Others

      • 6.7.1 Key market trends, growth factors and opportunities

      • 6.7.2 Market size and forecast, by region

      • 6.7.3 Market analysis by country

  • CHAPTER 7: BLE BEACON MARKET, BY REGION

    • 7.1 Overview

      • 7.1.1 Market size and forecast

    • 7.2 North America

      • 7.2.1 Key trends and opportunities

      • 7.2.2 North America Market size and forecast, by by Type

      • 7.2.3 North America Market size and forecast, by Application

        • 7.2.3.1 North America Asset Tracking BLE Beacon Market by Asset Tracking
      • 7.2.4 North America Market size and forecast, by Industry Vertical

      • 7.2.5 North America Market size and forecast, by country

        • 7.2.5.1 U.S.
          • 7.2.5.1.1 Market size and forecast, by by Type
          • 7.2.5.1.2 Market size and forecast, by Application
            • 7.2.5.1.2.1 U.S. Asset Tracking BLE Beacon Market by Asset Tracking
          • 7.2.5.1.3 Market size and forecast, by Industry Vertical
        • 7.2.5.2 Canada
          • 7.2.5.2.1 Market size and forecast, by by Type
          • 7.2.5.2.2 Market size and forecast, by Application
            • 7.2.5.2.2.1 Canada Asset Tracking BLE Beacon Market by Asset Tracking
          • 7.2.5.2.3 Market size and forecast, by Industry Vertical
        • 7.2.5.3 Mexico
          • 7.2.5.3.1 Market size and forecast, by by Type
          • 7.2.5.3.2 Market size and forecast, by Application
            • 7.2.5.3.2.1 Mexico Asset Tracking BLE Beacon Market by Asset Tracking
          • 7.2.5.3.3 Market size and forecast, by Industry Vertical
    • 7.3 Europe

      • 7.3.1 Key trends and opportunities

      • 7.3.2 Europe Market size and forecast, by by Type

      • 7.3.3 Europe Market size and forecast, by Application

        • 7.3.3.1 Europe Asset Tracking BLE Beacon Market by Asset Tracking
      • 7.3.4 Europe Market size and forecast, by Industry Vertical

      • 7.3.5 Europe Market size and forecast, by country

        • 7.3.5.1 UK
          • 7.3.5.1.1 Market size and forecast, by by Type
          • 7.3.5.1.2 Market size and forecast, by Application
            • 7.3.5.1.2.1 UK Asset Tracking BLE Beacon Market by Asset Tracking
          • 7.3.5.1.3 Market size and forecast, by Industry Vertical
        • 7.3.5.2 Germany
          • 7.3.5.2.1 Market size and forecast, by by Type
          • 7.3.5.2.2 Market size and forecast, by Application
            • 7.3.5.2.2.1 Germany Asset Tracking BLE Beacon Market by Asset Tracking
          • 7.3.5.2.3 Market size and forecast, by Industry Vertical
        • 7.3.5.3 France
          • 7.3.5.3.1 Market size and forecast, by by Type
          • 7.3.5.3.2 Market size and forecast, by Application
            • 7.3.5.3.2.1 France Asset Tracking BLE Beacon Market by Asset Tracking
          • 7.3.5.3.3 Market size and forecast, by Industry Vertical
        • 7.3.5.4 Italy
          • 7.3.5.4.1 Market size and forecast, by by Type
          • 7.3.5.4.2 Market size and forecast, by Application
            • 7.3.5.4.2.1 Italy Asset Tracking BLE Beacon Market by Asset Tracking
          • 7.3.5.4.3 Market size and forecast, by Industry Vertical
        • 7.3.5.5 Spain
          • 7.3.5.5.1 Market size and forecast, by by Type
          • 7.3.5.5.2 Market size and forecast, by Application
            • 7.3.5.5.2.1 Spain Asset Tracking BLE Beacon Market by Asset Tracking
          • 7.3.5.5.3 Market size and forecast, by Industry Vertical
        • 7.3.5.6 Rest of Europe
          • 7.3.5.6.1 Market size and forecast, by by Type
          • 7.3.5.6.2 Market size and forecast, by Application
            • 7.3.5.6.2.1 Rest of Europe Asset Tracking BLE Beacon Market by Asset Tracking
          • 7.3.5.6.3 Market size and forecast, by Industry Vertical
    • 7.4 Asia-Pacific

      • 7.4.1 Key trends and opportunities

      • 7.4.2 Asia-Pacific Market size and forecast, by by Type

      • 7.4.3 Asia-Pacific Market size and forecast, by Application

        • 7.4.3.1 Asia-Pacific Asset Tracking BLE Beacon Market by Asset Tracking
      • 7.4.4 Asia-Pacific Market size and forecast, by Industry Vertical

      • 7.4.5 Asia-Pacific Market size and forecast, by country

        • 7.4.5.1 China
          • 7.4.5.1.1 Market size and forecast, by by Type
          • 7.4.5.1.2 Market size and forecast, by Application
            • 7.4.5.1.2.1 China Asset Tracking BLE Beacon Market by Asset Tracking
          • 7.4.5.1.3 Market size and forecast, by Industry Vertical
        • 7.4.5.2 Japan
          • 7.4.5.2.1 Market size and forecast, by by Type
          • 7.4.5.2.2 Market size and forecast, by Application
            • 7.4.5.2.2.1 Japan Asset Tracking BLE Beacon Market by Asset Tracking
          • 7.4.5.2.3 Market size and forecast, by Industry Vertical
        • 7.4.5.3 India
          • 7.4.5.3.1 Market size and forecast, by by Type
          • 7.4.5.3.2 Market size and forecast, by Application
            • 7.4.5.3.2.1 India Asset Tracking BLE Beacon Market by Asset Tracking
          • 7.4.5.3.3 Market size and forecast, by Industry Vertical
        • 7.4.5.4 South Korea
          • 7.4.5.4.1 Market size and forecast, by by Type
          • 7.4.5.4.2 Market size and forecast, by Application
            • 7.4.5.4.2.1 South Korea Asset Tracking BLE Beacon Market by Asset Tracking
          • 7.4.5.4.3 Market size and forecast, by Industry Vertical
        • 7.4.5.5 Australia
          • 7.4.5.5.1 Market size and forecast, by by Type
          • 7.4.5.5.2 Market size and forecast, by Application
            • 7.4.5.5.2.1 Australia Asset Tracking BLE Beacon Market by Asset Tracking
          • 7.4.5.5.3 Market size and forecast, by Industry Vertical
        • 7.4.5.6 Rest of Asia-Pacific
          • 7.4.5.6.1 Market size and forecast, by by Type
          • 7.4.5.6.2 Market size and forecast, by Application
            • 7.4.5.6.2.1 Rest of Asia-Pacific Asset Tracking BLE Beacon Market by Asset Tracking
          • 7.4.5.6.3 Market size and forecast, by Industry Vertical
    • 7.5 LAMEA

      • 7.5.1 Key trends and opportunities

      • 7.5.2 LAMEA Market size and forecast, by by Type

      • 7.5.3 LAMEA Market size and forecast, by Application

        • 7.5.3.1 LAMEA Asset Tracking BLE Beacon Market by Asset Tracking
      • 7.5.4 LAMEA Market size and forecast, by Industry Vertical

      • 7.5.5 LAMEA Market size and forecast, by country

        • 7.5.5.1 Latin America
          • 7.5.5.1.1 Market size and forecast, by by Type
          • 7.5.5.1.2 Market size and forecast, by Application
            • 7.5.5.1.2.1 Latin America Asset Tracking BLE Beacon Market by Asset Tracking
          • 7.5.5.1.3 Market size and forecast, by Industry Vertical
        • 7.5.5.2 Middle East
          • 7.5.5.2.1 Market size and forecast, by by Type
          • 7.5.5.2.2 Market size and forecast, by Application
            • 7.5.5.2.2.1 Middle East Asset Tracking BLE Beacon Market by Asset Tracking
          • 7.5.5.2.3 Market size and forecast, by Industry Vertical
        • 7.5.5.3 Africa
          • 7.5.5.3.1 Market size and forecast, by by Type
          • 7.5.5.3.2 Market size and forecast, by Application
            • 7.5.5.3.2.1 Africa Asset Tracking BLE Beacon Market by Asset Tracking
          • 7.5.5.3.3 Market size and forecast, by Industry Vertical
  • CHAPTER 8: COMPANY LANDSCAPE

    • 8.1. Introduction

    • 8.2. Top winning strategies

    • 8.3. Product Mapping of Top 10 Player

    • 8.4. Competitive Dashboard

    • 8.5. Competitive Heatmap

    • 8.6. Key developments

  • CHAPTER 9: COMPANY PROFILES

    • 9.1 UFO Beacons

      • 9.1.1 Company overview

      • 9.1.2 Company snapshot

      • 9.1.3 Operating business segments

      • 9.1.4 Product portfolio

      • 9.1.5 Business performance

      • 9.1.6 Key strategic moves and developments

    • 9.2 Estimote Inc.

      • 9.2.1 Company overview

      • 9.2.2 Company snapshot

      • 9.2.3 Operating business segments

      • 9.2.4 Product portfolio

      • 9.2.5 Business performance

      • 9.2.6 Key strategic moves and developments

    • 9.3 k2b solutions

      • 9.3.1 Company overview

      • 9.3.2 Company snapshot

      • 9.3.3 Operating business segments

      • 9.3.4 Product portfolio

      • 9.3.5 Business performance

      • 9.3.6 Key strategic moves and developments

    • 9.4 Google LLC

      • 9.4.1 Company overview

      • 9.4.2 Company snapshot

      • 9.4.3 Operating business segments

      • 9.4.4 Product portfolio

      • 9.4.5 Business performance

      • 9.4.6 Key strategic moves and developments

    • 9.5 Apple Inc.

      • 9.5.1 Company overview

      • 9.5.2 Company snapshot

      • 9.5.3 Operating business segments

      • 9.5.4 Product portfolio

      • 9.5.5 Business performance

      • 9.5.6 Key strategic moves and developments

    • 9.6 Mobstac Inc

      • 9.6.1 Company overview

      • 9.6.2 Company snapshot

      • 9.6.3 Operating business segments

      • 9.6.4 Product portfolio

      • 9.6.5 Business performance

      • 9.6.6 Key strategic moves and developments

    • 9.7 Proximity Solutions

      • 9.7.1 Company overview

      • 9.7.2 Company snapshot

      • 9.7.3 Operating business segments

      • 9.7.4 Product portfolio

      • 9.7.5 Business performance

      • 9.7.6 Key strategic moves and developments

    • 9.8 JK Technosoft

      • 9.8.1 Company overview

      • 9.8.2 Company snapshot

      • 9.8.3 Operating business segments

      • 9.8.4 Product portfolio

      • 9.8.5 Business performance

      • 9.8.6 Key strategic moves and developments

    • 9.9 Accent Systems

      • 9.9.1 Company overview

      • 9.9.2 Company snapshot

      • 9.9.3 Operating business segments

      • 9.9.4 Product portfolio

      • 9.9.5 Business performance

      • 9.9.6 Key strategic moves and developments

    • 9.10 BlueCats

      • 9.10.1 Company overview

      • 9.10.2 Company snapshot

      • 9.10.3 Operating business segments

      • 9.10.4 Product portfolio

      • 9.10.5 Business performance

      • 9.10.6 Key strategic moves and developments

    • 9.11 Bluvision

      • 9.11.1 Company overview

      • 9.11.2 Company snapshot

      • 9.11.3 Operating business segments

      • 9.11.4 Product portfolio

      • 9.11.5 Business performance

      • 9.11.6 Key strategic moves and developments

    • 9.12 Onyx Beacon

      • 9.12.1 Company overview

      • 9.12.2 Company snapshot

      • 9.12.3 Operating business segments

      • 9.12.4 Product portfolio

      • 9.12.5 Business performance

      • 9.12.6 Key strategic moves and developments

    • 9.13 Gelo

      • 9.13.1 Company overview

      • 9.13.2 Company snapshot

      • 9.13.3 Operating business segments

      • 9.13.4 Product portfolio

      • 9.13.5 Business performance

      • 9.13.6 Key strategic moves and developments

    • 9.14 MobileCoderz Technologies Pvt Ltd

      • 9.14.1 Company overview

      • 9.14.2 Company snapshot

      • 9.14.3 Operating business segments

      • 9.14.4 Product portfolio

      • 9.14.5 Business performance

      • 9.14.6 Key strategic moves and developments

    • 9.15 Kontakt

      • 9.15.1 Company overview

      • 9.15.2 Company snapshot

      • 9.15.3 Operating business segments

      • 9.15.4 Product portfolio

      • 9.15.5 Business performance

      • 9.15.6 Key strategic moves and developments

    • 9.16 GCell

      • 9.16.1 Company overview

      • 9.16.2 Company snapshot

      • 9.16.3 Operating business segments

      • 9.16.4 Product portfolio

      • 9.16.5 Business performance

      • 9.16.6 Key strategic moves and developments

    • 9.17 Hewlett Packard Enterprise

      • 9.17.1 Company overview

      • 9.17.2 Company snapshot

      • 9.17.3 Operating business segments

      • 9.17.4 Product portfolio

      • 9.17.5 Business performance

      • 9.17.6 Key strategic moves and developments

  • LIST OF TABLES

  • TABLE 1. GLOBAL BLE BEACON MARKET, BY BY TYPE, 2019-2030 ($MILLION)
    TABLE 2. BLE BEACON MARKET, FOR IBEACON, BY REGION, 2019-2030 ($MILLION)
    TABLE 3. BLE BEACON MARKET FOR IBEACON, BY COUNTRY, 2019-2030 ($MILLION)
    TABLE 4. BLE BEACON MARKET, FOR EDDYSTONE, BY REGION, 2019-2030 ($MILLION)
    TABLE 5. BLE BEACON MARKET FOR EDDYSTONE, BY COUNTRY, 2019-2030 ($MILLION)
    TABLE 6. BLE BEACON MARKET, FOR OTHERS, BY REGION, 2019-2030 ($MILLION)
    TABLE 7. BLE BEACON MARKET FOR OTHERS, BY COUNTRY, 2019-2030 ($MILLION)
    TABLE 8. GLOBAL BLE BEACON MARKET, BY APPLICATION, 2019-2030 ($MILLION)
    TABLE 9. BLE BEACON MARKET, FOR PROXIMITY MARKETING, BY REGION, 2019-2030 ($MILLION)
    TABLE 10. BLE BEACON MARKET FOR PROXIMITY MARKETING, BY COUNTRY, 2019-2030 ($MILLION)
    TABLE 11. BLE BEACON MARKET, FOR ASSET TRACKING, BY REGION, 2019-2030 ($MILLION)
    TABLE 12. BLE BEACON MARKET FOR ASSET TRACKING, BY COUNTRY, 2019-2030 ($MILLION)
    TABLE 13. GLOBAL ASSET TRACKING BLE BEACON MARKET, BY ASSET TRACKING, 2019-2030 ($MILLION)
    TABLE 14. BLE BEACON MARKET, FOR BLE READERS, BY REGION, 2019-2030 ($MILLION)
    TABLE 15. BLE BEACON MARKET, FOR BLE READERS, BY COUNTRY, 2019-2030 ($MILLION)
    TABLE 16. BLE BEACON MARKET, FOR BLE TAGS, BY REGION, 2019-2030 ($MILLION)
    TABLE 17. BLE BEACON MARKET, FOR BLE TAGS, BY COUNTRY, 2019-2030 ($MILLION)
    TABLE 18. BLE BEACON MARKET, FOR INDOOR NAVIGATION, BY REGION, 2019-2030 ($MILLION)
    TABLE 19. BLE BEACON MARKET FOR INDOOR NAVIGATION, BY COUNTRY, 2019-2030 ($MILLION)
    TABLE 20. BLE BEACON MARKET, FOR OTHERS, BY REGION, 2019-2030 ($MILLION)
    TABLE 21. BLE BEACON MARKET FOR OTHERS, BY COUNTRY, 2019-2030 ($MILLION)
    TABLE 22. GLOBAL BLE BEACON MARKET, BY INDUSTRY VERTICAL, 2019-2030 ($MILLION)
    TABLE 23. BLE BEACON MARKET, FOR RETAIL, BY REGION, 2019-2030 ($MILLION)
    TABLE 24. BLE BEACON MARKET FOR RETAIL, BY COUNTRY, 2019-2030 ($MILLION)
    TABLE 25. BLE BEACON MARKET, FOR HEALTHCARE, BY REGION, 2019-2030 ($MILLION)
    TABLE 26. BLE BEACON MARKET FOR HEALTHCARE, BY COUNTRY, 2019-2030 ($MILLION)
    TABLE 27. BLE BEACON MARKET, FOR TRAVEL AND TOURISM, BY REGION, 2019-2030 ($MILLION)
    TABLE 28. BLE BEACON MARKET FOR TRAVEL AND TOURISM, BY COUNTRY, 2019-2030 ($MILLION)
    TABLE 29. BLE BEACON MARKET, FOR BFSI, BY REGION, 2019-2030 ($MILLION)
    TABLE 30. BLE BEACON MARKET FOR BFSI, BY COUNTRY, 2019-2030 ($MILLION)
    TABLE 31. BLE BEACON MARKET, FOR AUTOMOTIVE, BY REGION, 2019-2030 ($MILLION)
    TABLE 32. BLE BEACON MARKET FOR AUTOMOTIVE, BY COUNTRY, 2019-2030 ($MILLION)
    TABLE 33. BLE BEACON MARKET, FOR OTHERS, BY REGION, 2019-2030 ($MILLION)
    TABLE 34. BLE BEACON MARKET FOR OTHERS, BY COUNTRY, 2019-2030 ($MILLION)
    TABLE 35. BLE BEACON MARKET, BY REGION, 2019-2030 ($MILLION)
    TABLE 36. NORTH AMERICA BLE BEACON MARKET, BY BY TYPE, 2019-2030 ($MILLION)
    TABLE 37. NORTH AMERICA BLE BEACON MARKET, BY APPLICATION, 2019-2030 ($MILLION)
    TABLE 38. NORTH AMERICA ASSET TRACKING BLE BEACON MARKET, BY ASSET TRACKING, 2019-2030 ($MILLION)
    TABLE 39. NORTH AMERICA BLE BEACON MARKET, BY INDUSTRY VERTICAL, 2019-2030 ($MILLION)
    TABLE 40. NORTH AMERICA BLE BEACON MARKET, BY COUNTRY, 2019-2030 ($MILLION)
    TABLE 41. U.S. BLE BEACON MARKET, BY BY TYPE, 2019-2030 ($MILLION)
    TABLE 42. U.S. BLE BEACON MARKET, BY APPLICATION, 2019-2030 ($MILLION)
    TABLE 43. U.S. ASSET TRACKING BLE BEACON MARKET, BY ASSET TRACKING, 2019-2030 ($MILLION)
    TABLE 44. U.S. BLE BEACON MARKET, BY INDUSTRY VERTICAL, 2019-2030 ($MILLION)
    TABLE 45. CANADA BLE BEACON MARKET, BY BY TYPE, 2019-2030 ($MILLION)
    TABLE 46. CANADA BLE BEACON MARKET, BY APPLICATION, 2019-2030 ($MILLION)
    TABLE 47. CANADA ASSET TRACKING BLE BEACON MARKET, BY ASSET TRACKING, 2019-2030 ($MILLION)
    TABLE 48. CANADA BLE BEACON MARKET, BY INDUSTRY VERTICAL, 2019-2030 ($MILLION)
    TABLE 49. MEXICO BLE BEACON MARKET, BY BY TYPE, 2019-2030 ($MILLION)
    TABLE 50. MEXICO BLE BEACON MARKET, BY APPLICATION, 2019-2030 ($MILLION)
    TABLE 51. MEXICO ASSET TRACKING BLE BEACON MARKET, BY ASSET TRACKING, 2019-2030 ($MILLION)
    TABLE 52. MEXICO BLE BEACON MARKET, BY INDUSTRY VERTICAL, 2019-2030 ($MILLION)
    TABLE 53. EUROPE BLE BEACON MARKET, BY BY TYPE, 2019-2030 ($MILLION)
    TABLE 54. EUROPE BLE BEACON MARKET, BY APPLICATION, 2019-2030 ($MILLION)
    TABLE 55. EUROPE ASSET TRACKING BLE BEACON MARKET, BY ASSET TRACKING, 2019-2030 ($MILLION)
    TABLE 56. EUROPE BLE BEACON MARKET, BY INDUSTRY VERTICAL, 2019-2030 ($MILLION)
    TABLE 57. EUROPE BLE BEACON MARKET, BY COUNTRY, 2019-2030 ($MILLION)
    TABLE 58. UK BLE BEACON MARKET, BY BY TYPE, 2019-2030 ($MILLION)
    TABLE 59. UK BLE BEACON MARKET, BY APPLICATION, 2019-2030 ($MILLION)
    TABLE 60. UK ASSET TRACKING BLE BEACON MARKET, BY ASSET TRACKING, 2019-2030 ($MILLION)
    TABLE 61. UK BLE BEACON MARKET, BY INDUSTRY VERTICAL, 2019-2030 ($MILLION)
    TABLE 62. GERMANY BLE BEACON MARKET, BY BY TYPE, 2019-2030 ($MILLION)
    TABLE 63. GERMANY BLE BEACON MARKET, BY APPLICATION, 2019-2030 ($MILLION)
    TABLE 64. GERMANY ASSET TRACKING BLE BEACON MARKET, BY ASSET TRACKING, 2019-2030 ($MILLION)
    TABLE 65. GERMANY BLE BEACON MARKET, BY INDUSTRY VERTICAL, 2019-2030 ($MILLION)
    TABLE 66. FRANCE BLE BEACON MARKET, BY BY TYPE, 2019-2030 ($MILLION)
    TABLE 67. FRANCE BLE BEACON MARKET, BY APPLICATION, 2019-2030 ($MILLION)
    TABLE 68. FRANCE ASSET TRACKING BLE BEACON MARKET, BY ASSET TRACKING, 2019-2030 ($MILLION)
    TABLE 69. FRANCE BLE BEACON MARKET, BY INDUSTRY VERTICAL, 2019-2030 ($MILLION)
    TABLE 70. ITALY BLE BEACON MARKET, BY BY TYPE, 2019-2030 ($MILLION)
    TABLE 71. ITALY BLE BEACON MARKET, BY APPLICATION, 2019-2030 ($MILLION)
    TABLE 72. ITALY ASSET TRACKING BLE BEACON MARKET, BY ASSET TRACKING, 2019-2030 ($MILLION)
    TABLE 73. ITALY BLE BEACON MARKET, BY INDUSTRY VERTICAL, 2019-2030 ($MILLION)
    TABLE 74. SPAIN BLE BEACON MARKET, BY BY TYPE, 2019-2030 ($MILLION)
    TABLE 75. SPAIN BLE BEACON MARKET, BY APPLICATION, 2019-2030 ($MILLION)
    TABLE 76. SPAIN ASSET TRACKING BLE BEACON MARKET, BY ASSET TRACKING, 2019-2030 ($MILLION)
    TABLE 77. SPAIN BLE BEACON MARKET, BY INDUSTRY VERTICAL, 2019-2030 ($MILLION)
    TABLE 78. REST OF EUROPE BLE BEACON MARKET, BY BY TYPE, 2019-2030 ($MILLION)
    TABLE 79. REST OF EUROPE BLE BEACON MARKET, BY APPLICATION, 2019-2030 ($MILLION)
    TABLE 80. REST OF EUROPE ASSET TRACKING BLE BEACON MARKET, BY ASSET TRACKING, 2019-2030 ($MILLION)
    TABLE 81. REST OF EUROPE BLE BEACON MARKET, BY INDUSTRY VERTICAL, 2019-2030 ($MILLION)
    TABLE 82. ASIA-PACIFIC BLE BEACON MARKET, BY BY TYPE, 2019-2030 ($MILLION)
    TABLE 83. ASIA-PACIFIC BLE BEACON MARKET, BY APPLICATION, 2019-2030 ($MILLION)
    TABLE 84. ASIA-PACIFIC ASSET TRACKING BLE BEACON MARKET, BY ASSET TRACKING, 2019-2030 ($MILLION)
    TABLE 85. ASIA-PACIFIC BLE BEACON MARKET, BY INDUSTRY VERTICAL, 2019-2030 ($MILLION)
    TABLE 86. ASIA-PACIFIC BLE BEACON MARKET, BY COUNTRY, 2019-2030 ($MILLION)
    TABLE 87. CHINA BLE BEACON MARKET, BY BY TYPE, 2019-2030 ($MILLION)
    TABLE 88. CHINA BLE BEACON MARKET, BY APPLICATION, 2019-2030 ($MILLION)
    TABLE 89. CHINA ASSET TRACKING BLE BEACON MARKET, BY ASSET TRACKING, 2019-2030 ($MILLION)
    TABLE 90. CHINA BLE BEACON MARKET, BY INDUSTRY VERTICAL, 2019-2030 ($MILLION)
    TABLE 91. JAPAN BLE BEACON MARKET, BY BY TYPE, 2019-2030 ($MILLION)
    TABLE 92. JAPAN BLE BEACON MARKET, BY APPLICATION, 2019-2030 ($MILLION)
    TABLE 93. JAPAN ASSET TRACKING BLE BEACON MARKET, BY ASSET TRACKING, 2019-2030 ($MILLION)
    TABLE 94. JAPAN BLE BEACON MARKET, BY INDUSTRY VERTICAL, 2019-2030 ($MILLION)
    TABLE 95. INDIA BLE BEACON MARKET, BY BY TYPE, 2019-2030 ($MILLION)
    TABLE 96. INDIA BLE BEACON MARKET, BY APPLICATION, 2019-2030 ($MILLION)
    TABLE 97. INDIA ASSET TRACKING BLE BEACON MARKET, BY ASSET TRACKING, 2019-2030 ($MILLION)
    TABLE 98. INDIA BLE BEACON MARKET, BY INDUSTRY VERTICAL, 2019-2030 ($MILLION)
    TABLE 99. SOUTH KOREA BLE BEACON MARKET, BY BY TYPE, 2019-2030 ($MILLION)
    TABLE 100. SOUTH KOREA BLE BEACON MARKET, BY APPLICATION, 2019-2030 ($MILLION)
    TABLE 101. SOUTH KOREA ASSET TRACKING BLE BEACON MARKET, BY ASSET TRACKING, 2019-2030 ($MILLION)
    TABLE 102. SOUTH KOREA BLE BEACON MARKET, BY INDUSTRY VERTICAL, 2019-2030 ($MILLION)
    TABLE 103. AUSTRALIA BLE BEACON MARKET, BY BY TYPE, 2019-2030 ($MILLION)
    TABLE 104. AUSTRALIA BLE BEACON MARKET, BY APPLICATION, 2019-2030 ($MILLION)
    TABLE 105. AUSTRALIA ASSET TRACKING BLE BEACON MARKET, BY ASSET TRACKING, 2019-2030 ($MILLION)
    TABLE 106. AUSTRALIA BLE BEACON MARKET, BY INDUSTRY VERTICAL, 2019-2030 ($MILLION)
    TABLE 107. REST OF ASIA-PACIFIC BLE BEACON MARKET, BY BY TYPE, 2019-2030 ($MILLION)
    TABLE 108. REST OF ASIA-PACIFIC BLE BEACON MARKET, BY APPLICATION, 2019-2030 ($MILLION)
    TABLE 109. REST OF ASIA-PACIFIC ASSET TRACKING BLE BEACON MARKET, BY ASSET TRACKING, 2019-2030 ($MILLION)
    TABLE 110. REST OF ASIA-PACIFIC BLE BEACON MARKET, BY INDUSTRY VERTICAL, 2019-2030 ($MILLION)
    TABLE 111. LAMEA BLE BEACON MARKET, BY BY TYPE, 2019-2030 ($MILLION)
    TABLE 112. LAMEA BLE BEACON MARKET, BY APPLICATION, 2019-2030 ($MILLION)
    TABLE 113. LAMEA ASSET TRACKING BLE BEACON MARKET, BY ASSET TRACKING, 2019-2030 ($MILLION)
    TABLE 114. LAMEA BLE BEACON MARKET, BY INDUSTRY VERTICAL, 2019-2030 ($MILLION)
    TABLE 115. LAMEA BLE BEACON MARKET, BY COUNTRY, 2019-2030 ($MILLION)
    TABLE 116. LATIN AMERICA BLE BEACON MARKET, BY BY TYPE, 2019-2030 ($MILLION)
    TABLE 117. LATIN AMERICA BLE BEACON MARKET, BY APPLICATION, 2019-2030 ($MILLION)
    TABLE 118. LATIN AMERICA ASSET TRACKING BLE BEACON MARKET, BY ASSET TRACKING, 2019-2030 ($MILLION)
    TABLE 119. LATIN AMERICA BLE BEACON MARKET, BY INDUSTRY VERTICAL, 2019-2030 ($MILLION)
    TABLE 120. MIDDLE EAST BLE BEACON MARKET, BY BY TYPE, 2019-2030 ($MILLION)
    TABLE 121. MIDDLE EAST BLE BEACON MARKET, BY APPLICATION, 2019-2030 ($MILLION)
    TABLE 122. MIDDLE EAST ASSET TRACKING BLE BEACON MARKET, BY ASSET TRACKING, 2019-2030 ($MILLION)
    TABLE 123. MIDDLE EAST BLE BEACON MARKET, BY INDUSTRY VERTICAL, 2019-2030 ($MILLION)
    TABLE 124. AFRICA BLE BEACON MARKET, BY BY TYPE, 2019-2030 ($MILLION)
    TABLE 125. AFRICA BLE BEACON MARKET, BY APPLICATION, 2019-2030 ($MILLION)
    TABLE 126. AFRICA ASSET TRACKING BLE BEACON MARKET, BY ASSET TRACKING, 2019-2030 ($MILLION)
    TABLE 127. AFRICA BLE BEACON MARKET, BY INDUSTRY VERTICAL, 2019-2030 ($MILLION)
    TABLE 128.UFO BEACONS: COMPANY SNAPSHOT
    TABLE 129.UFO BEACONS: OPERATING SEGMENTS
    TABLE 130.UFO BEACONS: PRODUCT PORTFOLIO
    TABLE 131.UFO BEACONS: NET SALES,
    TABLE 132.UFO BEACONS: KEY STRATERGIES
    TABLE 133.ESTIMOTE INC.: COMPANY SNAPSHOT
    TABLE 134.ESTIMOTE INC.: OPERATING SEGMENTS
    TABLE 135.ESTIMOTE INC.: PRODUCT PORTFOLIO
    TABLE 136.ESTIMOTE INC.: NET SALES,
    TABLE 137.ESTIMOTE INC.: KEY STRATERGIES
    TABLE 138.K2B SOLUTIONS: COMPANY SNAPSHOT
    TABLE 139.K2B SOLUTIONS: OPERATING SEGMENTS
    TABLE 140.K2B SOLUTIONS: PRODUCT PORTFOLIO
    TABLE 141.K2B SOLUTIONS: NET SALES,
    TABLE 142.K2B SOLUTIONS: KEY STRATERGIES
    TABLE 143.GOOGLE LLC: COMPANY SNAPSHOT
    TABLE 144.GOOGLE LLC: OPERATING SEGMENTS
    TABLE 145.GOOGLE LLC: PRODUCT PORTFOLIO
    TABLE 146.GOOGLE LLC: NET SALES,
    TABLE 147.GOOGLE LLC: KEY STRATERGIES
    TABLE 148.APPLE INC.: COMPANY SNAPSHOT
    TABLE 149.APPLE INC.: OPERATING SEGMENTS
    TABLE 150.APPLE INC.: PRODUCT PORTFOLIO
    TABLE 151.APPLE INC.: NET SALES,
    TABLE 152.APPLE INC.: KEY STRATERGIES
    TABLE 153.MOBSTAC INC: COMPANY SNAPSHOT
    TABLE 154.MOBSTAC INC: OPERATING SEGMENTS
    TABLE 155.MOBSTAC INC: PRODUCT PORTFOLIO
    TABLE 156.MOBSTAC INC: NET SALES,
    TABLE 157.MOBSTAC INC: KEY STRATERGIES
    TABLE 158.PROXIMITY SOLUTIONS: COMPANY SNAPSHOT
    TABLE 159.PROXIMITY SOLUTIONS: OPERATING SEGMENTS
    TABLE 160.PROXIMITY SOLUTIONS: PRODUCT PORTFOLIO
    TABLE 161.PROXIMITY SOLUTIONS: NET SALES,
    TABLE 162.PROXIMITY SOLUTIONS: KEY STRATERGIES
    TABLE 163.JK TECHNOSOFT: COMPANY SNAPSHOT
    TABLE 164.JK TECHNOSOFT: OPERATING SEGMENTS
    TABLE 165.JK TECHNOSOFT: PRODUCT PORTFOLIO
    TABLE 166.JK TECHNOSOFT: NET SALES,
    TABLE 167.JK TECHNOSOFT: KEY STRATERGIES
    TABLE 168.ACCENT SYSTEMS: COMPANY SNAPSHOT
    TABLE 169.ACCENT SYSTEMS: OPERATING SEGMENTS
    TABLE 170.ACCENT SYSTEMS: PRODUCT PORTFOLIO
    TABLE 171.ACCENT SYSTEMS: NET SALES,
    TABLE 172.ACCENT SYSTEMS: KEY STRATERGIES
    TABLE 173.BLUECATS: COMPANY SNAPSHOT
    TABLE 174.BLUECATS: OPERATING SEGMENTS
    TABLE 175.BLUECATS: PRODUCT PORTFOLIO
    TABLE 176.BLUECATS: NET SALES,
    TABLE 177.BLUECATS: KEY STRATERGIES
    TABLE 178.BLUVISION: COMPANY SNAPSHOT
    TABLE 179.BLUVISION: OPERATING SEGMENTS
    TABLE 180.BLUVISION: PRODUCT PORTFOLIO
    TABLE 181.BLUVISION: NET SALES,
    TABLE 182.BLUVISION: KEY STRATERGIES
    TABLE 183.ONYX BEACON: COMPANY SNAPSHOT
    TABLE 184.ONYX BEACON: OPERATING SEGMENTS
    TABLE 185.ONYX BEACON: PRODUCT PORTFOLIO
    TABLE 186.ONYX BEACON: NET SALES,
    TABLE 187.ONYX BEACON: KEY STRATERGIES
    TABLE 188.GELO: COMPANY SNAPSHOT
    TABLE 189.GELO: OPERATING SEGMENTS
    TABLE 190.GELO: PRODUCT PORTFOLIO
    TABLE 191.GELO: NET SALES,
    TABLE 192.GELO: KEY STRATERGIES
    TABLE 193.MOBILECODERZ TECHNOLOGIES PVT LTD: COMPANY SNAPSHOT
    TABLE 194.MOBILECODERZ TECHNOLOGIES PVT LTD: OPERATING SEGMENTS
    TABLE 195.MOBILECODERZ TECHNOLOGIES PVT LTD: PRODUCT PORTFOLIO
    TABLE 196.MOBILECODERZ TECHNOLOGIES PVT LTD: NET SALES,
    TABLE 197.MOBILECODERZ TECHNOLOGIES PVT LTD: KEY STRATERGIES
    TABLE 198.KONTAKT: COMPANY SNAPSHOT
    TABLE 199.KONTAKT: OPERATING SEGMENTS
    TABLE 200.KONTAKT: PRODUCT PORTFOLIO
    TABLE 201.KONTAKT: NET SALES,
    TABLE 202.KONTAKT: KEY STRATERGIES
    TABLE 203.GCELL: COMPANY SNAPSHOT
    TABLE 204.GCELL: OPERATING SEGMENTS
    TABLE 205.GCELL: PRODUCT PORTFOLIO
    TABLE 206.GCELL: NET SALES,
    TABLE 207.GCELL: KEY STRATERGIES
    TABLE 208.HEWLETT PACKARD ENTERPRISE: COMPANY SNAPSHOT
    TABLE 209.HEWLETT PACKARD ENTERPRISE: OPERATING SEGMENTS
    TABLE 210.HEWLETT PACKARD ENTERPRISE: PRODUCT PORTFOLIO
    TABLE 211.HEWLETT PACKARD ENTERPRISE: NET SALES,
    TABLE 212.HEWLETT PACKARD ENTERPRISE: KEY STRATERGIES
  • LIST OF FIGURES

  • FIGURE 1.BLE BEACON MARKET SEGMENTATION
    FIGURE 2.BLE BEACON MARKET,2019-2030
    FIGURE 3.BLE BEACON MARKET,2019-2030
    FIGURE 4. TOP INVESTMENT POCKETS, BY REGION
    FIGURE 5.PORTER FIVE-1
    FIGURE 6.PORTER FIVE-2
    FIGURE 7.PORTER FIVE-3
    FIGURE 8.PORTER FIVE-4
    FIGURE 9.PORTER FIVE-5
    FIGURE 10.TOP PLAYER POSITIONING
    FIGURE 11.BLE BEACON MARKET:DRIVERS, RESTRAINTS AND OPPORTUNITIES
    FIGURE 12.BLE BEACON MARKET,BY BY TYPE,2019(%)
    FIGURE 13.COMPARATIVE SHARE ANALYSIS OF IBEACON BLE BEACON MARKET,2019-2030(%)
    FIGURE 14.COMPARATIVE SHARE ANALYSIS OF EDDYSTONE BLE BEACON MARKET,2019-2030(%)
    FIGURE 15.COMPARATIVE SHARE ANALYSIS OF OTHERS BLE BEACON MARKET,2019-2030(%)
    FIGURE 16.BLE BEACON MARKET,BY APPLICATION,2019(%)
    FIGURE 17.COMPARATIVE SHARE ANALYSIS OF PROXIMITY MARKETING BLE BEACON MARKET,2019-2030(%)
    FIGURE 18.COMPARATIVE SHARE ANALYSIS OF ASSET TRACKING BLE BEACON MARKET,2019-2030(%)
    FIGURE 19.COMPARATIVE SHARE ANALYSIS OF INDOOR NAVIGATION BLE BEACON MARKET,2019-2030(%)
    FIGURE 20.COMPARATIVE SHARE ANALYSIS OF OTHERS BLE BEACON MARKET,2019-2030(%)
    FIGURE 21.BLE BEACON MARKET,BY INDUSTRY VERTICAL,2019(%)
    FIGURE 22.COMPARATIVE SHARE ANALYSIS OF RETAIL BLE BEACON MARKET,2019-2030(%)
    FIGURE 23.COMPARATIVE SHARE ANALYSIS OF HEALTHCARE BLE BEACON MARKET,2019-2030(%)
    FIGURE 24.COMPARATIVE SHARE ANALYSIS OF TRAVEL AND TOURISM BLE BEACON MARKET,2019-2030(%)
    FIGURE 25.COMPARATIVE SHARE ANALYSIS OF BFSI BLE BEACON MARKET,2019-2030(%)
    FIGURE 26.COMPARATIVE SHARE ANALYSIS OF AUTOMOTIVE BLE BEACON MARKET,2019-2030(%)
    FIGURE 27.COMPARATIVE SHARE ANALYSIS OF OTHERS BLE BEACON MARKET,2019-2030(%)
    FIGURE 28.BLE BEACON MARKET BY REGION,2019
    FIGURE 29.U.S. BLE BEACON MARKET,2019-2030($MILLION)
    FIGURE 30.CANADA BLE BEACON MARKET,2019-2030($MILLION)
    FIGURE 31.MEXICO BLE BEACON MARKET,2019-2030($MILLION)
    FIGURE 32.UK BLE BEACON MARKET,2019-2030($MILLION)
    FIGURE 33.GERMANY BLE BEACON MARKET,2019-2030($MILLION)
    FIGURE 34.FRANCE BLE BEACON MARKET,2019-2030($MILLION)
    FIGURE 35.ITALY BLE BEACON MARKET,2019-2030($MILLION)
    FIGURE 36.SPAIN BLE BEACON MARKET,2019-2030($MILLION)
    FIGURE 37.REST OF EUROPE BLE BEACON MARKET,2019-2030($MILLION)
    FIGURE 38.CHINA BLE BEACON MARKET,2019-2030($MILLION)
    FIGURE 39.JAPAN BLE BEACON MARKET,2019-2030($MILLION)
    FIGURE 40.INDIA BLE BEACON MARKET,2019-2030($MILLION)
    FIGURE 41.SOUTH KOREA BLE BEACON MARKET,2019-2030($MILLION)
    FIGURE 42.AUSTRALIA BLE BEACON MARKET,2019-2030($MILLION)
    FIGURE 43.REST OF ASIA-PACIFIC BLE BEACON MARKET,2019-2030($MILLION)
    FIGURE 44.LATIN AMERICA BLE BEACON MARKET,2019-2030($MILLION)
    FIGURE 45.MIDDLE EAST BLE BEACON MARKET,2019-2030($MILLION)
    FIGURE 46.AFRICA BLE BEACON MARKET,2019-2030($MILLION)
    FIGURE 47. TOP WINNING STRATEGIES, BY YEAR
    FIGURE 48. TOP WINNING STRATEGIES, BY DEVELOPMENT
    FIGURE 49. TOP WINNING STRATEGIES, BY COMPANY
    FIGURE 50.PRODUCT MAPPING OF TOP 10 PLAYERS
    FIGURE 51.COMPETITIVE DASHBOARD
    FIGURE 52.COMPETITIVE HEATMAP OF TOP 10 KEY PLAYERS
    FIGURE 53.UFO BEACONS.: NET SALES ,($MILLION)
    FIGURE 54.ESTIMOTE INC..: NET SALES ,($MILLION)
    FIGURE 55.K2B SOLUTIONS.: NET SALES ,($MILLION)
    FIGURE 56.GOOGLE LLC.: NET SALES ,($MILLION)
    FIGURE 57.APPLE INC..: NET SALES ,($MILLION)
    FIGURE 58.MOBSTAC INC.: NET SALES ,($MILLION)
    FIGURE 59.PROXIMITY SOLUTIONS.: NET SALES ,($MILLION)
    FIGURE 60.JK TECHNOSOFT.: NET SALES ,($MILLION)
    FIGURE 61.ACCENT SYSTEMS.: NET SALES ,($MILLION)
    FIGURE 62.BLUECATS.: NET SALES ,($MILLION)
    FIGURE 63.BLUVISION.: NET SALES ,($MILLION)
    FIGURE 64.ONYX BEACON.: NET SALES ,($MILLION)
    FIGURE 65.GELO.: NET SALES ,($MILLION)
    FIGURE 66.MOBILECODERZ TECHNOLOGIES PVT LTD.: NET SALES ,($MILLION)
    FIGURE 67.KONTAKT.: NET SALES ,($MILLION)
    FIGURE 68.GCELL.: NET SALES ,($MILLION)
    FIGURE 69.HEWLETT PACKARD ENTERPRISE.: NET SALES ,($MILLION)


The BLE beacon market is witnessing significant growth, owing to growth in the implementation of Wi-Fi, IoT, and others. Further, an increase in the popularity of proximity marketing is projected to drive the growth of the beacon market, as it is the simplest way to connect to customers. The market for BLE beacon is expanding, owing to the rise in the adoption of smart devices such as smartphones and tablets.

 Asia-Pacific is anticipated to have the fastest growth in the Global BLE beacon market during the forecast period, owing to a rise in investments in BLE beacons and widespread usage of internet of things (IoT) technology. In addition, BLE beacons have been widely adopted in the Asia-Pacific retail, healthcare, automotive, transportation, and educational sectors.

The most prominent factors that drive the global BLE beacon market growth include an increase in advanced communication technologies, an increase in investments in proximity marketing, and a rise in the adoption of smart devices. However, lack of presence of technological resources, lack of awareness, and concerns toward privacy & security hamper the market growth. Furthermore, the rise in demand for smartphone usage and development in organized retail sectors are the factors anticipated to provide lucrative opportunities for the BLE beacon market during the forecast period.

To stay competitive in the industry, major competitors concentrate on releasing technologically upgraded items. Product launches, contracts, collaborations, and partnerships are anticipated to be the key strategies used by industry participants. The BLE beacon market is expanding, owing improved features of solutions, including employee & asset monitoring, data generation, resource optimization, and others.

PURCHASE OPTIONS

Call or Email us

U.S.-Canada Toll-free: +1-800-792-5285
Int'l : +1-503-894-6022
Europe : +44-845-528-1300
Email : help@alliedmarketresearch.com
 
FREQUENTLY ASKED QUESTIONS?

A. Asia-Pacific specifically China, remains a significant participant in the BLE Beacon industry. Major organizations and government institutions in the emerging countries are intensely putting resources into the technology

A. The proximity marketing segment was the highest revenue contributor to the market and is estimated to grow at a high CAGR% during the forecast period.

A. The global BLE beacon market was valued at $1,950.7 million in 2019 and is projected to reach $69,174.7 million by 2030, registering a CAGR of 36.9% from 2022 to 2030.

A. The most prominent factors that drive the BLE beacon market growth include an increase in advanced communication technologies, an increase in investments in proximity marketing, and a rise in the adoption of smart devices.

A. Apple Inc, Bluvision, Estimote Inc, Google LLC, Hewlett Packard Enterprise Development LP, K2B Solutions are some of the top companies to hold the market share in BLE Beacon

Looking for Customization?

 Customization Request

Have a Question?

 Speak with Analyst

Any Confusion?

 Inquire Before Buying

Have a glance of the Report

  Request Sample
RELATED TAGS

Purchase Full Report of
Ble Beacon Market

Start reading instantly.
This Report and over 67,404+ more Reports, Available with Avenue Library. T&C*.

  • Online Only
  • $3,570
  • Online cloud access only
  • Restricted print, copy, paste & download
  • Read only
  • Free industry update
    (Within 180 days)
  • Free report update in next update cycle
    (Sep 2023 - Sep 2024)
  • Data Pack
  • $3,840
  • Restricted to one authorized user
  • One print only
  • Available in
    Excel
  • Free industry update
    (Within 180 days)
  •   Free report update in next update cycle
    (Sep 2023 - Sep 2024)
  • Single User
  • $5,730
  • Restricted to one authorized user
  • One print only
  • Available in
    PDF
  • Free industry update
    (Within 180 days)
  •   Free report update in next update cycle
    (Sep 2023 - Sep 2024)
  • Five Users
  • $6,450
  • Limited to five authorized users
  • Print upto five copies
  • Available in
    PDF
  • Free industry update
    (Within 180 days)
  •   Free report update in next update cycle
    (Sep 2023 - Sep 2024)
  • Enterprise
    License/PDF

  • $9,600
  • Unlimited
    within
    company/enterprise
  • Available in Excel & PDF
  • Free industry update
    (Within 180 days)
  •   Free report update in next update cycle
    (Sep 2023 - Sep 2024)
  • Library
    Membership

  • $999 $ 1,175
    Per User/ Per month/ Billed annually
  • Published Content
    E-access
  • Company Profiles
    E-access
  • Newly Added Content Access
  • 10 PDF
    Downloads
  • 5 Excel Data
    Pack Downloads
  • 250 Company Profiles PDF Downloads
  • Buy Now

*Taxes/Fees, if applicable will be added during checkout. All prices in USD

RELATED REPORTS
 

Why Allied Market Research?


Infallible Methodology

To ensure high-level data integrity, accurate analysis, and impeccable forecasts

Analyst Support

For complete satisfaction

Customization

On-demand customization of scope of the report to exactly meet your needs

TARGETED MARKET VIEW

Targeted market view to provide pertinent information and save time of readers

Get fresh content delivered

Get insights on topics that are crucial for your business. Stay abreast of your interest areas.

Get Industry Data Alerts

Why Allied Market Research?

Infallible Methodology

To ensure high-level data integrity, accurate analysis, and impeccable forecasts

Analyst Support

For complete satisfaction

Customization

On-demand customization of scope of the report to exactly meet your needs

TARGETED MARKET VIEW

Targeted market view to provide pertinent information and save time of readers