
Blood Group Typing Market Overview
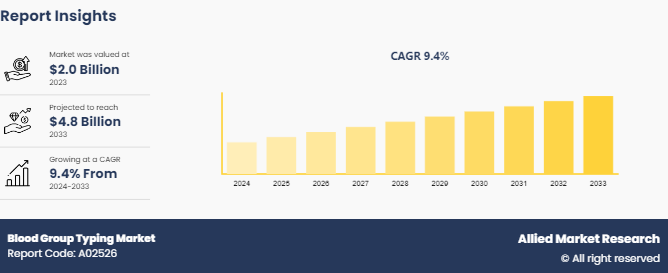
The global blood group typing market size was valued at $2.0 billion in 2023, and is projected to reach $4.8 billion by 2033, growing at a CAGR of 9.4% from 2024 to 2033. Rising surgical procedures, chronic diseases, organ transplants, and prenatal testing, along with technological advancements, government initiatives, and growing awareness about safe transfusions, are driving the blood group typing market growth.
Market Size & Future Outlook
- 2023 Market Size: $1.96 Billion
- 2033 Projected Market Size: $4.83 Billion
- CAGR (2024-2033): 9.44%
- North America: Largest market in 2023
- Asia Pacific: Fastest growing market
Market Introduction and Definition
Blood group typing is a crucial procedure in medicine that determines an individual's blood type based on the presence or absence of specific antigens and antibodies in their blood. The primary blood group systems are ABO system and Rh system. In the ABO system, blood is categorized into four main types, namely A, B, AB, and O. Type A blood has A antigens on the surface of red blood cells and anti-B antibodies in the plasma. Type B blood has B antigens and anti-A antibodies. Type AB blood has both A and B antigens and does not have any anti-A or anti-B antibodies; and type O blood does not have any A or B antigens but has both anti-A and anti-B antibodies. The Rh system further classifies blood based on the presence (Rh-positive) or absence (Rh-negative) of the Rh factor, a protein found on the surface of red blood cells. The major factors driving the growth of the blood group typing market are increase in demand for accurate and efficient blood typing in medical diagnostics and transfusion medicine. In addition, advancements in technology, such as the development of automated and high-throughput blood typing systems, have improved accuracy and efficiency, further fueling the market growth. Rise in incidence of chronic diseases and the need for precise blood matching in personalized medicine are also significant drivers for the market growth.
Key Takeaways
- The blood group typing market share study covers 20 countries. The research includes a segment analysis of each country in terms of value for the projected period.
- More than 1, 500 product literatures, industry releases, annual reports, and other such documents of major blood group typing industry participants along with authentic industry journals, trade associations' releases, and government websites have been reviewed for generating high-value industry insights.
- The study integrated high-quality data, professional opinions and analysis, and critical independent perspectives. The research approach is intended to provide a balanced view of global markets and to assist stakeholders in making educated decisions in order to achieve their most ambitious growth objectives.
Key Market Dynamics
According to blood group typing market forecast analysis key factors driving the growth of the market include rise in blood donation globally, surge in the requirement of blood for clinical use, and surge in prevalence of traumatic injuries leading to excessive blood loss. According to a 2023 article by National Library of Medicine, blood donation is highly important in global healthcare, with over 100 million blood units contributed annually. As awareness about the importance of blood donation increases and medical institutions enhance their blood collection efforts, there is a corresponding surge in demand for accurate and efficient blood group typing.
Blood group typing is crucial for ensuring compatibility between donors and recipients, preventing transfusion reactions, and managing various blood-related conditions. With more people voluntarily donating blood and the establishment of more organized blood donation campaigns, healthcare providers require advanced blood typing technologies to handle the growing volume of samples. Thus, the growing number of blood donations in the world is expected to drive the blood group typing market growth.
Furthermore, surge in the requirement of blood for clinical use is expected to drive the growth of the market. This heightened demand is driven by several factors, including the growing prevalence of chronic diseases, the expansion of surgical procedures, and rise in number of trauma cases that require immediate blood transfusions. According to a 2023 report by The American National Red Cross, it was estimated that a single car accident victim can require as many as 100 units of blood. In addition, the need for accurate blood typing is crucial in emergency situations and routine medical procedures to prevent transfusion reactions and enhance patient safety. As healthcare systems strive to manage and optimize blood supply chains effectively, the demand for advanced blood group typing technologies, such as automated systems and molecular methods, has surged. Thus, the requirement of blood for clinical use is expected to drive the growth of the blood group typing market size.
Parent Market Overview- Blood Screening Market
Blood screening is the process of testing the donated blood prior to transfusion to ensure that recipients receive the safest possible blood products. The objective of blood screening is to detect markers of infection to prevent the release of infected blood and blood components for clinical use. Blood screening strategies are designed to assure the safety of blood units. Based on the screening process, the blood is either used for medical applications or discarded if any infectious pathogen was found in it. The factors driving the growth of the market include rise in demand for donated blood and blood related products for medical applications, surge in number of blood donations globally, and strict protocols by regulatory body for screening of blood to ensure safe transfusion.

Blood Group Typing Market Segmentation Overview
The blood group typing industry is segmented on the basis of product, test type, technology, end user, and region. By product, the market is classified into instruments, kits, and reagents. By test type, the market is divided into ABO Tests, antigen typing, antibody screening, cross-matching tests, and HLA typing. By technology, the market is divided into serology tests and molecular tests. By end user, it is segregated into hospital-based laboratories and blood banks. Region-wise, the market is analyzed across North America, Europe, Asia-Pacific, and LAMEA.
Regional/Country Market Outlook
North America dominated the blood group typing market share in 2023 owing to substantial research and development activities, strong presence of major key players, well-established healthcare infrastructure, and growing cases of traumatic accidents. According to blood group typing market opportunity analysis in the Asia-Pacific region, rapid market expansion is anticipated due to improving healthcare infrastructure, developing healthcare infrastructure, and growing awareness about blood donation.
- According to a 2022 report by the U.S. Blood Statistics, 13.3% of total donated blood in U.S. was used for surgeries.
- According to a 2023 U.S. Blood Statistics, each year approximately 3% of the U.S. population donates blood.
- According to the Government of Maharashtra, Blood Transfusion Council, around 2 million units of blood was donated in Maharashtra in 2023.
Industry Trends
- According to a 2022 report by the U.S. Blood Statistics, blood donated in the U.S. in every 2 second is used for medical purpose.
- According to World Health Organization, in 2022, a total of 118.8 million blood donations were collected globally.
- According to a 2023 article by The American National Red Cross, approximately 29, 000 units of red blood cells are needed every day in the U. S.
- World Health Organization has declared 14th June of each year as World Blood Donor Day.
Competitive Landscape
The major players operating in the blood group typing market include Quotient Limited, CareDx Inc., Agena Bioscience, Inc., DIAGAST, Illumina, Inc, Grifols, S.A, Immucor, Inc, Bio-Rad Laboratories, Inc., Thermo Fisher Scientific Inc., and Merck KGaA. Other players in the Blood Group Typing market are QIAGEN, Danaher Corporation, and QuidelOrtho Corporation
What are the Recent Key Strategies and Developments
- In June 2023, Quotient Limited announced the launch of its ALBA products in Sweden and the Netherlands. The products were also launched in France, Germany, Austria, Hungary, Italy, Greece, Poland, Romania, Luxembourg, and Slovakia.
- In June 2023, Quotient Limited entered into a distribution agreement with Transmedic Pte Ltd to distribute ALBA by Quotient and MosaiQ in five Southeast Asian countries including, Indonesia, Singapore, Malaysia, Thailand, and Vietnam.
- In May 2023, Bio-Rad Laboratories, Inc., launched a fully automated system for ID cards, IH-500TM NEXT System, to meet the evolving demands and challenges in the laboratory and health environments.
- In April 2023, Metropolis Healthcare launched the 'NextGen HLA' Typing Test integrated with next-generation sequencing technology to aid the identification of donors for bone marrow, cord blood, or organ transplantation.
- In March 2023, Werfen acquired Immucor, Inc. to expand its portfolio of specialized diagnostic solutions for hospitals and clinical laboratories, receiving all necessary regulatory approvals.
- In July 2022, Quotient Limited signed an agreement with InfYnity Biomarkers to expand MosaiQ's infectious disease portfolio including blood screening tests.
- In April 2022, GenDx received Health Canada approval for NGSgo-MX11-3 HLA genotyping test. The test uses next-generation sequencing (NGS) technology to genotype 11 separate HLA genes.
- In March 2022, Quotient Limited announced that it received the CE Mark for its MosaiQ Extended Immunohematology (IH) Microarray. This IH microarray offers antigen typing, antibody screening, including ABO forward and reverse grouping.
- In April 2021, Quotient Limited announced positive results from its MosaiQ Multiplex Molecular Disease Screening (MDS) microarray study and the company's progress regarding MosaiQ expanded Immunohematology (IH) microarray was updated.
What are the Key Benefits for Stakeholders
- This report provides a quantitative analysis of the market segments, current trends, estimations, and dynamics of the blood group typing market analysis from 2024 to 2033 to identify the prevailing blood group typing market opportunities.
- The market research is offered along with information related to key drivers, restraints, and opportunities.
- Porter's five forces analysis highlights the potency of buyers and suppliers to enable stakeholders make profit-oriented business decisions and strengthen their supplier-buyer network.
- In-depth analysis of the blood group typing market segmentation assists to determine the prevailing market opportunities.
- Major countries in each region are mapped according to their revenue contribution to the global market.
- Market player positioning facilitates benchmarking and provides a clear understanding of the present position of the market players.
- The report includes the analysis of the regional as well as global blood group typing market trends, key players, market segments, application areas, and market growth strategies.
Blood Group Typing Market Report Highlights
| Aspects | Details |
| Market Size By 2033 | USD 4.8 Billion |
| Growth Rate | CAGR of 9.4% |
| Forecast period | 2024 - 2033 |
| Report Pages | 280 |
| By Product |
|
| By Test Type |
|
| By Technique |
|
| By End User |
|
| By Region |
|
| Key Market Players | Agena Bioscience, Inc., Merck KGaA, Bio-Rad Laboratories, Inc. , Illumina, Inc., Diagast S.A., CareDx Inc., Thermo Fisher Scientific Inc., Quotient Limited, Immucor, Inc, Grifols, S.A. |
The global blood group typing market size was valued at $2.0 billion in 2023
The market value of Blood Group Typing Market is projected to reach $4.8 billion by 2033.
The forecast period for Blood Group Typing Market is 2024-2033.
The base year is 2023 in Blood Group Typing Market
Major key players that operate in the Blood Group Typing Market are Quotient Limited, CareDx Inc., Agena Bioscience, Inc., DIAGAST, and Illumina, Inc
Loading Table Of Content...

