0
2022
Blood Stream Infection Testing Market

Blood Stream Infection Testing Market

by Product (Instruments, Consumables, Software and Services), by Technique (Conventional, Automated), by Technology (Culture-based, Molecular, Proteomic), by Application (Bacterial, Fungal, Mycobacterial), by End-users (Hospitals, Independent Diagnostics Centers, Others): Global Opportunity Analysis and Industry Forecast, 2021-2030

Report Code: A03590
Jul 2022 | Pages: 180
Tables: 164
Charts: 73
  • Formats*:

  • pdf

    Single User License, Five User
    License & Enterprise User License

  • xls

    Data Pack Excel License

  • ppt

    It comes with the additional cost
    of $2500.00 contact sales.


Blood Stream Infection Testing Market Research, 2030

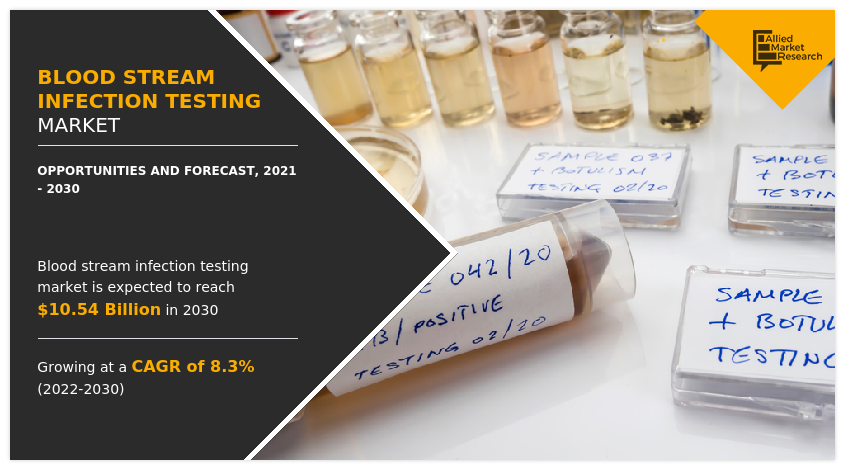
The global blood stream infection testing market was valued at $5.17 billion in 2021, and is projected to reach $10.54 billion by 2030, growing at a CAGR of 8.3% from 2022 to 2030. Any bacterial, fungal, or some other sort of infection found in the blood is known as a blood stream infection. Once the pathogen enters the bloodstream of any part of the body, the disease becomes apparent as it starts spreading the infection in the body. Blood stream infection testing is used to identify the bacteria or other organisms that cause blood infections. There is a significant danger to human health in densely populated areas due to very minimal hygiene is followed, which promotes the spread of several infectious diseases. Bloodstream infections are challenging to self-diagnose due to their widespread symptoms, such as chills, a cold, fever, diarrhea, and vomiting.
In 2020, the COVID-19 outbreak caused global public health emergency and brought the world to a halt, affecting every other sector. COVID-19 impacted negatively on the global blood stream infection testing market share

Blood Stream Infection Testing Market

Increase in the number of bloodstream infections globally is expected to drive the blood stream infection testing market. According to the U.S. National Library of Medicine, world’s largest medical library, Bloodstream Infections (BSIs) are a leading global cause of disease and mortality. The incidence of BSIs has grown over time and the rates ranges from 122 to 220 cases per 100,000 people. The need for rapid diagnosis and recent advancement in bloodstream infection testing are expected to boost the market growth. The increasing incidences of bloodstream infection in elderly population who are susceptible to infection due to low immunity is anticipated to drive demand for bloodstream infection testing and boost revenue growth of the market.

The high cost of ownership and high maintenance costs might limit the market development as technology advances and automated devices such as MALDI-TOF and DOT are introduced. The costly testing methods can further hinder the market growth. The lack of insurance and reimbursement policies is also projected to limit the market expansion.

In the analysis timeframe, it is anticipated that the market will experience tremendous growth and investment opportunities due to the ongoing research and development to introduce technological advancements in the field of bloodstream infection testing. The latest technological developments like bloodstream infection tester, also tracks antibiotic resistance markers in bacteria and also diagnose sepsis. Thus, giving more safety to the patients. In addition, the ageing population, which is more prone to infectious diseases, is anticipated to accelerate the global bloodstream infection testing market growth. Moreover, diagnosis of the disease is quite confusing. This reason makes testing mandatory for the detection of the infection in the bloodstream. Thus, in future there are huge investment opportunities owing to the developments in global blood stream infection testing market.

The major key players in the global bloodstream testing industry are Thermo Fisher Scientific, F. Hoffmann-La Roche Ltd., Abbott, BD, BIOMÉRIEUX, Cepheid, Luminex Corporation, Accelerate Diagnostics Inc., AdvanDX, and Bruker.

The global bloodstream infection testing market analysis is segmented by product, technique, technology, application, end-user, and region. By product, the market is sub-segmented into instruments, consumables, and software & services. By technique, the market is sub-segmented into conventional and automated. By technology, the market is sub-segmented into (culture-based, molecular, and proteomic. By application, the market is sub-segmented into bacterial, fungal, and mycobacterial. By end-user, the market is sub-segmented into hospitals, independent diagnostics centers, and others. By region, the market is sub-segmented into North America, Europe, Asia-Pacific, and LAMEA.

The blood stream infection testing market is segmented into Technology, Product, Technique, Application and End-users.
Blood Stream Infection Testing Market

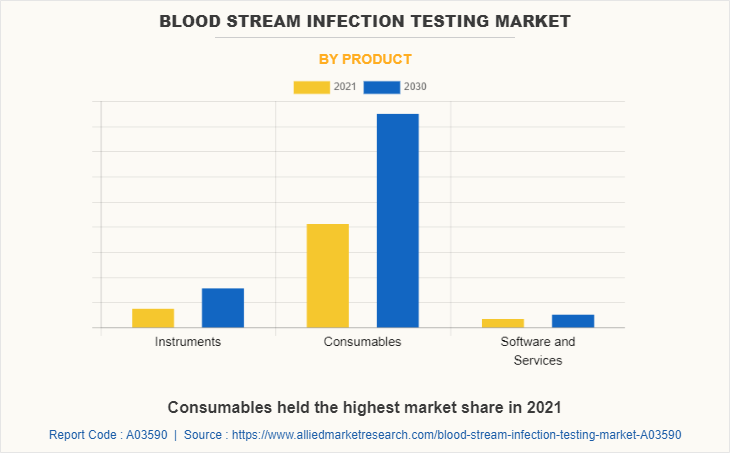
By product, the consumables sub-segment is predicted hold the maximum market share in 2021. Consumables include needle, syringes, bandage, test tubes, reagents, and others are consumed while performing lab test. Rising awareness regarding importance of blood infection testing in disease diagnosis among people and an increasing number of laboratories in various countries such as Brazil, India, and China are the main factors driving demand for consumables in the global blood stream infection testing market trend in the projected period.
Blood Stream Infection Testing Market

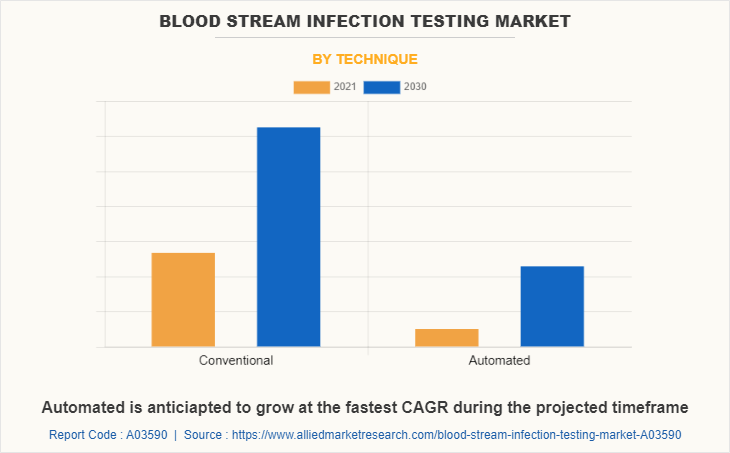
By technique, the conventional sub-segment is predicted to hold the maximum market share in 2021 and the automated sub-segment is expected to grow over the forecast period. Automated instruments are more efficient and provide reliable results in a short time. Moreover, with the help of this technique results are more reproducible and operational errors are reduced thereby fueling blood stream infection testing market demand for the automated techniques in the coming years.
Blood Stream Infection Testing Market

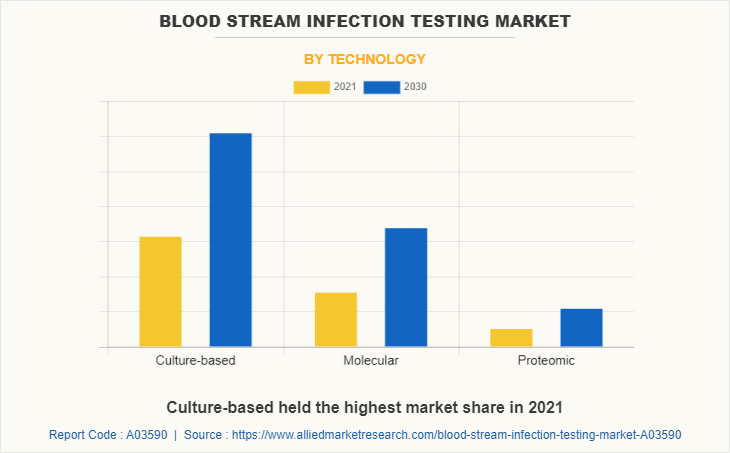
By technology, the culture-based sub-segment is predicted to have a high market share in 2021 throughout the analysis period and the molecular sub-segment is predicted to grow in the estimated timeframe. The molecular technology has potential of providing a faster, reliable, more sensitive, and direct identification of causative pathogens without prior need for cultivation thereby driving global blood stream infection testing market outlook.
Blood Stream Infection Testing Market

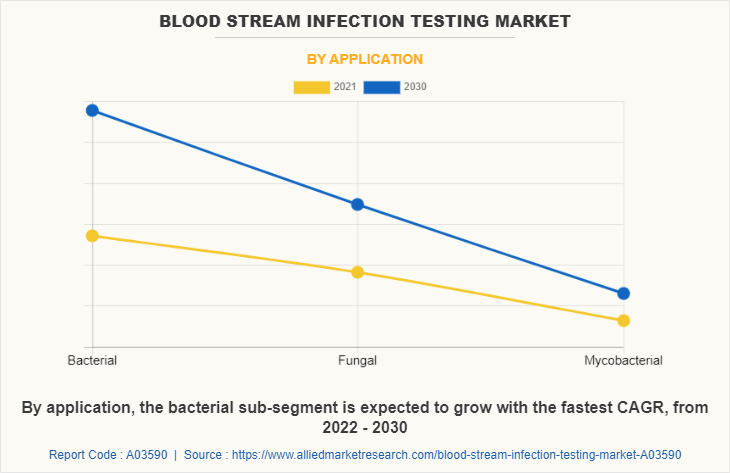
By application, the bacterial sub-segment is predicted to have the maximum share as well as highest growth rate in the estimated period. Bacteria can enter the bloodstream as a severe side effect of infections (such as pneumonia or meningitis), during surgery (especially when involving mucous membranes like the gastrointestinal tract), or as a result of catheters. Bacterial infections in blood can have a number of serious health effects. Sepsis and septic shock, which have high mortality rates, can be brought on by the immune system's reaction to the bacteria. Thus, treating them becomes extremely essential. Furthermore, increasing cases of sepsis among the population across the globe is predicted to be the major driving factor for the bloodstream infection testing market opportunity in the estimated period.
Blood Stream Infection Testing Market

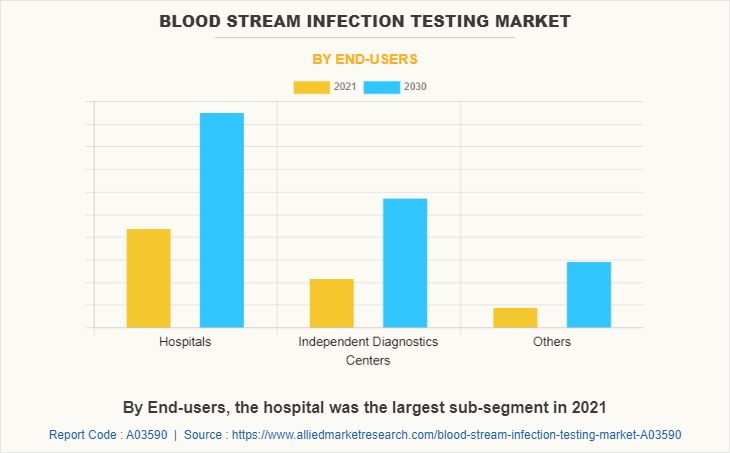
By end-user, the hospitals sub-segment held maximum market share during the forecast period. Hospitals become the primary contact in case of diagnosis of disease. The patient with symptoms of bloodstream infection first gets in touch with the hospitals. Further the doctors in the hospitals provide the next treatment and when in a doubt of bloodstream infection, they instruct to get them tested. Moreover, the improving healthcare facilities in developing countries along with increasing number of independent laboratories is the main factor driving bloodstream infection testing market demand in the forecast period.
Blood Stream Infection Testing Market

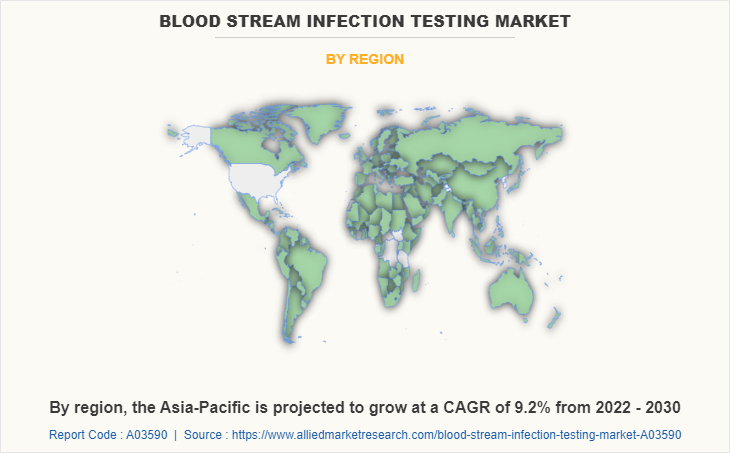
By region, North America held leading share in 2021 in the global blood stream infection testing market. Increase in the geriatric population and existence of large number of healthcare facilities across the region is predicted to be the major factor for revenue growth of the blood stream infection testing market. In addition, major companies are investing more in research and development of blood stream infection testing devices, which is predicted to create opportunities in the blood stream infection testing market share during the forecast period.

Highlights of the Report

  • The report provides exclusive and comprehensive analysis of the global bloodstream infection testing market trends along with the global bloodstream infection testing market forecast.
  • The report elucidates the global bloodstream infection testing market opportunity along with key drivers, and restraints of the market. It is a compilation of detailed information, inputs from industry participants and industry experts across the value chain, and quantitative and qualitative assessment by industry analysts.
  • Porter’s five forces analysis helps analyze the potential of the buyers & suppliers and the competitive scenario of the market for strategy building
  • The report entailing the global blood stream infection testing market analysis maps the qualitative sway of various industry factors on market segments as well as geographies.
  • The data in this report aims on market dynamics, trends, and developments affecting the global bloodstream infection testing market size.

Impact of COVID-19 on the Global Bloodstream Infection Testing Industry

  • In 2020, the COVID-19 outbreak caused global public health emergency and brought the world to a halt, affecting every other sector. COVID-19 impacted negatively on the global bloodstream infection testing market share.
  • However, a blood culture test is considered as the standard for diagnosis of the infection or pathogen thus, the demand for BSI testing has increased rapidly. The rise in cases in the U.S. and Europe increased the demand for blood stream infection testing market size.
  • The incidence rate of blood stream infection in COVID patients was found to be 0.863% compared to patients without COVID having 0.437%. The requirement for diagnosis of pathogens or microbes witnessed a great rise. As the coronavirus has been undergoing mutation, it is likely that the blood stream infection testing will rise in near future.

Blood Stream Infection Testing Market Report Highlights

Aspects Details
Market Size By 2030 USD 10.5 billion
Growth Rate CAGR of 8.3%
Forecast period 2021 - 2030
Report Pages 180
By Technique
  • Conventional
  • Automated
By Technology
  • Culture-based
  • Molecular
  • Proteomic
By Product
  • Instruments
  • Consumables
  • Software and Services
By Application
  • Bacterial
  • Fungal
  • Mycobacterial
By End-users
  • Hospitals
  • Independent Diagnostics Centers
  • Others
By Region
  • North America  (U.S., Canada, Mexico)
  • Europe  (Germany, United Kingdom, France, Spain, Italy, Rest of Europe)
  • Asia-Pacific  (China, Japan, India, South Korea, Australia, Rest of Asia-Pacific)
  • LAMEA  (Brazil, Saudi Arabia, United Arab Emirates, South Africa, Rest of LAMEA)
Key Market Players Abbott Laboratories, F. Hoffmann-La Roche Ltd., Luminex Corporation, cepheid, Accelerate Diagnostics Inc., bioMérieux SA, Thermo Fisher Scientific, Inc., Bruker Corporation, AdvanDx, becton dickinson medical devices co. ltd., suzhou

Analyst Review

Increasing awareness regarding chronic diseases such as AIDS and cancer and rising global population are factors expected to boost the market growth. Average life expectancy of humans has increased as a result of improvements in healthcare technology and introduction of life-saving medications in both developed and developing countries. As a result, the elderly population is increasing rapidly. Due to their weakened immune systems, they are more vulnerable to various illnesses. In the coming days, it is anticipated that the rising older population would increase demand for bloodstream infection tests. The key factors such as high diagnosis cost and lack of medical reimbursement will most likely hamper the market growth during the forecast period. As far as opportunities in the market are concerned, the extensive R&D activities have created ample of investment opportunities for the major players.

Among the analyzed regions, the North America region holds the most lucrative position in the global bloodstream infection testing market in 2031. Increase in number of geriatric population and presence of advanced healthcare facilities owes to the large market share of the region.

 
  • CHAPTER 1: INTRODUCTION

    • 1.1. Report description

    • 1.2. Key market segments

    • 1.3. Key benefits to the stakeholders

    • 1.4. Research Methodology

      • 1.4.1. Primary research

      • 1.4.2. Secondary research

      • 1.4.3. Analyst tools and models

  • CHAPTER 2: EXECUTIVE SUMMARY

    • 2.1. CXO Perspective

  • CHAPTER 3: MARKET OVERVIEW

    • 3.1. Market definition and scope

    • 3.2. Key findings

      • 3.2.1. Top impacting factors

      • 3.2.2. Top investment pockets

    • 3.3. Porter’s five forces analysis

    • 3.4. Market dynamics

      • 3.4.1. Drivers

      • 3.4.2. Restraints

      • 3.4.3. Opportunities

    • 3.5. COVID-19 Impact Analysis on the market

    • 3.6. Key Regulation Analysis

    • 3.7. Market Share Analysis

    • 3.8. Patent Landscape

    • 3.9. Regulatory Guidelines

    • 3.10. Value Chain Analysis

  • CHAPTER 4: BLOOD STREAM INFECTION TESTING MARKET, BY PRODUCT

    • 4.1. Overview

      • 4.1.1. Market size and forecast

    • 4.2. Instruments

      • 4.2.1. Key market trends, growth factors and opportunities

      • 4.2.2. Market size and forecast, by region

      • 4.2.3. Market share analysis by country

    • 4.3. Consumables

      • 4.3.1. Key market trends, growth factors and opportunities

      • 4.3.2. Market size and forecast, by region

      • 4.3.3. Market share analysis by country

    • 4.4. Software and Services

      • 4.4.1. Key market trends, growth factors and opportunities

      • 4.4.2. Market size and forecast, by region

      • 4.4.3. Market share analysis by country

  • CHAPTER 5: BLOOD STREAM INFECTION TESTING MARKET, BY TECHNIQUE

    • 5.1. Overview

      • 5.1.1. Market size and forecast

    • 5.2. Conventional

      • 5.2.1. Key market trends, growth factors and opportunities

      • 5.2.2. Market size and forecast, by region

      • 5.2.3. Market share analysis by country

    • 5.3. Automated

      • 5.3.1. Key market trends, growth factors and opportunities

      • 5.3.2. Market size and forecast, by region

      • 5.3.3. Market share analysis by country

  • CHAPTER 6: BLOOD STREAM INFECTION TESTING MARKET, BY TECHNOLOGY

    • 6.1. Overview

      • 6.1.1. Market size and forecast

    • 6.2. Culture-based

      • 6.2.1. Key market trends, growth factors and opportunities

      • 6.2.2. Market size and forecast, by region

      • 6.2.3. Market share analysis by country

    • 6.3. Molecular

      • 6.3.1. Key market trends, growth factors and opportunities

      • 6.3.2. Market size and forecast, by region

      • 6.3.3. Market share analysis by country

    • 6.4. Proteomic

      • 6.4.1. Key market trends, growth factors and opportunities

      • 6.4.2. Market size and forecast, by region

      • 6.4.3. Market share analysis by country

  • CHAPTER 7: BLOOD STREAM INFECTION TESTING MARKET, BY APPLICATION

    • 7.1. Overview

      • 7.1.1. Market size and forecast

    • 7.2. Bacterial

      • 7.2.1. Key market trends, growth factors and opportunities

      • 7.2.2. Market size and forecast, by region

      • 7.2.3. Market share analysis by country

    • 7.3. Fungal

      • 7.3.1. Key market trends, growth factors and opportunities

      • 7.3.2. Market size and forecast, by region

      • 7.3.3. Market share analysis by country

    • 7.4. Mycobacterial

      • 7.4.1. Key market trends, growth factors and opportunities

      • 7.4.2. Market size and forecast, by region

      • 7.4.3. Market share analysis by country

  • CHAPTER 8: BLOOD STREAM INFECTION TESTING MARKET, BY END-USERS

    • 8.1. Overview

      • 8.1.1. Market size and forecast

    • 8.2. Hospitals

      • 8.2.1. Key market trends, growth factors and opportunities

      • 8.2.2. Market size and forecast, by region

      • 8.2.3. Market share analysis by country

    • 8.3. Independent Diagnostics Centers

      • 8.3.1. Key market trends, growth factors and opportunities

      • 8.3.2. Market size and forecast, by region

      • 8.3.3. Market share analysis by country

    • 8.4. Others

      • 8.4.1. Key market trends, growth factors and opportunities

      • 8.4.2. Market size and forecast, by region

      • 8.4.3. Market share analysis by country

  • CHAPTER 9: BLOOD STREAM INFECTION TESTING MARKET, BY REGION

    • 9.1. Overview

      • 9.1.1. Market size and forecast By Region

    • 9.2. North America

      • 9.2.1. Key trends and opportunities

      • 9.2.2. Market size and forecast, by Product

      • 9.2.3. Market size and forecast, by Technique

      • 9.2.4. Market size and forecast, by Technology

      • 9.2.5. Market size and forecast, by Application

      • 9.2.6. Market size and forecast, by End-users

      • 9.2.7. Market size and forecast, by country

        • 9.2.7.1. U.S.
          • 9.2.7.1.1. Key market trends, growth factors and opportunities
          • 9.2.7.1.2. Market size and forecast, by Product
          • 9.2.7.1.3. Market size and forecast, by Technique
          • 9.2.7.1.4. Market size and forecast, by Technology
          • 9.2.7.1.5. Market size and forecast, by Application
          • 9.2.7.1.6. Market size and forecast, by End-users
        • 9.2.7.2. Canada
          • 9.2.7.2.1. Key market trends, growth factors and opportunities
          • 9.2.7.2.2. Market size and forecast, by Product
          • 9.2.7.2.3. Market size and forecast, by Technique
          • 9.2.7.2.4. Market size and forecast, by Technology
          • 9.2.7.2.5. Market size and forecast, by Application
          • 9.2.7.2.6. Market size and forecast, by End-users
        • 9.2.7.3. Mexico
          • 9.2.7.3.1. Key market trends, growth factors and opportunities
          • 9.2.7.3.2. Market size and forecast, by Product
          • 9.2.7.3.3. Market size and forecast, by Technique
          • 9.2.7.3.4. Market size and forecast, by Technology
          • 9.2.7.3.5. Market size and forecast, by Application
          • 9.2.7.3.6. Market size and forecast, by End-users
    • 9.3. Europe

      • 9.3.1. Key trends and opportunities

      • 9.3.2. Market size and forecast, by Product

      • 9.3.3. Market size and forecast, by Technique

      • 9.3.4. Market size and forecast, by Technology

      • 9.3.5. Market size and forecast, by Application

      • 9.3.6. Market size and forecast, by End-users

      • 9.3.7. Market size and forecast, by country

        • 9.3.7.1. Germany
          • 9.3.7.1.1. Key market trends, growth factors and opportunities
          • 9.3.7.1.2. Market size and forecast, by Product
          • 9.3.7.1.3. Market size and forecast, by Technique
          • 9.3.7.1.4. Market size and forecast, by Technology
          • 9.3.7.1.5. Market size and forecast, by Application
          • 9.3.7.1.6. Market size and forecast, by End-users
        • 9.3.7.2. United Kingdom
          • 9.3.7.2.1. Key market trends, growth factors and opportunities
          • 9.3.7.2.2. Market size and forecast, by Product
          • 9.3.7.2.3. Market size and forecast, by Technique
          • 9.3.7.2.4. Market size and forecast, by Technology
          • 9.3.7.2.5. Market size and forecast, by Application
          • 9.3.7.2.6. Market size and forecast, by End-users
        • 9.3.7.3. France
          • 9.3.7.3.1. Key market trends, growth factors and opportunities
          • 9.3.7.3.2. Market size and forecast, by Product
          • 9.3.7.3.3. Market size and forecast, by Technique
          • 9.3.7.3.4. Market size and forecast, by Technology
          • 9.3.7.3.5. Market size and forecast, by Application
          • 9.3.7.3.6. Market size and forecast, by End-users
        • 9.3.7.4. Spain
          • 9.3.7.4.1. Key market trends, growth factors and opportunities
          • 9.3.7.4.2. Market size and forecast, by Product
          • 9.3.7.4.3. Market size and forecast, by Technique
          • 9.3.7.4.4. Market size and forecast, by Technology
          • 9.3.7.4.5. Market size and forecast, by Application
          • 9.3.7.4.6. Market size and forecast, by End-users
        • 9.3.7.5. Italy
          • 9.3.7.5.1. Key market trends, growth factors and opportunities
          • 9.3.7.5.2. Market size and forecast, by Product
          • 9.3.7.5.3. Market size and forecast, by Technique
          • 9.3.7.5.4. Market size and forecast, by Technology
          • 9.3.7.5.5. Market size and forecast, by Application
          • 9.3.7.5.6. Market size and forecast, by End-users
        • 9.3.7.6. Rest of Europe
          • 9.3.7.6.1. Key market trends, growth factors and opportunities
          • 9.3.7.6.2. Market size and forecast, by Product
          • 9.3.7.6.3. Market size and forecast, by Technique
          • 9.3.7.6.4. Market size and forecast, by Technology
          • 9.3.7.6.5. Market size and forecast, by Application
          • 9.3.7.6.6. Market size and forecast, by End-users
    • 9.4. Asia-Pacific

      • 9.4.1. Key trends and opportunities

      • 9.4.2. Market size and forecast, by Product

      • 9.4.3. Market size and forecast, by Technique

      • 9.4.4. Market size and forecast, by Technology

      • 9.4.5. Market size and forecast, by Application

      • 9.4.6. Market size and forecast, by End-users

      • 9.4.7. Market size and forecast, by country

        • 9.4.7.1. China
          • 9.4.7.1.1. Key market trends, growth factors and opportunities
          • 9.4.7.1.2. Market size and forecast, by Product
          • 9.4.7.1.3. Market size and forecast, by Technique
          • 9.4.7.1.4. Market size and forecast, by Technology
          • 9.4.7.1.5. Market size and forecast, by Application
          • 9.4.7.1.6. Market size and forecast, by End-users
        • 9.4.7.2. Japan
          • 9.4.7.2.1. Key market trends, growth factors and opportunities
          • 9.4.7.2.2. Market size and forecast, by Product
          • 9.4.7.2.3. Market size and forecast, by Technique
          • 9.4.7.2.4. Market size and forecast, by Technology
          • 9.4.7.2.5. Market size and forecast, by Application
          • 9.4.7.2.6. Market size and forecast, by End-users
        • 9.4.7.3. India
          • 9.4.7.3.1. Key market trends, growth factors and opportunities
          • 9.4.7.3.2. Market size and forecast, by Product
          • 9.4.7.3.3. Market size and forecast, by Technique
          • 9.4.7.3.4. Market size and forecast, by Technology
          • 9.4.7.3.5. Market size and forecast, by Application
          • 9.4.7.3.6. Market size and forecast, by End-users
        • 9.4.7.4. South Korea
          • 9.4.7.4.1. Key market trends, growth factors and opportunities
          • 9.4.7.4.2. Market size and forecast, by Product
          • 9.4.7.4.3. Market size and forecast, by Technique
          • 9.4.7.4.4. Market size and forecast, by Technology
          • 9.4.7.4.5. Market size and forecast, by Application
          • 9.4.7.4.6. Market size and forecast, by End-users
        • 9.4.7.5. Australia
          • 9.4.7.5.1. Key market trends, growth factors and opportunities
          • 9.4.7.5.2. Market size and forecast, by Product
          • 9.4.7.5.3. Market size and forecast, by Technique
          • 9.4.7.5.4. Market size and forecast, by Technology
          • 9.4.7.5.5. Market size and forecast, by Application
          • 9.4.7.5.6. Market size and forecast, by End-users
        • 9.4.7.6. Rest of Asia-Pacific
          • 9.4.7.6.1. Key market trends, growth factors and opportunities
          • 9.4.7.6.2. Market size and forecast, by Product
          • 9.4.7.6.3. Market size and forecast, by Technique
          • 9.4.7.6.4. Market size and forecast, by Technology
          • 9.4.7.6.5. Market size and forecast, by Application
          • 9.4.7.6.6. Market size and forecast, by End-users
    • 9.5. LAMEA

      • 9.5.1. Key trends and opportunities

      • 9.5.2. Market size and forecast, by Product

      • 9.5.3. Market size and forecast, by Technique

      • 9.5.4. Market size and forecast, by Technology

      • 9.5.5. Market size and forecast, by Application

      • 9.5.6. Market size and forecast, by End-users

      • 9.5.7. Market size and forecast, by country

        • 9.5.7.1. Brazil
          • 9.5.7.1.1. Key market trends, growth factors and opportunities
          • 9.5.7.1.2. Market size and forecast, by Product
          • 9.5.7.1.3. Market size and forecast, by Technique
          • 9.5.7.1.4. Market size and forecast, by Technology
          • 9.5.7.1.5. Market size and forecast, by Application
          • 9.5.7.1.6. Market size and forecast, by End-users
        • 9.5.7.2. Saudi Arabia
          • 9.5.7.2.1. Key market trends, growth factors and opportunities
          • 9.5.7.2.2. Market size and forecast, by Product
          • 9.5.7.2.3. Market size and forecast, by Technique
          • 9.5.7.2.4. Market size and forecast, by Technology
          • 9.5.7.2.5. Market size and forecast, by Application
          • 9.5.7.2.6. Market size and forecast, by End-users
        • 9.5.7.3. United Arab Emirates
          • 9.5.7.3.1. Key market trends, growth factors and opportunities
          • 9.5.7.3.2. Market size and forecast, by Product
          • 9.5.7.3.3. Market size and forecast, by Technique
          • 9.5.7.3.4. Market size and forecast, by Technology
          • 9.5.7.3.5. Market size and forecast, by Application
          • 9.5.7.3.6. Market size and forecast, by End-users
        • 9.5.7.4. South Africa
          • 9.5.7.4.1. Key market trends, growth factors and opportunities
          • 9.5.7.4.2. Market size and forecast, by Product
          • 9.5.7.4.3. Market size and forecast, by Technique
          • 9.5.7.4.4. Market size and forecast, by Technology
          • 9.5.7.4.5. Market size and forecast, by Application
          • 9.5.7.4.6. Market size and forecast, by End-users
        • 9.5.7.5. Rest of LAMEA
          • 9.5.7.5.1. Key market trends, growth factors and opportunities
          • 9.5.7.5.2. Market size and forecast, by Product
          • 9.5.7.5.3. Market size and forecast, by Technique
          • 9.5.7.5.4. Market size and forecast, by Technology
          • 9.5.7.5.5. Market size and forecast, by Application
          • 9.5.7.5.6. Market size and forecast, by End-users
  • CHAPTER 10: COMPETITIVE LANDSCAPE

    • 10.1. Introduction

    • 10.2. Top winning strategies

    • 10.3. Product Mapping of Top 10 Player

    • 10.4. Competitive Dashboard

    • 10.5. Competitive Heatmap

    • 10.6. Top player positioning, 2021

  • CHAPTER 11: COMPANY PROFILES

    • 11.1. Thermo Fisher Scientific, Inc.

      • 11.1.1. Company overview

      • 11.1.2. Key Executives

      • 11.1.3. Company snapshot

    • 11.2. F. Hoffmann-La Roche Ltd.

      • 11.2.1. Company overview

      • 11.2.2. Key Executives

      • 11.2.3. Company snapshot

    • 11.3. Abbott Laboratories

      • 11.3.1. Company overview

      • 11.3.2. Key Executives

      • 11.3.3. Company snapshot

    • 11.4. becton dickinson medical devices co. ltd., suzhou

      • 11.4.1. Company overview

      • 11.4.2. Key Executives

      • 11.4.3. Company snapshot

    • 11.5. bioMérieux SA

      • 11.5.1. Company overview

      • 11.5.2. Key Executives

      • 11.5.3. Company snapshot

    • 11.6. cepheid

      • 11.6.1. Company overview

      • 11.6.2. Key Executives

      • 11.6.3. Company snapshot

    • 11.7. Luminex Corporation

      • 11.7.1. Company overview

      • 11.7.2. Key Executives

      • 11.7.3. Company snapshot

    • 11.8. Accelerate Diagnostics Inc.

      • 11.8.1. Company overview

      • 11.8.2. Key Executives

      • 11.8.3. Company snapshot

    • 11.9. AdvanDx

      • 11.9.1. Company overview

      • 11.9.2. Key Executives

      • 11.9.3. Company snapshot

    • 11.10. Bruker Corporation

      • 11.10.1. Company overview

      • 11.10.2. Key Executives

      • 11.10.3. Company snapshot

  • LIST OF TABLES

  • TABLE 01. GLOBAL BLOOD STREAM INFECTION TESTING MARKET, BY PRODUCT, 2021-2030 ($MILLION)
    TABLE 02. BLOOD STREAM INFECTION TESTING MARKET FOR INSTRUMENTS, BY REGION, 2021-2030 ($MILLION)
    TABLE 03. BLOOD STREAM INFECTION TESTING MARKET FOR CONSUMABLES, BY REGION, 2021-2030 ($MILLION)
    TABLE 04. BLOOD STREAM INFECTION TESTING MARKET FOR SOFTWARE AND SERVICES, BY REGION, 2021-2030 ($MILLION)
    TABLE 05. GLOBAL BLOOD STREAM INFECTION TESTING MARKET, BY TECHNIQUE, 2021-2030 ($MILLION)
    TABLE 06. BLOOD STREAM INFECTION TESTING MARKET FOR CONVENTIONAL, BY REGION, 2021-2030 ($MILLION)
    TABLE 07. BLOOD STREAM INFECTION TESTING MARKET FOR AUTOMATED, BY REGION, 2021-2030 ($MILLION)
    TABLE 08. GLOBAL BLOOD STREAM INFECTION TESTING MARKET, BY TECHNOLOGY, 2021-2030 ($MILLION)
    TABLE 09. BLOOD STREAM INFECTION TESTING MARKET FOR CULTURE-BASED, BY REGION, 2021-2030 ($MILLION)
    TABLE 10. BLOOD STREAM INFECTION TESTING MARKET FOR MOLECULAR, BY REGION, 2021-2030 ($MILLION)
    TABLE 11. BLOOD STREAM INFECTION TESTING MARKET FOR PROTEOMIC, BY REGION, 2021-2030 ($MILLION)
    TABLE 12. GLOBAL BLOOD STREAM INFECTION TESTING MARKET, BY APPLICATION, 2021-2030 ($MILLION)
    TABLE 13. BLOOD STREAM INFECTION TESTING MARKET FOR BACTERIAL, BY REGION, 2021-2030 ($MILLION)
    TABLE 14. BLOOD STREAM INFECTION TESTING MARKET FOR FUNGAL, BY REGION, 2021-2030 ($MILLION)
    TABLE 15. BLOOD STREAM INFECTION TESTING MARKET FOR MYCOBACTERIAL, BY REGION, 2021-2030 ($MILLION)
    TABLE 16. GLOBAL BLOOD STREAM INFECTION TESTING MARKET, BY END-USERS, 2021-2030 ($MILLION)
    TABLE 17. BLOOD STREAM INFECTION TESTING MARKET FOR HOSPITALS, BY REGION, 2021-2030 ($MILLION)
    TABLE 18. BLOOD STREAM INFECTION TESTING MARKET FOR INDEPENDENT DIAGNOSTICS CENTERS, BY REGION, 2021-2030 ($MILLION)
    TABLE 19. BLOOD STREAM INFECTION TESTING MARKET FOR OTHERS, BY REGION, 2021-2030 ($MILLION)
    TABLE 20. BLOOD STREAM INFECTION TESTING MARKET, BY REGION, 2021-2030 ($MILLION)
    TABLE 21. NORTH AMERICA BLOOD STREAM INFECTION TESTING MARKET, BY PRODUCT, 2021-2030 ($MILLION)
    TABLE 22. NORTH AMERICA BLOOD STREAM INFECTION TESTING MARKET, BY TECHNIQUE, 2021-2030 ($MILLION)
    TABLE 23. NORTH AMERICA BLOOD STREAM INFECTION TESTING MARKET, BY TECHNOLOGY, 2021-2030 ($MILLION)
    TABLE 24. NORTH AMERICA BLOOD STREAM INFECTION TESTING MARKET, BY APPLICATION, 2021-2030 ($MILLION)
    TABLE 25. NORTH AMERICA BLOOD STREAM INFECTION TESTING MARKET, BY END-USERS, 2021-2030 ($MILLION)
    TABLE 26. NORTH AMERICA BLOOD STREAM INFECTION TESTING MARKET, BY COUNTRY, 2021-2030 ($MILLION)
    TABLE 27. U.S. BLOOD STREAM INFECTION TESTING MARKET, BY PRODUCT, 2021-2030 ($MILLION)
    TABLE 28. U.S. BLOOD STREAM INFECTION TESTING MARKET, BY TECHNIQUE, 2021-2030 ($MILLION)
    TABLE 29. U.S. BLOOD STREAM INFECTION TESTING MARKET, BY TECHNOLOGY, 2021-2030 ($MILLION)
    TABLE 30. U.S. BLOOD STREAM INFECTION TESTING MARKET, BY APPLICATION, 2021-2030 ($MILLION)
    TABLE 31. U.S. BLOOD STREAM INFECTION TESTING MARKET, BY END-USERS, 2021-2030 ($MILLION)
    TABLE 32. CANADA BLOOD STREAM INFECTION TESTING MARKET, BY PRODUCT, 2021-2030 ($MILLION)
    TABLE 33. CANADA BLOOD STREAM INFECTION TESTING MARKET, BY TECHNIQUE, 2021-2030 ($MILLION)
    TABLE 34. CANADA BLOOD STREAM INFECTION TESTING MARKET, BY TECHNOLOGY, 2021-2030 ($MILLION)
    TABLE 35. CANADA BLOOD STREAM INFECTION TESTING MARKET, BY APPLICATION, 2021-2030 ($MILLION)
    TABLE 36. CANADA BLOOD STREAM INFECTION TESTING MARKET, BY END-USERS, 2021-2030 ($MILLION)
    TABLE 37. MEXICO BLOOD STREAM INFECTION TESTING MARKET, BY PRODUCT, 2021-2030 ($MILLION)
    TABLE 38. MEXICO BLOOD STREAM INFECTION TESTING MARKET, BY TECHNIQUE, 2021-2030 ($MILLION)
    TABLE 39. MEXICO BLOOD STREAM INFECTION TESTING MARKET, BY TECHNOLOGY, 2021-2030 ($MILLION)
    TABLE 40. MEXICO BLOOD STREAM INFECTION TESTING MARKET, BY APPLICATION, 2021-2030 ($MILLION)
    TABLE 41. MEXICO BLOOD STREAM INFECTION TESTING MARKET, BY END-USERS, 2021-2030 ($MILLION)
    TABLE 42. EUROPE BLOOD STREAM INFECTION TESTING MARKET, BY PRODUCT, 2021-2030 ($MILLION)
    TABLE 43. EUROPE BLOOD STREAM INFECTION TESTING MARKET, BY TECHNIQUE, 2021-2030 ($MILLION)
    TABLE 44. EUROPE BLOOD STREAM INFECTION TESTING MARKET, BY TECHNOLOGY, 2021-2030 ($MILLION)
    TABLE 45. EUROPE BLOOD STREAM INFECTION TESTING MARKET, BY APPLICATION, 2021-2030 ($MILLION)
    TABLE 46. EUROPE BLOOD STREAM INFECTION TESTING MARKET, BY END-USERS, 2021-2030 ($MILLION)
    TABLE 47. EUROPE BLOOD STREAM INFECTION TESTING MARKET, BY COUNTRY, 2021-2030 ($MILLION)
    TABLE 48. GERMANY BLOOD STREAM INFECTION TESTING MARKET, BY PRODUCT, 2021-2030 ($MILLION)
    TABLE 49. GERMANY BLOOD STREAM INFECTION TESTING MARKET, BY TECHNIQUE, 2021-2030 ($MILLION)
    TABLE 50. GERMANY BLOOD STREAM INFECTION TESTING MARKET, BY TECHNOLOGY, 2021-2030 ($MILLION)
    TABLE 51. GERMANY BLOOD STREAM INFECTION TESTING MARKET, BY APPLICATION, 2021-2030 ($MILLION)
    TABLE 52. GERMANY BLOOD STREAM INFECTION TESTING MARKET, BY END-USERS, 2021-2030 ($MILLION)
    TABLE 53. UNITED KINGDOM BLOOD STREAM INFECTION TESTING MARKET, BY PRODUCT, 2021-2030 ($MILLION)
    TABLE 54. UNITED KINGDOM BLOOD STREAM INFECTION TESTING MARKET, BY TECHNIQUE, 2021-2030 ($MILLION)
    TABLE 55. UNITED KINGDOM BLOOD STREAM INFECTION TESTING MARKET, BY TECHNOLOGY, 2021-2030 ($MILLION)
    TABLE 56. UNITED KINGDOM BLOOD STREAM INFECTION TESTING MARKET, BY APPLICATION, 2021-2030 ($MILLION)
    TABLE 57. UNITED KINGDOM BLOOD STREAM INFECTION TESTING MARKET, BY END-USERS, 2021-2030 ($MILLION)
    TABLE 58. FRANCE BLOOD STREAM INFECTION TESTING MARKET, BY PRODUCT, 2021-2030 ($MILLION)
    TABLE 59. FRANCE BLOOD STREAM INFECTION TESTING MARKET, BY TECHNIQUE, 2021-2030 ($MILLION)
    TABLE 60. FRANCE BLOOD STREAM INFECTION TESTING MARKET, BY TECHNOLOGY, 2021-2030 ($MILLION)
    TABLE 61. FRANCE BLOOD STREAM INFECTION TESTING MARKET, BY APPLICATION, 2021-2030 ($MILLION)
    TABLE 62. FRANCE BLOOD STREAM INFECTION TESTING MARKET, BY END-USERS, 2021-2030 ($MILLION)
    TABLE 63. SPAIN BLOOD STREAM INFECTION TESTING MARKET, BY PRODUCT, 2021-2030 ($MILLION)
    TABLE 64. SPAIN BLOOD STREAM INFECTION TESTING MARKET, BY TECHNIQUE, 2021-2030 ($MILLION)
    TABLE 65. SPAIN BLOOD STREAM INFECTION TESTING MARKET, BY TECHNOLOGY, 2021-2030 ($MILLION)
    TABLE 66. SPAIN BLOOD STREAM INFECTION TESTING MARKET, BY APPLICATION, 2021-2030 ($MILLION)
    TABLE 67. SPAIN BLOOD STREAM INFECTION TESTING MARKET, BY END-USERS, 2021-2030 ($MILLION)
    TABLE 68. ITALY BLOOD STREAM INFECTION TESTING MARKET, BY PRODUCT, 2021-2030 ($MILLION)
    TABLE 69. ITALY BLOOD STREAM INFECTION TESTING MARKET, BY TECHNIQUE, 2021-2030 ($MILLION)
    TABLE 70. ITALY BLOOD STREAM INFECTION TESTING MARKET, BY TECHNOLOGY, 2021-2030 ($MILLION)
    TABLE 71. ITALY BLOOD STREAM INFECTION TESTING MARKET, BY APPLICATION, 2021-2030 ($MILLION)
    TABLE 72. ITALY BLOOD STREAM INFECTION TESTING MARKET, BY END-USERS, 2021-2030 ($MILLION)
    TABLE 73. REST OF EUROPE BLOOD STREAM INFECTION TESTING MARKET, BY PRODUCT, 2021-2030 ($MILLION)
    TABLE 74. REST OF EUROPE BLOOD STREAM INFECTION TESTING MARKET, BY TECHNIQUE, 2021-2030 ($MILLION)
    TABLE 75. REST OF EUROPE BLOOD STREAM INFECTION TESTING MARKET, BY TECHNOLOGY, 2021-2030 ($MILLION)
    TABLE 76. REST OF EUROPE BLOOD STREAM INFECTION TESTING MARKET, BY APPLICATION, 2021-2030 ($MILLION)
    TABLE 77. REST OF EUROPE BLOOD STREAM INFECTION TESTING MARKET, BY END-USERS, 2021-2030 ($MILLION)
    TABLE 78. ASIA-PACIFIC BLOOD STREAM INFECTION TESTING MARKET, BY PRODUCT, 2021-2030 ($MILLION)
    TABLE 79. ASIA-PACIFIC BLOOD STREAM INFECTION TESTING MARKET, BY TECHNIQUE, 2021-2030 ($MILLION)
    TABLE 80. ASIA-PACIFIC BLOOD STREAM INFECTION TESTING MARKET, BY TECHNOLOGY, 2021-2030 ($MILLION)
    TABLE 81. ASIA-PACIFIC BLOOD STREAM INFECTION TESTING MARKET, BY APPLICATION, 2021-2030 ($MILLION)
    TABLE 82. ASIA-PACIFIC BLOOD STREAM INFECTION TESTING MARKET, BY END-USERS, 2021-2030 ($MILLION)
    TABLE 83. ASIA-PACIFIC BLOOD STREAM INFECTION TESTING MARKET, BY COUNTRY, 2021-2030 ($MILLION)
    TABLE 84. CHINA BLOOD STREAM INFECTION TESTING MARKET, BY PRODUCT, 2021-2030 ($MILLION)
    TABLE 85. CHINA BLOOD STREAM INFECTION TESTING MARKET, BY TECHNIQUE, 2021-2030 ($MILLION)
    TABLE 86. CHINA BLOOD STREAM INFECTION TESTING MARKET, BY TECHNOLOGY, 2021-2030 ($MILLION)
    TABLE 87. CHINA BLOOD STREAM INFECTION TESTING MARKET, BY APPLICATION, 2021-2030 ($MILLION)
    TABLE 88. CHINA BLOOD STREAM INFECTION TESTING MARKET, BY END-USERS, 2021-2030 ($MILLION)
    TABLE 89. JAPAN BLOOD STREAM INFECTION TESTING MARKET, BY PRODUCT, 2021-2030 ($MILLION)
    TABLE 90. JAPAN BLOOD STREAM INFECTION TESTING MARKET, BY TECHNIQUE, 2021-2030 ($MILLION)
    TABLE 91. JAPAN BLOOD STREAM INFECTION TESTING MARKET, BY TECHNOLOGY, 2021-2030 ($MILLION)
    TABLE 92. JAPAN BLOOD STREAM INFECTION TESTING MARKET, BY APPLICATION, 2021-2030 ($MILLION)
    TABLE 93. JAPAN BLOOD STREAM INFECTION TESTING MARKET, BY END-USERS, 2021-2030 ($MILLION)
    TABLE 94. INDIA BLOOD STREAM INFECTION TESTING MARKET, BY PRODUCT, 2021-2030 ($MILLION)
    TABLE 95. INDIA BLOOD STREAM INFECTION TESTING MARKET, BY TECHNIQUE, 2021-2030 ($MILLION)
    TABLE 96. INDIA BLOOD STREAM INFECTION TESTING MARKET, BY TECHNOLOGY, 2021-2030 ($MILLION)
    TABLE 97. INDIA BLOOD STREAM INFECTION TESTING MARKET, BY APPLICATION, 2021-2030 ($MILLION)
    TABLE 98. INDIA BLOOD STREAM INFECTION TESTING MARKET, BY END-USERS, 2021-2030 ($MILLION)
    TABLE 99. SOUTH KOREA BLOOD STREAM INFECTION TESTING MARKET, BY PRODUCT, 2021-2030 ($MILLION)
    TABLE 100. SOUTH KOREA BLOOD STREAM INFECTION TESTING MARKET, BY TECHNIQUE, 2021-2030 ($MILLION)
    TABLE 101. SOUTH KOREA BLOOD STREAM INFECTION TESTING MARKET, BY TECHNOLOGY, 2021-2030 ($MILLION)
    TABLE 102. SOUTH KOREA BLOOD STREAM INFECTION TESTING MARKET, BY APPLICATION, 2021-2030 ($MILLION)
    TABLE 103. SOUTH KOREA BLOOD STREAM INFECTION TESTING MARKET, BY END-USERS, 2021-2030 ($MILLION)
    TABLE 104. AUSTRALIA BLOOD STREAM INFECTION TESTING MARKET, BY PRODUCT, 2021-2030 ($MILLION)
    TABLE 105. AUSTRALIA BLOOD STREAM INFECTION TESTING MARKET, BY TECHNIQUE, 2021-2030 ($MILLION)
    TABLE 106. AUSTRALIA BLOOD STREAM INFECTION TESTING MARKET, BY TECHNOLOGY, 2021-2030 ($MILLION)
    TABLE 107. AUSTRALIA BLOOD STREAM INFECTION TESTING MARKET, BY APPLICATION, 2021-2030 ($MILLION)
    TABLE 108. AUSTRALIA BLOOD STREAM INFECTION TESTING MARKET, BY END-USERS, 2021-2030 ($MILLION)
    TABLE 109. REST OF ASIA-PACIFIC BLOOD STREAM INFECTION TESTING MARKET, BY PRODUCT, 2021-2030 ($MILLION)
    TABLE 110. REST OF ASIA-PACIFIC BLOOD STREAM INFECTION TESTING MARKET, BY TECHNIQUE, 2021-2030 ($MILLION)
    TABLE 111. REST OF ASIA-PACIFIC BLOOD STREAM INFECTION TESTING MARKET, BY TECHNOLOGY, 2021-2030 ($MILLION)
    TABLE 112. REST OF ASIA-PACIFIC BLOOD STREAM INFECTION TESTING MARKET, BY APPLICATION, 2021-2030 ($MILLION)
    TABLE 113. REST OF ASIA-PACIFIC BLOOD STREAM INFECTION TESTING MARKET, BY END-USERS, 2021-2030 ($MILLION)
    TABLE 114. LAMEA BLOOD STREAM INFECTION TESTING MARKET, BY PRODUCT, 2021-2030 ($MILLION)
    TABLE 115. LAMEA BLOOD STREAM INFECTION TESTING MARKET, BY TECHNIQUE, 2021-2030 ($MILLION)
    TABLE 116. LAMEA BLOOD STREAM INFECTION TESTING MARKET, BY TECHNOLOGY, 2021-2030 ($MILLION)
    TABLE 117. LAMEA BLOOD STREAM INFECTION TESTING MARKET, BY APPLICATION, 2021-2030 ($MILLION)
    TABLE 118. LAMEA BLOOD STREAM INFECTION TESTING MARKET, BY END-USERS, 2021-2030 ($MILLION)
    TABLE 119. LAMEA BLOOD STREAM INFECTION TESTING MARKET, BY COUNTRY, 2021-2030 ($MILLION)
    TABLE 120. BRAZIL BLOOD STREAM INFECTION TESTING MARKET, BY PRODUCT, 2021-2030 ($MILLION)
    TABLE 121. BRAZIL BLOOD STREAM INFECTION TESTING MARKET, BY TECHNIQUE, 2021-2030 ($MILLION)
    TABLE 122. BRAZIL BLOOD STREAM INFECTION TESTING MARKET, BY TECHNOLOGY, 2021-2030 ($MILLION)
    TABLE 123. BRAZIL BLOOD STREAM INFECTION TESTING MARKET, BY APPLICATION, 2021-2030 ($MILLION)
    TABLE 124. BRAZIL BLOOD STREAM INFECTION TESTING MARKET, BY END-USERS, 2021-2030 ($MILLION)
    TABLE 125. SAUDI ARABIA BLOOD STREAM INFECTION TESTING MARKET, BY PRODUCT, 2021-2030 ($MILLION)
    TABLE 126. SAUDI ARABIA BLOOD STREAM INFECTION TESTING MARKET, BY TECHNIQUE, 2021-2030 ($MILLION)
    TABLE 127. SAUDI ARABIA BLOOD STREAM INFECTION TESTING MARKET, BY TECHNOLOGY, 2021-2030 ($MILLION)
    TABLE 128. SAUDI ARABIA BLOOD STREAM INFECTION TESTING MARKET, BY APPLICATION, 2021-2030 ($MILLION)
    TABLE 129. SAUDI ARABIA BLOOD STREAM INFECTION TESTING MARKET, BY END-USERS, 2021-2030 ($MILLION)
    TABLE 130. UNITED ARAB EMIRATES BLOOD STREAM INFECTION TESTING MARKET, BY PRODUCT, 2021-2030 ($MILLION)
    TABLE 131. UNITED ARAB EMIRATES BLOOD STREAM INFECTION TESTING MARKET, BY TECHNIQUE, 2021-2030 ($MILLION)
    TABLE 132. UNITED ARAB EMIRATES BLOOD STREAM INFECTION TESTING MARKET, BY TECHNOLOGY, 2021-2030 ($MILLION)
    TABLE 133. UNITED ARAB EMIRATES BLOOD STREAM INFECTION TESTING MARKET, BY APPLICATION, 2021-2030 ($MILLION)
    TABLE 134. UNITED ARAB EMIRATES BLOOD STREAM INFECTION TESTING MARKET, BY END-USERS, 2021-2030 ($MILLION)
    TABLE 135. SOUTH AFRICA BLOOD STREAM INFECTION TESTING MARKET, BY PRODUCT, 2021-2030 ($MILLION)
    TABLE 136. SOUTH AFRICA BLOOD STREAM INFECTION TESTING MARKET, BY TECHNIQUE, 2021-2030 ($MILLION)
    TABLE 137. SOUTH AFRICA BLOOD STREAM INFECTION TESTING MARKET, BY TECHNOLOGY, 2021-2030 ($MILLION)
    TABLE 138. SOUTH AFRICA BLOOD STREAM INFECTION TESTING MARKET, BY APPLICATION, 2021-2030 ($MILLION)
    TABLE 139. SOUTH AFRICA BLOOD STREAM INFECTION TESTING MARKET, BY END-USERS, 2021-2030 ($MILLION)
    TABLE 140. REST OF LAMEA BLOOD STREAM INFECTION TESTING MARKET, BY PRODUCT, 2021-2030 ($MILLION)
    TABLE 141. REST OF LAMEA BLOOD STREAM INFECTION TESTING MARKET, BY TECHNIQUE, 2021-2030 ($MILLION)
    TABLE 142. REST OF LAMEA BLOOD STREAM INFECTION TESTING MARKET, BY TECHNOLOGY, 2021-2030 ($MILLION)
    TABLE 143. REST OF LAMEA BLOOD STREAM INFECTION TESTING MARKET, BY APPLICATION, 2021-2030 ($MILLION)
    TABLE 144. REST OF LAMEA BLOOD STREAM INFECTION TESTING MARKET, BY END-USERS, 2021-2030 ($MILLION)
    TABLE 145. THERMO FISHER SCIENTIFIC, INC.: KEY EXECUTIVES
    TABLE 146. THERMO FISHER SCIENTIFIC, INC.: COMPANY SNAPSHOT
    TABLE 147. F. HOFFMANN-LA ROCHE LTD.: KEY EXECUTIVES
    TABLE 148. F. HOFFMANN-LA ROCHE LTD.: COMPANY SNAPSHOT
    TABLE 149. ABBOTT LABORATORIES: KEY EXECUTIVES
    TABLE 150. ABBOTT LABORATORIES: COMPANY SNAPSHOT
    TABLE 151. BECTON DICKINSON MEDICAL DEVICES CO. LTD., SUZHOU: KEY EXECUTIVES
    TABLE 152. BECTON DICKINSON MEDICAL DEVICES CO. LTD., SUZHOU: COMPANY SNAPSHOT
    TABLE 153. BIOMÉRIEUX SA: KEY EXECUTIVES
    TABLE 154. BIOMÉRIEUX SA: COMPANY SNAPSHOT
    TABLE 155. CEPHEID: KEY EXECUTIVES
    TABLE 156. CEPHEID: COMPANY SNAPSHOT
    TABLE 157. LUMINEX CORPORATION: KEY EXECUTIVES
    TABLE 158. LUMINEX CORPORATION: COMPANY SNAPSHOT
    TABLE 159. ACCELERATE DIAGNOSTICS INC.: KEY EXECUTIVES
    TABLE 160. ACCELERATE DIAGNOSTICS INC.: COMPANY SNAPSHOT
    TABLE 161. ADVANDX: KEY EXECUTIVES
    TABLE 162. ADVANDX: COMPANY SNAPSHOT
    TABLE 163. BRUKER CORPORATION: KEY EXECUTIVES
    TABLE 164. BRUKER CORPORATION: COMPANY SNAPSHOT
  • LIST OF FIGURES

  • FIGURE 1.BLOOD STREAM INFECTION TESTING MARKET SEGMENTATION
    FIGURE 2.BLOOD STREAM INFECTION TESTING MARKET,2021-2030
    FIGURE 3.BLOOD STREAM INFECTION TESTING MARKET,2021-2030
    FIGURE 4. TOP INVESTMENT POCKETS, BY REGION
    FIGURE 5.PORTER FIVE-1
    FIGURE 6.PORTER FIVE-2
    FIGURE 7.PORTER FIVE-3
    FIGURE 8.PORTER FIVE-4
    FIGURE 9.PORTER FIVE-5
    FIGURE 10.TOP PLAYER POSITIONING
    FIGURE 11.BLOOD STREAM INFECTION TESTING MARKET:DRIVERS, RESTRAINTS AND OPPORTUNITIES
    FIGURE 12.VALUE CHAIN ANALYSIS
    FIGURE 13.MARKET SHARE ANALYSIS
    FIGURE 14.REGULATORY GUIDELINES
    FIGURE 15.KEY REGULATION ANALYSIS
    FIGURE 16.PATENT ANALYSIS BY COMPANY
    FIGURE 17.PATENT ANALYSIS BY COUNTRY
    FIGURE 18.BLOOD STREAM INFECTION TESTING MARKET,BY PRODUCT,2021(%)
    FIGURE 19.COMPARATIVE SHARE ANALYSIS OF INSTRUMENTS BLOOD STREAM INFECTION TESTING MARKET,2021-2030(%)
    FIGURE 20.COMPARATIVE SHARE ANALYSIS OF CONSUMABLES BLOOD STREAM INFECTION TESTING MARKET,2021-2030(%)
    FIGURE 21.COMPARATIVE SHARE ANALYSIS OF SOFTWARE AND SERVICES BLOOD STREAM INFECTION TESTING MARKET,2021-2030(%)
    FIGURE 22.BLOOD STREAM INFECTION TESTING MARKET,BY TECHNIQUE,2021(%)
    FIGURE 23.COMPARATIVE SHARE ANALYSIS OF CONVENTIONAL BLOOD STREAM INFECTION TESTING MARKET,2021-2030(%)
    FIGURE 24.COMPARATIVE SHARE ANALYSIS OF AUTOMATED BLOOD STREAM INFECTION TESTING MARKET,2021-2030(%)
    FIGURE 25.BLOOD STREAM INFECTION TESTING MARKET,BY TECHNOLOGY,2021(%)
    FIGURE 26.COMPARATIVE SHARE ANALYSIS OF CULTURE-BASED BLOOD STREAM INFECTION TESTING MARKET,2021-2030(%)
    FIGURE 27.COMPARATIVE SHARE ANALYSIS OF MOLECULAR BLOOD STREAM INFECTION TESTING MARKET,2021-2030(%)
    FIGURE 28.COMPARATIVE SHARE ANALYSIS OF PROTEOMIC BLOOD STREAM INFECTION TESTING MARKET,2021-2030(%)
    FIGURE 29.BLOOD STREAM INFECTION TESTING MARKET,BY APPLICATION,2021(%)
    FIGURE 30.COMPARATIVE SHARE ANALYSIS OF BACTERIAL BLOOD STREAM INFECTION TESTING MARKET,2021-2030(%)
    FIGURE 31.COMPARATIVE SHARE ANALYSIS OF FUNGAL BLOOD STREAM INFECTION TESTING MARKET,2021-2030(%)
    FIGURE 32.COMPARATIVE SHARE ANALYSIS OF MYCOBACTERIAL BLOOD STREAM INFECTION TESTING MARKET,2021-2030(%)
    FIGURE 33.BLOOD STREAM INFECTION TESTING MARKET,BY END-USERS,2021(%)
    FIGURE 34.COMPARATIVE SHARE ANALYSIS OF HOSPITALS BLOOD STREAM INFECTION TESTING MARKET,2021-2030(%)
    FIGURE 35.COMPARATIVE SHARE ANALYSIS OF INDEPENDENT DIAGNOSTICS CENTERS BLOOD STREAM INFECTION TESTING MARKET,2021-2030(%)
    FIGURE 36.COMPARATIVE SHARE ANALYSIS OF OTHERS BLOOD STREAM INFECTION TESTING MARKET,2021-2030(%)
    FIGURE 37.BLOOD STREAM INFECTION TESTING MARKET BY REGION,2021
    FIGURE 38.U.S. BLOOD STREAM INFECTION TESTING MARKET,2021-2030($MILLION)
    FIGURE 39.CANADA BLOOD STREAM INFECTION TESTING MARKET,2021-2030($MILLION)
    FIGURE 40.MEXICO BLOOD STREAM INFECTION TESTING MARKET,2021-2030($MILLION)
    FIGURE 41.GERMANY BLOOD STREAM INFECTION TESTING MARKET,2021-2030($MILLION)
    FIGURE 42.UNITED KINGDOM BLOOD STREAM INFECTION TESTING MARKET,2021-2030($MILLION)
    FIGURE 43.FRANCE BLOOD STREAM INFECTION TESTING MARKET,2021-2030($MILLION)
    FIGURE 44.SPAIN BLOOD STREAM INFECTION TESTING MARKET,2021-2030($MILLION)
    FIGURE 45.ITALY BLOOD STREAM INFECTION TESTING MARKET,2021-2030($MILLION)
    FIGURE 46.REST OF EUROPE BLOOD STREAM INFECTION TESTING MARKET,2021-2030($MILLION)
    FIGURE 47.CHINA BLOOD STREAM INFECTION TESTING MARKET,2021-2030($MILLION)
    FIGURE 48.JAPAN BLOOD STREAM INFECTION TESTING MARKET,2021-2030($MILLION)
    FIGURE 49.INDIA BLOOD STREAM INFECTION TESTING MARKET,2021-2030($MILLION)
    FIGURE 50.SOUTH KOREA BLOOD STREAM INFECTION TESTING MARKET,2021-2030($MILLION)
    FIGURE 51.AUSTRALIA BLOOD STREAM INFECTION TESTING MARKET,2021-2030($MILLION)
    FIGURE 52.REST OF ASIA-PACIFIC BLOOD STREAM INFECTION TESTING MARKET,2021-2030($MILLION)
    FIGURE 53.BRAZIL BLOOD STREAM INFECTION TESTING MARKET,2021-2030($MILLION)
    FIGURE 54.SAUDI ARABIA BLOOD STREAM INFECTION TESTING MARKET,2021-2030($MILLION)
    FIGURE 55.UNITED ARAB EMIRATES BLOOD STREAM INFECTION TESTING MARKET,2021-2030($MILLION)
    FIGURE 56.SOUTH AFRICA BLOOD STREAM INFECTION TESTING MARKET,2021-2030($MILLION)
    FIGURE 57.REST OF LAMEA BLOOD STREAM INFECTION TESTING MARKET,2021-2030($MILLION)
    FIGURE 58. TOP WINNING STRATEGIES, BY YEAR
    FIGURE 59. TOP WINNING STRATEGIES, BY DEVELOPMENT
    FIGURE 60. TOP WINNING STRATEGIES, BY COMPANY
    FIGURE 61.PRODUCT MAPPING OF TOP 10 PLAYERS
    FIGURE 62.COMPETITIVE DASHBOARD
    FIGURE 63.COMPETITIVE HEATMAP OF TOP 10 KEY PLAYERS
    FIGURE 64.THERMO FISHER SCIENTIFIC, INC..: NET SALES ,($MILLION)
    FIGURE 65.F. HOFFMANN-LA ROCHE LTD..: NET SALES ,($MILLION)
    FIGURE 66.ABBOTT LABORATORIES.: NET SALES ,($MILLION)
    FIGURE 67.BECTON DICKINSON MEDICAL DEVICES CO. LTD., SUZHOU.: NET SALES ,($MILLION)
    FIGURE 68.BIOMÉRIEUX SA.: NET SALES ,($MILLION)
    FIGURE 69.CEPHEID.: NET SALES ,($MILLION)
    FIGURE 70.LUMINEX CORPORATION.: NET SALES ,($MILLION)
    FIGURE 71.ACCELERATE DIAGNOSTICS INC..: NET SALES ,($MILLION)
    FIGURE 72.ADVANDX.: NET SALES ,($MILLION)
    FIGURE 73.BRUKER CORPORATION.: NET SALES ,($MILLION)


PURCHASE OPTIONS

Call or Email us

U.S.-Canada Toll-free: +1-800-792-5285
Int'l : +1-503-894-6022
Europe : +44-845-528-1300
Email : help@alliedmarketresearch.com
 
FREQUENTLY ASKED QUESTIONS?

A. The increasing geriatric population rising number of sepsis cases are fueling revenue growth of the market. Additionally, enhanced R&D activities have resulted into creating excellent investment opportunities for key players in the market.

A. Product development is the key strategy opted by the operating companies in the bloodstream infection testing market.

A. North America will provide more business opportunities for the global bloodstream infection testing market in future.

A. The major key players in the global bloodstream infection testing market are Thermo Fisher Scientific, F. Hoffmann-La Roche Ltd., Abbott, BD, BIOMÉRIEUX, Cepheid, Luminex Corporation, Accelerate Diagnostics Inc., AdvanDX, and Bruker.

A. The hospitals sub-segment of the end-user acquired the maximum share of the global bloodstream infection testing market in 2021.

A. Hospitals and independent diagnostics centers are the major customers for the bloodstream infection testing market.

A. The report provides an extensive qualitative and quantitative analysis of the current trends and the future estimations of the global bloodstream infection testing market from 2022 to 2030 to determine the prevailing opportunities.

Looking for Customization?

 Customization Request

Have a Question?

 Speak with Analyst

Any Confusion?

 Inquire Before Buying

Have a glance of the Report

  Request Sample
RELATED TAGS

Purchase Full Report of
Blood Stream Infection Testing Market

Start reading instantly.
This Report and over 68,439+ more Reports, Available with Avenue Library. T&C*.

  • Online Only
  • $3,690
  • Online cloud access only
  • Restricted print, copy, paste & download
  • Read only
  • Free industry update
    (Within 180 days)
  • Free report update in next update cycle
    (Jul 2023 - Jul 2024)
  • Data Pack
  • $3,930
  • Restricted to one authorized user
  • One print only
  • Available in
    Excel
  • Free industry update
    (Within 180 days)
  •   Free report update in next update cycle
    (Jul 2023 - Jul 2024)
  • Single User
  • $5,820
  • Restricted to one authorized user
  • One print only
  • Available in
    PDF
  • Free industry update
    (Within 180 days)
  •   Free report update in next update cycle
    (Jul 2023 - Jul 2024)
  • Five Users
  • $6,540
  • Limited to five authorized users
  • Print upto five copies
  • Available in
    PDF
  • Free industry update
    (Within 180 days)
  •   Free report update in next update cycle
    (Jul 2023 - Jul 2024)
  • Enterprise
    License/PDF

  • $9,870
  • Unlimited
    within
    company/enterprise
  • Available in Excel & PDF
  • Free industry update
    (Within 180 days)
  •   Free report update in next update cycle
    (Jul 2023 - Jul 2024)
  • Library
    Membership

  • $999 $ 1,175
    Per User/ Per month/ Billed annually
  • Published Content
    E-access
  • Company Profiles
    E-access
  • Newly Added Content Access
  • 10 PDF
    Downloads
  • 5 Excel Data
    Pack Downloads
  • 250 Company Profiles PDF Downloads
  • Buy Now

*Taxes/Fees, if applicable will be added during checkout. All prices in USD

RELATED REPORTS
 

Why Allied Market Research?


Infallible Methodology

To ensure high-level data integrity, accurate analysis, and impeccable forecasts

Analyst Support

For complete satisfaction

Customization

On-demand customization of scope of the report to exactly meet your needs

TARGETED MARKET VIEW

Targeted market view to provide pertinent information and save time of readers

Get fresh content delivered

Get insights on topics that are crucial for your business. Stay abreast of your interest areas.

Get Industry Data Alerts

Why Allied Market Research?

Infallible Methodology

To ensure high-level data integrity, accurate analysis, and impeccable forecasts

Analyst Support

For complete satisfaction

Customization

On-demand customization of scope of the report to exactly meet your needs

TARGETED MARKET VIEW

Targeted market view to provide pertinent information and save time of readers