Report Code: A15617 | Jan 2022 | Pages: 245 | ||
Tables: 111 | Charts: 41 |
|
Pandemic disrupted the entire world and affected many industries.
Get detailed COVID-19 impact analysis on the Bolts Market
Request Now !
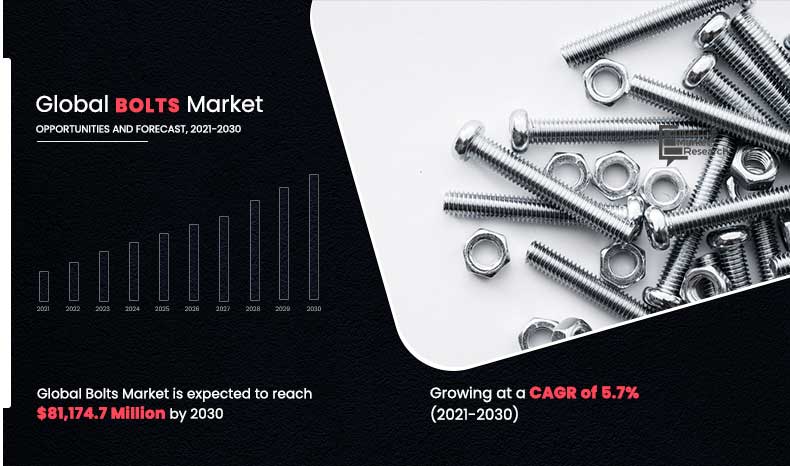
The global bolts market size was valued at $46,854.3 million in 2020, and is projected to reach $81,174.7 million by 2030, registering a CAGR of 5.7% from 2021 to 2030. Bolts are a type of threaded fastener which are used to hold objects in their position. Bolts typically consist of a head and a cylindrical body with threads either throughout or along a portion of its length.
The market was hampered during the outbreak of COVID-19 pandemic, owing to restrictions of manufacturing activities. In addition, the manufacturing of products that are assembled using hot melt technology was hampered owing to limited sales of the end-use products through retail stores.
The rising number of construction activities across the globe has fueled the use of steel construction components, thereby increasing the use of metal fasteners as they are extensively used for joining various steel components. Properties of bolts such as high shear strength and ability of bolted joints to reduce temperature stresses in steel connections, fuels the use of bolts in the construction industry. In addition, bolts are used in automotive industry for connecting various components of engine, drivetrain and body panels. Thus, rapid growth of automotive industry in developing countries has boosted the demand for bolts market.
Increasing population in developing economies such as India, China, Mexico, Brazil, and others has resulted in rapid urbanization. According to the United Nations (UN), around 68% of the world population is expected to live in urban areas by 2050. This rapid urbanization will increase the demand for infrastructure such as metro rails and airport, thereby boosting the construction industry. For instance, in India, 10 cities have an operational metro rail systems as of 2020, and 15 more cities are planned to have an operational metro rail system in the next few years. This rapid increase in construction activities is expected to increase the demand for bolts. Furthermore, the automotive industry in developing countries witnesses rapid growth. For instance, China has emerged as the world’s largest automotive market in the last few years and Mexico is emerging as an automotive manufacturing hub in the Latin America region. However, factors such as fluctuation in prices of raw materials such as steel and increase in energy prices can hinder the bolts market growth.
The novel coronavirus has rapidly spread across various countries and regions, causing an enormous impact on the lives of people and the overall community. It began as a human health condition and has now become a significant threat to global trade, economy, and finance. The COVID-19 pandemic has halted the production of many products in the bolt business due to the lockdown. Furthermore, the number of COVID-19 cases are expected to reduce in the near future as the vaccine for COVID-19 is introduced in the market. This has led to the reopening of bolt manufacturing companies at their full-scale capacities. This will help the market to recover by the start of 2022. After COVID-19 infection cases begin to decline, bolt manufacturers must focus on protecting their staff, operations, and supply networks to respond to urgent emergencies and establish new methods of working.
Furthermore, growth of manufacturing industry is anticipated to increase the use of bolts as they are used for joining various manufacturing assemblies and machineries. In addition, growth of aviation industry fueled by increasing passenger air traffic, is anticipated to boost the use of bolts in aerospace industry.
The global bolts market is segmented on the basis of type, material, end user, and region. By type, the market is categorized into half screw bolt and full screw bolt. Depending on material, it is fragmented into plastic and metal. On the basis of end user, it is categorized into automotive, aerospace, construction, industrial machinery and other. Region wise, the market is analyzed across North America, Europe, Asia-Pacific, and LAMEA. Asia-Pacific dominated the market in 2020, accounting for the highest share, and is anticipated to maintain this trend throughout the forecast period. This is attributed to increase in population, urbanization, and industries.
Asia-Pacific is one of the fastest growing regions around the globe attributed to its large population and low-cost manufacturing sector. China and Japan are leading manufacturers of automobiles and construction machines. Furthermore, the construction and manufacturing industries in countries such as India, Indonesia, Vietnam and Bangladesh are experiencing significant growth. In addition, the automotive industry in the region is also witnessing significant growth fueled by increasing purchasing power of the masses. These factors positively influence the growth of bolts market share in the region.
Government initiative such as ‘Make in India’ and ‘Made in China 2025’ have positively influenced the manufacturing sector in the region. Such initiatives are expected to boost the manufacturing sector, thereby fueling the use of bolts in industrial machineries.
Key Benefits For Stakeholders
Bolts Market Report Highlights
Aspects | Details |
---|---|
By Type |
|
By Material |
|
By END USER |
|
By Region |
|
Key Market Players | BIG BOLT NUT, KD FASTENERS, INC., REYHER Nchfg. GmbH & Co. KG, FABORY, A.B. STEEL WORK, FASTENAL COMPANY, B&G MANUFACTURING CO. INC., BRUNNER MANUFACTURING CO., INC., KELLER & KALMBACH GMBH, ELGIN FASTENER GROUP |
CHAPTER 1:INTRODUCTION
1.1.Report description
1.2.Key benefits for stakeholders
1.3.Key market segments
1.4.Research methodology
1.4.1.Primary research
1.4.2.Secondary research
1.4.3.Analyst tools and models
CHAPTER 2:EXECUTIVE SUMMARY
2.1.Key findings of the study
2.2.CXO perspective
CHAPTER 3:MARKET OVERVIEW
3.1.Market definition and scope
3.2.Key findings
3.2.1.Top investment pockets
3.2.2.Top winning strategies
3.3.Market player positioning, 2020
3.4.Porter's five forces analysis
3.5.Market dynamics
3.5.1.Drivers
3.5.1.1.Growth of construction industry
3.5.1.2.Growth of manufacturing sector
3.5.1.3.Technical & Economic Efficiency
3.5.2.Restraint
3.5.2.1.Fluctuating Cost of Raw Materials
3.5.2.2.Less Accuracy of Bolted Connections
3.5.3.Opportunity
3.5.3.1.Increase in demand from automotive industry
3.6.COVID-19 Impact Analysis
CHAPTER 4:BOLTS MARKET, BY TYPE
4.1.Overview
4.1.1.Market size and forecast, by type
4.2.Half Screw Bolt
4.2.1.Key market trends, growth factors, and opportunities
4.2.2.Market size and forecast, by region
4.2.3.Market size and forecast, by country
4.3.Full Screw Bolt
4.3.1.Key market trends, growth factors, and opportunities
4.3.2.Market size and forecast, by region
4.3.3.Market size and forecast, by country
CHAPTER 5:BOLTS MARKET, BY MATERIAL
5.1.Overview
5.1.1.Market size and forecast, by material
5.2.Metal
5.2.1.Key market trends, growth factors, and opportunities
5.2.2.Market size and forecast, by region
5.2.3.Market size and forecast, by country
5.3.Plastic
5.3.1.Key market trends, growth factors, and opportunities
5.3.2.Market size and forecast, by region
5.3.3.Market size and forecast, by country
CHAPTER 6:BOLTS MARKET, BY END USER
6.1.Overview
6.1.1.Market size and forecast, by end user
6.2.Automotive
6.2.1.Key market trends, growth factors, and opportunities
6.2.2.Market size and forecast, by region
6.2.3.Market size and forecast, by country
6.3.Aerospace
6.3.1.Key market trends, growth factors, and opportunities
6.3.2.Market size and forecast, by region
6.3.3.Market size and forecast, by country
6.4.Construction
6.4.1.Key market trends, growth factors, and opportunities
6.4.2.Market size and forecast, by region
6.4.3.Market size and forecast, by country
6.5.Industrial Machinery
6.5.1.Key market trends, growth factors, and opportunities
6.5.2.Market size and forecast, by region
6.5.3.Market size and forecast, by country
6.6.Others
6.6.1.Key market trends, growth factors, and opportunities
6.6.2.Market size and forecast, by region
6.6.3.Market size and forecast, by country
CHAPTER 7:BOLTS MARKET, BY REGION
7.1.Market overview
7.1.1.Market size and forecast, by region
7.2.North America
7.2.1.Key market trends, growth factors, and opportunities
7.2.2.North America market size and forecast, by type
7.2.3.North America market size and forecast, by material
7.2.4.North America market size and forecast, by end user
7.2.5.North America market size and forecast, by country
7.2.5.1.U.S.
7.2.5.1.1.U.S. market size and forecast, by type
7.2.5.1.2.U.S. market size and forecast, by material
7.2.5.1.3.U.S. market size and forecast, by end user
7.2.5.2.Canada
7.2.5.2.1.Canada market size and forecast, by type
7.2.5.2.2.Canada market size and forecast, by material
7.2.5.2.3.Canada market size and forecast, by end user
7.2.5.3.Mexico
7.2.5.3.1.Mexico market size and forecast, by type
7.2.5.3.2.Mexico market size and forecast, by material
7.2.5.3.3.Mexico market size and forecast, by end user
7.3.Europe
7.3.1.Key market trends, growth factors, and opportunities
7.3.2.Europe market size and forecast, by type
7.3.3.Europe market size and forecast, by material
7.3.4.Europe market size and forecast, by end user
7.3.5.Europe market size and forecast, by country
7.3.5.1.Germany
7.3.5.1.1.Germany market size and forecast, by type
7.3.5.1.2.Germany market size and forecast, by material
7.3.5.1.3.Germany market size and forecast, by end user
7.3.5.2.France
7.3.5.2.1.France market size and forecast, by type
7.3.5.2.2.France market size and forecast, by material
7.3.5.2.3.France market size and forecast, by end user
7.3.5.3.UK
7.3.5.3.1.UK market size and forecast, by type
7.3.5.3.2.UK market size and forecast, by material
7.3.5.3.3.UK market size and forecast, by end user
7.3.5.4.Italy
7.3.5.4.1.Italy market size and forecast, by type
7.3.5.4.2.Italy market size and forecast, by material
7.3.5.4.3.Italy market size and forecast, by end user
7.3.5.5.Rest of Europe
7.3.5.5.1.Rest of Europe market size and forecast, by type
7.3.5.5.2.Rest of Europe market size and forecast, by material
7.3.5.5.3.Rest of Europe market size and forecast, by end user
7.4.Asia-Pacific
7.4.1.Key market trends, growth factors, and opportunities
7.4.2.Asia-Pacific market size and forecast, by type
7.4.3.Asia-Pacific market size and forecast, by material
7.4.4.Asia-Pacific market size and forecast, by end user
7.4.5.Asia-Pacific market size and forecast, by country
7.4.5.1.China
7.4.5.1.1.China market size and forecast, by type
7.4.5.1.2.China market size and forecast, by material
7.4.5.1.3.China market size and forecast, by end user
7.4.5.2.India
7.4.5.2.1.India market size and forecast, by type
7.4.5.2.2.India market size and forecast, by material
7.4.5.2.3.India market size and forecast, by end user
7.4.5.3.Japan
7.4.5.3.1.Japan market size and forecast, by type
7.4.5.3.2.Japan market size and forecast, by material
7.4.5.3.3.Japan market size and forecast, by end user
7.4.5.4.South Korea
7.4.5.4.1.South Korea market size and forecast, by type
7.4.5.4.2.South Korea market size and forecast, by material
7.4.5.4.3.South Korea market size and forecast, by end user
7.4.5.5.Rest of Asia-Pacific
7.4.5.5.1.Rest of Asia-Pacific market size and forecast, by type
7.4.5.5.2.Rest of Asia-Pacific market size and forecast, by material
7.4.5.5.3.Rest of Asia-Pacific market size and forecast, by end user
7.5.LAMEA
7.5.1.Key market trends, growth factors, and opportunities
7.5.2.LAMEA market size and forecast, by type
7.5.3.LAMEA market size and forecast, by material
7.5.4.LAMEA market size and forecast, by end user
7.5.5.LAMEA market size and forecast, by country
7.5.5.1.Latin America
7.5.5.1.1.Latin America market size and forecast, by type
7.5.5.1.2.Latin America market size and forecast, by material
7.5.5.1.3.Latin America market size and forecast, by end user
7.5.5.2.Middle East
7.5.5.2.1.Middle East market size and forecast, by type
7.5.5.2.2.Middle East market size and forecast, by material
7.5.5.2.3.Middle East market size and forecast, by end user
7.5.5.3.Africa
7.5.5.3.1.Africa market size and forecast, by type
7.5.5.3.2.Africa market size and forecast, by material
7.5.5.3.3.Africa market size and forecast, by end user
CHAPTER 8:COMPANY PROFILE
8.1.A.B. STEEL WORK
8.1.1.Company overview
8.1.2.Key executive
8.1.3.Company snapshot
8.1.4.Product portfolio
8.2.B&G MANUFACTURING CO. INC.
8.2.1.Company overview
8.2.2.Key executive
8.2.3.Company snapshot
8.2.4.Product portfolio
8.3.BIG BOLT NUT
8.3.1.Company overview
8.3.2.Key executive
8.3.3.Company snapshot
8.3.4.Product portfolio
8.4.BRUNNER MANUFACTURING CO., INC.
8.4.1.Company overview
8.4.2.Key executive
8.4.3.Company snapshot
8.4.4.Operating business segments
8.4.5.Product portfolio
8.5.FABORY
8.5.1.Company overview
8.5.2.Key executive
8.5.3.Company snapshot
8.5.4.Operating business segments
8.5.5.Product portfolio
8.5.6.Key strategic moves and developments
8.6.FASTENAL COMPANY
8.6.1.Company overview
8.6.2.Key executive
8.6.3.Company snapshot
8.6.4.Product portfolio
8.6.5.Business performance
8.7.KD FASTENERS, INC.
8.7.1.Company overview
8.7.2.Key executive
8.7.3.Company snapshot
8.7.4.Operating business segments
8.7.5.Product portfolio
8.8.KELLER & KALMBACH GMBH
8.8.1.Company overview
8.8.2.Key executive
8.8.3.Company snapshot
8.8.4.Product portfolio
8.8.5.Key strategic moves and developments
8.9.REYHER Nchfg. GmbH & Co. KG
8.9.1.Company overview
8.9.2.Key executive
8.9.3.Company snapshot
8.9.4.Operating business segments
8.9.5.Product portfolio
8.9.6.Key strategic moves and developments
8.10.ELGIN FASTENER GROUP
8.10.1.Company overview
8.10.2.Key executive
8.10.3.Company snapshot
8.10.4.Product portfolio
8.10.5.Key strategic moves and developments
LIST OF TABLES
TABLE 01.BOLTS MARKET REVENUE, BY TYPE, 2020–2030 ($MILLION)
TABLE 02.BOLTS MARKET REVENUE FOR HALF SCREW BOLTS, BY REGION, 2020–2030 ($MILLION)
TABLE 03.BOLTS MARKET REVENUE FOR FULL SCREW BOLTS, BY REGION, 2020–2030 ($MILLION)
TABLE 04.BOLTS MARKET REVENUE, BY MATERIAL, 2020–2030 ($MILLION)
TABLE 05.BOLTS MARKET REVENUE FOR METAL, BY REGION, 2020–2030 ($MILLION)
TABLE 06.BOLTS MARKET REVENUE FOR PLASTIC, BY REGION, 2020–2030 ($MILLION)
TABLE 07.BOLTS MARKET REVENUE, BY END USER, 2020–2030 ($MILLION)
TABLE 08.BOLTS MARKET REVENUE FOR AUTOMOTIVE, BY REGION, 2020–2030 ($MILLION)
TABLE 09.BOLTS MARKET REVENUE FOR AEROSPACE, BY REGION, 2020–2030 ($MILLION)
TABLE 10.BOLTS MARKET REVENUE FOR CONSTRUCTION, BY REGION, 2020–2030 ($MILLION)
TABLE 11.BOLTS MARKET REVENUE FOR INDUSTRIAL MACHINERY, BY REGION, 2020–2030 ($MILLION)
TABLE 12.BOLTS MARKET REVENUE FOR OTHERS, BY REGION, 2020–2030 ($MILLION)
TABLE 13.BOLTS MARKET, BY REGION, 2020–2030 ($MILLION)
TABLE 14.NORTH AMERICA BOLTS MARKET, BY TYPE, 2020–2030 ($MILLION)
TABLE 15.NORTH AMERICA BOLTS MARKET, BY MATERIAL, 2020–2030 ($MILLION)
TABLE 16.NORTH AMERICA BOLTS MARKET, BY END USER, 2020–2030 ($MILLION)
TABLE 17.NORTH AMERICA BOLTS MARKET , BY COUNTRY, 2020–2030 ($MILLION)
TABLE 18.U.S. BOLTS MARKET, BY TYPE, 2020–2030 ($MILLION)
TABLE 19.U.S. BOLTS MARKET, BY MATERIAL, 2020–2030 ($MILLION)
TABLE 20.U.S. BOLTS MARKET, BY END USER, 2020–2030 ($MILLION)
TABLE 21.CANADA BOLTS MARKET, BY TYPE, 2020–2030 ($MILLION)
TABLE 22.CANADA BOLTS MARKET, BY MATERIAL, 2020–2030 ($MILLION)
TABLE 23.CANADA BOLTS MARKET, BY END USER, 2020–2030 ($MILLION)
TABLE 24.MEXICO BOLTS MARKET, BY TYPE, 2020–2030 ($MILLION)
TABLE 25.MEXICO BOLTS MARKET, BY MATERIAL, 2020–2030 ($MILLION)
TABLE 26.MEXICO BOLTS MARKET, BY END USER, 2020–2030 ($MILLION)
TABLE 27.EUROPE BOLTS MARKET, BY TYPE, 2020–2030 ($MILLION)
TABLE 28.EUROPE BOLTS MARKET, BY MATERIAL, 2020–2030 ($MILLION)
TABLE 29.EUROPE BOLTS MARKET, BY END USER, 2020–2030 ($MILLION)
TABLE 30.EUROPE BOLTS MARKET, BY COUNTRY, 2020–2030 ($MILLION)
TABLE 31.GERMANY BOLTS MARKET, BY TYPE, 2020–2030 ($MILLION)
TABLE 32.GEMRNAY BOLTS MARKET, BY MATERIAL, 2020–2030 ($MILLION)
TABLE 33.GERMANY BOLTS MARKET, BY END USER, 2020–2030 ($MILLION)
TABLE 34.FRANCE BOLTS MARKET, BY TYPE, 2020–2030 ($MILLION)
TABLE 35.FRANCE BOLTS MARKET, BY MATERIAL, 2020–2030 ($MILLION)
TABLE 36.FRANCE BOLTS MARKET, BY END USER, 2020–2030 ($MILLION)
TABLE 37.UK BOLTS MARKET, BY TYPE, 2020–2030 ($MILLION)
TABLE 38.UK BOLTS MARKET, BY MATERIAL, 2020–2030 ($MILLION)
TABLE 39.UK BOLTS MARKET, BY END USER, 2020–2030 ($MILLION)
TABLE 40.ITALY BOLTS MARKET, BY TYPE, 2020–2030 ($MILLION)
TABLE 41.ITALY BOLTS MARKET, BY MATERIAL, 2020–2030 ($MILLION)
TABLE 42.ITALY BOLTS MARKET, BY END USER, 2020–2030 ($MILLION)
TABLE 43.REST OF EUROPE BOLTS MARKET, BY TYPE, 2020–2030 ($MILLION)
TABLE 44.REST OF EUROPE BOLTS MARKET, BY MATERIAL, 2020–2030 ($MILLION)
TABLE 45.REST OF EUROPE BOLTS MARKET, BY END USER, 2020–2030 ($MILLION)
TABLE 46.ASIA-PACIFIC BOLTS MARKET, BY TYPE, 2020–2030 ($MILLION)
TABLE 47.ASIA-PACIFIC BOLTS MARKET, BY MATERIAL, 2020–2030 ($MILLION)
TABLE 48.ASIA-PACIFIC BOLTS MARKET, BY END USER, 2020–2030 ($MILLION)
TABLE 49.ASIA-PACIFIC BOLTS MARKET , BY COUNTRY, 2020–2030 ($MILLION)
TABLE 50.CHINA BOLTS MARKET, BY TYPE, 2020–2030 ($MILLION)
TABLE 51.CHINA BOLTS MARKET, BY MATERIAL, 2020–2030 ($MILLION)
TABLE 52.CHINA BOLTS MARKET, BY END USER, 2020–2030 ($MILLION)
TABLE 53.INDIA BOLTS MARKET, BY TYPE, 2020–2030 ($MILLION)
TABLE 54.INDIA BOLTS MARKET, BY MATERIAL, 2020–2030 ($MILLION)
TABLE 55.INDIA BOLTS MARKET, BY END USER, 2020–2030 ($MILLION)
TABLE 56.JAPAN BOLTS MARKET, BY TYPE, 2020–2030 ($MILLION)
TABLE 57.JAPAN BOLTS MARKET, BY MATERIAL, 2020–2030 ($MILLION)
TABLE 58.JAPAN BOLTS MARKET, BY END USER, 2020–2030 ($MILLION)
TABLE 59.SOUTH KOREA BOLTS MARKET, BY TYPE, 2020–2030 ($MILLION)
TABLE 60.SOUTH KOREA BOLTS MARKET, BY MATERIAL, 2020–2030 ($MILLION)
TABLE 61.SOUTH KOREA BOLTS MARKET, BY END USER, 2020–2030 ($MILLION)
TABLE 62.REST OF ASIA-PACIFIC BOLTS MARKET, BY TYPE, 2020–2030 ($MILLION)
TABLE 63.REST OF ASIA-PACIFIC BOLTS MARKET, BY MATERIAL, 2020–2030 ($MILLION)
TABLE 64.REST OF ASIA-PACIFIC BOLTS MARKET, BY END USER, 2020–2030 ($MILLION)
TABLE 65.LAMEA BOLTS MARKET, BY TYPE, 2020–2030 ($MILLION)
TABLE 66.LAMEA BOLTS MARKET, BY MATERIAL, 2020–2030 ($MILLION)
TABLE 67.LAMEA BOLTS MARKET, BY END USER, 2020–2030 ($MILLION)
TABLE 68.LAMEA BOLTS MARKET, BY COUNTRY, 2020–2030 ($MILLION)
TABLE 69.LATIN AMERICA BOLTS MARKET, BY TYPE, 2020–2030 ($MILLION)
TABLE 70.LATIN AMERICA BOLTS MARKET, BY MATERIAL, 2020–2030 ($MILLION)
TABLE 71.LATIN AMERICA BOLTS MARKET, BY END USER, 2020–2030 ($MILLION)
TABLE 72.MIDDLE EAST BOLTS MARKET, BY TYPE, 2020–2030 ($MILLION)
TABLE 73.MIDDLE EAST BOLTS MARKET, BY MATERIAL, 2020–2030 ($MILLION)
TABLE 74.MIDDLE EAST BOLTS MARKET, BY END USER, 2020–2030 ($MILLION)
TABLE 75.AFRICA BOLTS MARKET, BY TYPE, 2020–2030 ($MILLION)
TABLE 76.AFRICA BOLTS MARKET, BY MATERIAL, 2020–2030 ($MILLION)
TABLE 77.AFRICA BOLTS MARKET, BY END USER, 2020–2030 ($MILLION)
TABLE 78.A.B. STEEL WORKS: KEY EXECUTIVE
TABLE 79.A.B. STEEL WORKS: COMPANY SNAPSHOT
TABLE 80.A.B. STEEL WORKS: PRODUCT PORTFOLIO
TABLE 81.B&G MANUFACTURING: KEY EXECUTIVE
TABLE 82.B&G MANUFACTURING: COMPANY SNAPSHOT
TABLE 83.B&G MANUFACTURING: PRODUCT PORTFOLIO
TABLE 84.BIG BOLT NUT: KEY EXECUTIVE
TABLE 85.BIG BOLT NUT: COMPANY SNAPSHOT
TABLE 86.BIG BOLT NUT: PRODUCT PORTFOLIO
TABLE 87.BRUNNER MANUFACTURING: KEY EXECUTIVE
TABLE 88.BRUNNER MANUFACTURING: COMPANY SNAPSHOT
TABLE 89.BRUNNER MANUFACTURING: OPERATING SEGMENTS
TABLE 90.BRUNNER MANUFACTURING: PRODUCT PORTFOLIO
TABLE 91.FABORY: KEY EXECUTIVE
TABLE 92.FABORY: COMPANY SNAPSHOT
TABLE 93.FABORY: OPERATING SEGMENTS
TABLE 94.FABORY: PRODUCT PORTFOLIO
TABLE 95.FASTENAL: KEY EXECUTIVE
TABLE 96.FASTENAL: COMPANY SNAPSHOT
TABLE 97.FASTENAL: PRODUCT PORTFOLIO
TABLE 98.KD FASTENERS, INC: KEY EXECUTIVE
TABLE 99.KD FASTENERS, INC: COMPANY SNAPSHOT
TABLE 100.KD FASTENERS: OPERATING SEGMENTS
TABLE 101.KD FASTENERS, INC: PRODUCT PORTFOLIO
TABLE 102.KELLER & KALMBACH: KEY EXECUTIVE
TABLE 103.KELLER & KALMBACH: COMPANY SNAPSHOT
TABLE 104.KELLER & KALMBACH: PRODUCT PORTFOLIO
TABLE 105.REYHER: KEY EXECUTIVE
TABLE 106.REYHER: COMPANY SNAPSHOT
TABLE 107.REYHER: OPERATING SEGMENTS
TABLE 108.REYHER: PRODUCT PORTFOLIO
TABLE 109.ELGIN FASTENERS GROUP: KEY EXECUTIVE
TABLE 110.ELGIN FASTENERS GROUP: COMPANY SNAPSHOT
TABLE 111.ELGIN FASTENERS GROUP: PRODUCT PORTFOLIO
LIST OF FIGURES
FIGURE 01.KEY MARKET SEGMENTS
FIGURE 02.EXECUTIVE SUMMARY
FIGURE 03.TOP INVESTMENT POCKETS
FIGURE 04.TOP WINNING STRATEGIES, BY YEAR, 2020–2021
FIGURE 05.TOP WINNING STRATEGIES, BY DEVELOPMENT, 2019–2021 (%)
FIGURE 06.TOP WINNING STRATEGIES, BY COMPANY, 2020–2021
FIGURE 07.MARKET PLAYER POSITIONING, 2020
FIGURE 08.LOW TO MODERATE BARGAINING POWER OF SUPPLIERS
FIGURE 09.LOW-TO-MODERATE BARGAINING POWER OF BUYERS
FIGURE 10.MODERATE-TO-HIGH THREAT OF SUBSTITUTES
FIGURE 11.MODERATE-TO-HIGH THREAT OF NEW ENTRANTS
FIGURE 12.LOW-TO-MODERATE INTENSITY OF RIVALRY
FIGURE 13.BOLTS MARKET, BY TYPE, 2020–2030 (%)
FIGURE 14.COMPARATIVE SHARE ANALYSIS OF BOLTS MARKET FOR HALF SCREW BOLTS, BY COUNTRY, 2020–2030 (%)
FIGURE 15.COMPARATIVE SHARE ANALYSIS OF BOLTS MARKET FOR FULL SCREW BOLT, BY COUNTRY, 2020–2030 (%)
FIGURE 16.BOLTS MARKET, BY MATERIAL, 2020–2030 (%)
FIGURE 17.COMAPARATIVE SHARE ANALYSIS OF BOLTS MARKET FOR METAL, BY COUNTRY, 2020–2030 (%)
FIGURE 18.COMPARATIVE SHARE ANALYSIS OF BOLTS MARKET FOR PLASTIC, BY COUNTRY, 2020–2030 (%)
FIGURE 19.BOLTS MARKET, BY END USER, 2020–2030 (%)
FIGURE 20.COMPARATIVE SHARE ANALYSIS OF BOLTS MARKET FOR AUTOMOTIVE, BY COUNTRY, 2020–2030 (%)
FIGURE 21.COMPARATIVE SHARE ANALYSIS OF BOLTS MARKET FOR AEROSPACE, BY COUNTRY, 2020–2030 (%)
FIGURE 22.COMPARATIVE SHARE ANALYSIS OF BOLTS MARKET FOR CONSTRUCTION, BY COUNTRY, 2020–2030 (%)
FIGURE 23.COMPARATIVE SHARE ANALYSIS OF BOLTS MARKET FOR INDUSTRIAL MACHINERY, BY COUNTRY, 2020–2030 (%)
FIGURE 24.COMPARATIVE SHARE ANALYSIS OF BOLTS MARKET FOR OTHERS, BY COUNTRY, 2020–2030 (%)
FIGURE 25.BOLTS MARKET, BY REGION, 2020–2030
FIGURE 26.U.S. BOLTS MARKET REVENUE, 2020-2030 ($MILLION)
FIGURE 27.CANADA BOLTS MARKET REVENUE, 2020-2030 ($MILLION)
FIGURE 28.MEXICO BOLTS MARKET REVENUE, 2020-2030 ($MILLION)
FIGURE 29.GERMANY BOLTS MARKET REVENUE, 2020-2030 ($MILLION)
FIGURE 30.FRANCE BOLTS MARKET REVENUE, 2020-2030 ($MILLION)
FIGURE 31.UK BOLTS MARKET REVENUE, 2020-2030 ($MILLION)
FIGURE 32.ITALY BOLTS MARKET REVENUE, 2020-2030 ($MILLION)
FIGURE 33.REST OF EUROPE BOLTS MARKET REVENUE, 2020-2030 ($MILLION)
FIGURE 34.CHINA BOLTS MARKET REVENUE, 2020-2030 ($MILLION)
FIGURE 35.INDIA BOLTS MARKET REVENUE, 2020-2030 ($MILLION)
FIGURE 36.JAPAN BOLTS MARKET REVENUE, 2020-2030 ($MILLION)
FIGURE 37.SOUTH KOREA BOLTS MARKET REVENUE, 2020-2030 ($MILLION)
FIGURE 38.REST OF ASIA-PACIFIC BOLTS MARKET REVENUE, 2020-2030 ($MILLION)
FIGURE 39.LATIN AMERICA BOLTS MARKET REVENUE, 2020-2030 ($MILLION)
FIGURE 40.MIDDLE EAST BOLTS MARKET REVENUE, 2020-2030 ($MILLION)
FIGURE 41.AFRICA BOLTS MARKET REVENUE, 2020-2030 ($MILLION)
The bolts market has witnessed significant growth in past few years, owing to increase in construction activities and physical properties of bolts such as high strength and durability.
The world is witnessing an increase in construction activities owing to increasing population and importance of infrastructure in the overall development of a country. Steel sections such as I-sections, C-sections, plates and hollow elements are being extensively used for constructing components such as roofs, girders and columns. Thus, increase in construction activities has led to rise in demand for bolts, as they are extensively used in connecting steel components such as trusses and roof components. In addition, bolts are used in automotive industry for connecting various components of vehicles, thus the rapid growth of automotive industry in developing economies positively influences the bolt market.
Moreover, increase in government and private investment in construction and automotive industry provides lucrative opportunities for the growth of the bolts market.
A. The bolt market size was valued at $46,854.3 million in 2020.
A. Based on type, the half screw bolt segment holds the maximum market share of the bolt market in 2020.
A. The bolt market is projected to reach $81,174.7 million by 2030.
A. Growth in construction sector and manufacturing sector are the key trends in the bolt market.
A. The product launch is key growth strategy of bolt industry players.
A. The company profile has been selected on factors such as geographical presence, market dominance (in terms of revenue and volume sales), various strategies and recent developments.
A. Fluctuating cost of raw materials and less accuracy of bolted connections are the effecting factors for bolt market.
A. The end user of bolts includes automotive, aerospace, construction, industrial machinery and others.
Start reading instantly.
This Report and over 67,068+ more Reports, Available with Avenue Library. T&C*.
Enterprise
License/PDF
Library
Membership
*Taxes/Fees, if applicable will be added during checkout. All prices in USD
To ensure high-level data integrity, accurate analysis, and impeccable forecasts
For complete satisfaction
On-demand customization of scope of the report to exactly meet your needs
Targeted market view to provide pertinent information and save time of readers
Get insights on topics that are crucial for your business. Stay abreast of your interest areas.
Get Industry Data AlertsTo ensure high-level data integrity, accurate analysis, and impeccable forecasts
For complete satisfaction
On-demand customization of scope of the report to exactly meet your needs
Targeted market view to provide pertinent information and save time of readers