0
2022
Bone Void Fillers Market

Bone Void Fillers Market

by Type (Demineralized bone matrix, Calcium phosphate bone graft substitute, Collagen Matrix, Others), by Form (Gel and Putty, Granules, Others), by Application (Spine fusion, Bone fracture, Others), by End User (Hospital, Specialty Clinics, Others): Global Opportunity Analysis and Industry Forecast, 2021-2031

Report Code: A16839
Jun 2022 | Pages: 303
Tables: 178
Charts: 64
  • Formats*:

  • pdf

    Single User License, Five User
    License & Enterprise User License

  • xls

    Data Pack Excel License

  • ppt

    It comes with the additional cost
    of $2500.00 contact sales.


Bone Void Fillers Market Research, 2031

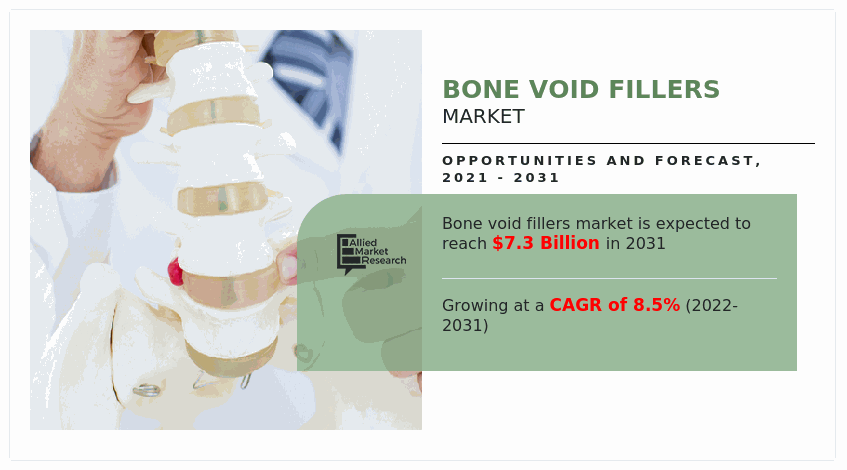
The global bone void fillers market size was valued at $3.2 billion in 2021, and is projected to reach $7.3 billion by 2031, growing at a CAGR of 8.5% from 2022 to 2031.Bone void is a complication caused due to failure of bone’s self-healing process. It creates cavity or gap in the bones. Bone voids are generated due to any bone defect from traumatic injury or due to surgical osseous. Bone void fillers are absorbable, biocompatible, bioactive, and osteoconductive in nature, which are used to fill bone gaps and cavities. They provide support and stability to bone structure. Different types of bone void fillers include demineralized bone matrix, calcium phosphate bone graft substitute, and collagen matrix bone graft substitute. They are available in different forms such as gel & putty, granules, paste, sponge, and liquid. Bone void fillers are used in various surgical procedure, such as spine fusion, bone fracture, pelvic surgery, and knee surgery.

The COVID-19 outbreak is anticipated to have a negative impact on growth of the global bone void fillers market. During the COVID-19 pandemic period, stringent regulations were implemented by local and national governments on the delivery of products from companies. Increase in number of COVID-19 cases led to decline in the number of surgical procedures.

The growth of the global bone void fillers market size is majorly driven by increase in prevalence of orthopedic diseases such as osteoarthritis, osteoporosis, scoliosis, bone tumor, and bone infection; increase in R&D activities in bone void fillers industry; rise in funding from private & government organizations for development of the healthcare sector and research centers; and surge in geriatric population. According to United Nations, in 2020, it was reported there were 727 million individuals aged 65 years or above, across the world. It was estimated that the number of aging people is projected to double to 1.5 billion by 2050. Moreover, according to the World Health Organization (WHO) in October 2021, it was reported that 1 in 6 people in the world will be aged 60 years or over by 2030. For instance, in 2020, Journal of EClinicalMedicine reported that approximately 22% of the population above the age of 40 years is diagnosed with knee osteoarthritis, globally. 

Bone Void Fillers Market, Bone Void Fillers Market Size, Bone Void Fillers Market Share, Bone Void Fillers Market Analysis, Bone Void Fillers Market Growth, Bone Void Fillers Market Opportunity, Bone Void Fillers Market Trends


Furthermore, rise in number of product launch of bone void fillers is anticipated to fuel the bone void fillers market growth. For instance, in February 2022, Orthofix Medical Inc., medical equipment manufacturer for orthopedic and spine solutions, announced the launch of Opus BA, which is an synthetic bioactive bone graft and used for cervical and lumber spine surgery procedure. Moreover, in September 2021, Orthofix Medical Inc., announced the launch of Opus Mg Set, which is available in the form of synthetic magnesium-based bone void filler and used for orthopedic procedure. Opus Mg Set provides a procedure-specific solution for orthopedic fracture care and trauma applications by filling non-structural bony voids or gaps during surgery.

In addition, rise in number of orthopedic surgeries such as cervical and lumbar spine surgery procedure and increase in hip & knee replacements propel the growth of the bone void fillers market. For instance, according to report published by the American Joint Replacement Surgery (AJRS), approximately 2 million knee and hip replacement surgeries were performed in the U.S. in 2020.

Bone Void Fillers Market Segmentation

The bone void fillers market is segmented into  type, form, application, end user, and region. By type, the market is segregated into demineralized bone matrix, calcium phosphate bone graft substitute, collagen matrix, and others. The others segment include magnesium bone graft substitution and calcium sulfate bone void filler. on the basis of form, the market is fragmented into gel & putty, granules, and others. The others segment includes paste, powder, and liquid. Depending on application, the market is differentiated into spine fusion, bone fracture, and others. The others segment includes pelvic surgery and oral surgery. As per end user, the market is categorized into hospitals, specialty clinics, and others. The others include research centers and specialty clinics.

Bone Void Fillers Market

Region wise, the bone void fillers market share is analyzed across North America (the U.S., Canada, and Mexico), Europe (Germany, France, UK, Italy, Spain, and the rest of Europe), Asia-Pacific (Japan, China, Australia, India, South Korea, and the rest of Asia-Pacific), and LAMEA (Brazil, Saudi Arabia, South Africa, and the rest of LAMEA).

Segment Review

On the basis of type, the market is classified into demineralized bone matrix, calcium phosphate bone graft substitute, collagen matrix, and others segment. The demineralized bone matrix segment dominated the market in 2021, and is expected to continue this trend during the forecast period, owing to increase in the use for dental implants and orthopedic surgery . On the other hand, calcium phosphate bone graft substitute segment is expected to witness considerable market growth during the forecast period, owing to increase in the use synthetic substitute such as polymer and ceramic in treatment of bone defects.

Bone Void Fillers Market

Depending on form, the market is segregated into gel & putty, granules, and others segment. The gel & putty segment exhibited the highest growth in 2021, and is  anticipated to lead in the coming future, owing to increase in the number of non-invasive and minimally invasive surgeries. However, the others segment is expected to witness considerable growth during the forecast period, owing to increase in the number of orthopedic surgeries which use bone void fillers material in the form of liquid, paste, sponge and powder.

Bone Void Fillers Market

By application, the market is fragmented into spine fusion, bone fracture, and others segment. The bone fracture was the prominent segment in 2021, and is expected to continue this trend during the forecast period, owing to increase in prevalence of osteoporosis, rise in geriatric population, and surge in cases of sport injuries & accidents. However, the spinal fusion segment is expected to witness considerable growth during the forecast period, owing to increase in the number of spine injury, and rise in number of spinal fusion procedure.

Bone Void Fillers Market

As per end user, the market is differentiated into hospital, specialty clinics, and others. The hospital segment  led the market in 2021, and is expected to continue this trend during the forecast period, owing to increase in initiatives taken by government to develop healthcare infrastructure, and rise in number of hospitals & clinics. On the other hand, specialty clinics segment is expected to witness considerable market growth during the forecast period, owing to rise in the awareness regarding specialty clinics.

North America accounted for a majority of the global bone void fillers market share in 2021, and is anticipated to remain dominant during the forecast period. This is attributed due to higher adoption of synthetic bone void fillers, large presence of bone void fillers industry, availability of well-developed healthcare infrastructure, and wide availability of bone void fillers. However, Asia-Pacific is anticipated to witness lucrative growth in the future, owing to increase in prevalence of orthopedic diseases, rise in awareness about the use of bone void fillers, surge in healthcare expenditure, and increase in geriatric population..

The key players operating in the global bone void fillers market include Arthrex Inc., Baxter Internation, DePuy Synthesis, Medtronic Plc., NuVasive Inc. Orthofix Medical Inc., Smith and Nephew Plc., Stryker Corporation, Wright Medical Group Inc., and Zimmer Biomet.

Key Benefits For Stakeholders

  • This report provides a quantitative analysis of the market segments, current trends, estimations, and dynamics of the bone void fillers market analysis from 2021 to 2031 to identify the prevailing bone void fillers market opportunity.
  • The market research is offered along with information related to key drivers, restraints, and opportunities.
  • Porter's five forces analysis highlights the potency of buyers and suppliers to enable stakeholders make profit-oriented business decisions and strengthen their supplier-buyer network.
  • In-depth analysis of the bone void fillers market segmentation assists to determine the prevailing market opportunities.
  • Major countries in each region are mapped according to their revenue contribution to the global market.
  • Market player positioning facilitates benchmarking and provides a clear understanding of the present position of the market players.
  • The report includes the analysis of the regional as well as global bone void fillers market trends, key players, market segments, application areas, and market growth strategies.

Bone Void Fillers Market Report Highlights

Aspects Details
By Type
  • Demineralized bone matrix
  • Calcium phosphate bone graft substitute
  • Collagen Matrix
  • Others
By Form
  • Gel and Putty
  • Granules
  • Others
By Application
  • Spine fusion
  • Bone fracture
  • Others
By End User
  • Hospital
  • Specialty Clinics
  • Others
By Region
  • North America  (U.S., Canada, Mexico)
  • Europe  (Germany, France, U.K., Italy, Spain, Rest of Europe)
  • Asia-Pacific  (China, Japan, India, Australia, South Korea, Rest of Asia-Pacific)
  • LAMEA  (Brazil, Saudi Arabia, South Africa, Rest of LAMEA)
Key Market Players NuVasive Inc, Zimmer Biomet, depuy synthes companies, Baxter International Inc., Wright Medical Group Inc, Medtronic plc, Arthrex Inc, Stryker Corporation, Orthofix Medical Inc, Smith and Nephew plc
 
  • CHAPTER 1:INTRODUCTION

    • 1.1.Report description

    • 1.2.Key market segments

    • 1.3.Key benefits to the stakeholders

    • 1.4.Research Methodology

      • 1.4.1.Secondary research

      • 1.4.2.Primary research

      • 1.4.3.Analyst tools and models

  • CHAPTER 2:EXECUTIVE SUMMARY

    • 2.1.Key findings of the study

    • 2.2.CXO Perspective

  • CHAPTER 3:MARKET OVERVIEW

    • 3.1.Market definition and scope

    • 3.2.Key findings

      • 3.2.1.Top investment pockets

    • 3.3.Porter’s five forces analysis

    • 3.4.Top player positioning

    • 3.5.Market dynamics

      • 3.5.1.Drivers

      • 3.5.2.Restraints

      • 3.5.3.Opportunities

    • 3.6.COVID-19 Impact Analysis on the market

  • CHAPTER 4: BONE VOID FILLERS MARKET, BY TYPE

    • 4.1 Overview

      • 4.1.1 Market size and forecast

    • 4.2 Demineralized bone matrix

      • 4.2.1 Key market trends, growth factors and opportunities

      • 4.2.2 Market size and forecast, by region

      • 4.2.3 Market analysis by country

    • 4.3 Calcium phosphate bone graft substitute

      • 4.3.1 Key market trends, growth factors and opportunities

      • 4.3.2 Market size and forecast, by region

      • 4.3.3 Market analysis by country

    • 4.4 Collagen Matrix

      • 4.4.1 Key market trends, growth factors and opportunities

      • 4.4.2 Market size and forecast, by region

      • 4.4.3 Market analysis by country

    • 4.5 Others

      • 4.5.1 Key market trends, growth factors and opportunities

      • 4.5.2 Market size and forecast, by region

      • 4.5.3 Market analysis by country

  • CHAPTER 5: BONE VOID FILLERS MARKET, BY FORM

    • 5.1 Overview

      • 5.1.1 Market size and forecast

    • 5.2 Gel and Putty

      • 5.2.1 Key market trends, growth factors and opportunities

      • 5.2.2 Market size and forecast, by region

      • 5.2.3 Market analysis by country

    • 5.3 Granules

      • 5.3.1 Key market trends, growth factors and opportunities

      • 5.3.2 Market size and forecast, by region

      • 5.3.3 Market analysis by country

    • 5.4 Others

      • 5.4.1 Key market trends, growth factors and opportunities

      • 5.4.2 Market size and forecast, by region

      • 5.4.3 Market analysis by country

  • CHAPTER 6: BONE VOID FILLERS MARKET, BY APPLICATION

    • 6.1 Overview

      • 6.1.1 Market size and forecast

    • 6.2 Spine fusion

      • 6.2.1 Key market trends, growth factors and opportunities

      • 6.2.2 Market size and forecast, by region

      • 6.2.3 Market analysis by country

    • 6.3 Bone fracture

      • 6.3.1 Key market trends, growth factors and opportunities

      • 6.3.2 Market size and forecast, by region

      • 6.3.3 Market analysis by country

    • 6.4 Others

      • 6.4.1 Key market trends, growth factors and opportunities

      • 6.4.2 Market size and forecast, by region

      • 6.4.3 Market analysis by country

  • CHAPTER 7: BONE VOID FILLERS MARKET, BY END USER

    • 7.1 Overview

      • 7.1.1 Market size and forecast

    • 7.2 Hospital

      • 7.2.1 Key market trends, growth factors and opportunities

      • 7.2.2 Market size and forecast, by region

      • 7.2.3 Market analysis by country

    • 7.3 Specialty Clinics

      • 7.3.1 Key market trends, growth factors and opportunities

      • 7.3.2 Market size and forecast, by region

      • 7.3.3 Market analysis by country

    • 7.4 Others

      • 7.4.1 Key market trends, growth factors and opportunities

      • 7.4.2 Market size and forecast, by region

      • 7.4.3 Market analysis by country

  • CHAPTER 8: BONE VOID FILLERS MARKET, BY REGION

    • 8.1 Overview

      • 8.1.1 Market size and forecast

    • 8.2 North America

      • 8.2.1 Key trends and opportunities

      • 8.2.2 North America Market size and forecast, by Type

      • 8.2.3 North America Market size and forecast, by Form

      • 8.2.4 North America Market size and forecast, by Application

      • 8.2.5 North America Market size and forecast, by End User

      • 8.2.6 North America Market size and forecast, by country

        • 8.2.6.1 U.S.
          • 8.2.6.1.1 Market size and forecast, by Type
          • 8.2.6.1.2 Market size and forecast, by Form
          • 8.2.6.1.3 Market size and forecast, by Application
          • 8.2.6.1.4 Market size and forecast, by End User
        • 8.2.6.2 Canada
          • 8.2.6.2.1 Market size and forecast, by Type
          • 8.2.6.2.2 Market size and forecast, by Form
          • 8.2.6.2.3 Market size and forecast, by Application
          • 8.2.6.2.4 Market size and forecast, by End User
        • 8.2.6.3 Mexico
          • 8.2.6.3.1 Market size and forecast, by Type
          • 8.2.6.3.2 Market size and forecast, by Form
          • 8.2.6.3.3 Market size and forecast, by Application
          • 8.2.6.3.4 Market size and forecast, by End User
    • 8.3 Europe

      • 8.3.1 Key trends and opportunities

      • 8.3.2 Europe Market size and forecast, by Type

      • 8.3.3 Europe Market size and forecast, by Form

      • 8.3.4 Europe Market size and forecast, by Application

      • 8.3.5 Europe Market size and forecast, by End User

      • 8.3.6 Europe Market size and forecast, by country

        • 8.3.6.1 Germany
          • 8.3.6.1.1 Market size and forecast, by Type
          • 8.3.6.1.2 Market size and forecast, by Form
          • 8.3.6.1.3 Market size and forecast, by Application
          • 8.3.6.1.4 Market size and forecast, by End User
        • 8.3.6.2 France
          • 8.3.6.2.1 Market size and forecast, by Type
          • 8.3.6.2.2 Market size and forecast, by Form
          • 8.3.6.2.3 Market size and forecast, by Application
          • 8.3.6.2.4 Market size and forecast, by End User
        • 8.3.6.3 U.K.
          • 8.3.6.3.1 Market size and forecast, by Type
          • 8.3.6.3.2 Market size and forecast, by Form
          • 8.3.6.3.3 Market size and forecast, by Application
          • 8.3.6.3.4 Market size and forecast, by End User
        • 8.3.6.4 Italy
          • 8.3.6.4.1 Market size and forecast, by Type
          • 8.3.6.4.2 Market size and forecast, by Form
          • 8.3.6.4.3 Market size and forecast, by Application
          • 8.3.6.4.4 Market size and forecast, by End User
        • 8.3.6.5 Spain
          • 8.3.6.5.1 Market size and forecast, by Type
          • 8.3.6.5.2 Market size and forecast, by Form
          • 8.3.6.5.3 Market size and forecast, by Application
          • 8.3.6.5.4 Market size and forecast, by End User
        • 8.3.6.6 Rest of Europe
          • 8.3.6.6.1 Market size and forecast, by Type
          • 8.3.6.6.2 Market size and forecast, by Form
          • 8.3.6.6.3 Market size and forecast, by Application
          • 8.3.6.6.4 Market size and forecast, by End User
    • 8.4 Asia-Pacific

      • 8.4.1 Key trends and opportunities

      • 8.4.2 Asia-Pacific Market size and forecast, by Type

      • 8.4.3 Asia-Pacific Market size and forecast, by Form

      • 8.4.4 Asia-Pacific Market size and forecast, by Application

      • 8.4.5 Asia-Pacific Market size and forecast, by End User

      • 8.4.6 Asia-Pacific Market size and forecast, by country

        • 8.4.6.1 China
          • 8.4.6.1.1 Market size and forecast, by Type
          • 8.4.6.1.2 Market size and forecast, by Form
          • 8.4.6.1.3 Market size and forecast, by Application
          • 8.4.6.1.4 Market size and forecast, by End User
        • 8.4.6.2 Japan
          • 8.4.6.2.1 Market size and forecast, by Type
          • 8.4.6.2.2 Market size and forecast, by Form
          • 8.4.6.2.3 Market size and forecast, by Application
          • 8.4.6.2.4 Market size and forecast, by End User
        • 8.4.6.3 India
          • 8.4.6.3.1 Market size and forecast, by Type
          • 8.4.6.3.2 Market size and forecast, by Form
          • 8.4.6.3.3 Market size and forecast, by Application
          • 8.4.6.3.4 Market size and forecast, by End User
        • 8.4.6.4 Australia
          • 8.4.6.4.1 Market size and forecast, by Type
          • 8.4.6.4.2 Market size and forecast, by Form
          • 8.4.6.4.3 Market size and forecast, by Application
          • 8.4.6.4.4 Market size and forecast, by End User
        • 8.4.6.5 South Korea
          • 8.4.6.5.1 Market size and forecast, by Type
          • 8.4.6.5.2 Market size and forecast, by Form
          • 8.4.6.5.3 Market size and forecast, by Application
          • 8.4.6.5.4 Market size and forecast, by End User
        • 8.4.6.6 Rest of Asia-Pacific
          • 8.4.6.6.1 Market size and forecast, by Type
          • 8.4.6.6.2 Market size and forecast, by Form
          • 8.4.6.6.3 Market size and forecast, by Application
          • 8.4.6.6.4 Market size and forecast, by End User
    • 8.5 LAMEA

      • 8.5.1 Key trends and opportunities

      • 8.5.2 LAMEA Market size and forecast, by Type

      • 8.5.3 LAMEA Market size and forecast, by Form

      • 8.5.4 LAMEA Market size and forecast, by Application

      • 8.5.5 LAMEA Market size and forecast, by End User

      • 8.5.6 LAMEA Market size and forecast, by country

        • 8.5.6.1 Brazil
          • 8.5.6.1.1 Market size and forecast, by Type
          • 8.5.6.1.2 Market size and forecast, by Form
          • 8.5.6.1.3 Market size and forecast, by Application
          • 8.5.6.1.4 Market size and forecast, by End User
        • 8.5.6.2 Saudi Arabia
          • 8.5.6.2.1 Market size and forecast, by Type
          • 8.5.6.2.2 Market size and forecast, by Form
          • 8.5.6.2.3 Market size and forecast, by Application
          • 8.5.6.2.4 Market size and forecast, by End User
        • 8.5.6.3 South Africa
          • 8.5.6.3.1 Market size and forecast, by Type
          • 8.5.6.3.2 Market size and forecast, by Form
          • 8.5.6.3.3 Market size and forecast, by Application
          • 8.5.6.3.4 Market size and forecast, by End User
        • 8.5.6.4 Rest of LAMEA
          • 8.5.6.4.1 Market size and forecast, by Type
          • 8.5.6.4.2 Market size and forecast, by Form
          • 8.5.6.4.3 Market size and forecast, by Application
          • 8.5.6.4.4 Market size and forecast, by End User
  • CHAPTER 9: COMPANY LANDSCAPE

    • 9.1. Introduction

    • 9.2. Top winning strategies

    • 9.3. Product Mapping of Top 10 Player

    • 9.4. Competitive Dashboard

    • 9.5. Competitive Heatmap

    • 9.6. Key developments

  • CHAPTER 10: COMPANY PROFILES

    • 10.1 Arthrex Inc

      • 10.1.1 Company overview

      • 10.1.2 Company snapshot

      • 10.1.3 Operating business segments

      • 10.1.4 Product portfolio

      • 10.1.5 Business performance

      • 10.1.6 Key strategic moves and developments

    • 10.2 Baxter International Inc.

      • 10.2.1 Company overview

      • 10.2.2 Company snapshot

      • 10.2.3 Operating business segments

      • 10.2.4 Product portfolio

      • 10.2.5 Business performance

      • 10.2.6 Key strategic moves and developments

    • 10.3 depuy synthes companies

      • 10.3.1 Company overview

      • 10.3.2 Company snapshot

      • 10.3.3 Operating business segments

      • 10.3.4 Product portfolio

      • 10.3.5 Business performance

      • 10.3.6 Key strategic moves and developments

    • 10.4 Medtronic plc

      • 10.4.1 Company overview

      • 10.4.2 Company snapshot

      • 10.4.3 Operating business segments

      • 10.4.4 Product portfolio

      • 10.4.5 Business performance

      • 10.4.6 Key strategic moves and developments

    • 10.5 NuVasive Inc

      • 10.5.1 Company overview

      • 10.5.2 Company snapshot

      • 10.5.3 Operating business segments

      • 10.5.4 Product portfolio

      • 10.5.5 Business performance

      • 10.5.6 Key strategic moves and developments

    • 10.6 Orthofix Medical Inc

      • 10.6.1 Company overview

      • 10.6.2 Company snapshot

      • 10.6.3 Operating business segments

      • 10.6.4 Product portfolio

      • 10.6.5 Business performance

      • 10.6.6 Key strategic moves and developments

    • 10.7 Smith and Nephew plc

      • 10.7.1 Company overview

      • 10.7.2 Company snapshot

      • 10.7.3 Operating business segments

      • 10.7.4 Product portfolio

      • 10.7.5 Business performance

      • 10.7.6 Key strategic moves and developments

    • 10.8 Stryker Corporation

      • 10.8.1 Company overview

      • 10.8.2 Company snapshot

      • 10.8.3 Operating business segments

      • 10.8.4 Product portfolio

      • 10.8.5 Business performance

      • 10.8.6 Key strategic moves and developments

    • 10.9 Wright Medical Group Inc

      • 10.9.1 Company overview

      • 10.9.2 Company snapshot

      • 10.9.3 Operating business segments

      • 10.9.4 Product portfolio

      • 10.9.5 Business performance

      • 10.9.6 Key strategic moves and developments

    • 10.10 Zimmer Biomet

      • 10.10.1 Company overview

      • 10.10.2 Company snapshot

      • 10.10.3 Operating business segments

      • 10.10.4 Product portfolio

      • 10.10.5 Business performance

      • 10.10.6 Key strategic moves and developments

  • LIST OF TABLES

  • TABLE 1. GLOBAL BONE VOID FILLERS MARKET, BY TYPE, 2021-2031,($MILLION)
    TABLE 2. BONE VOID FILLERS MARKET REVENUE, FOR DEMINERALIZED BONE MATRIX, BY REGION , 2021-2031,($MILLION)
    TABLE 3. BONE VOID FILLERS MARKET FOR DEMINERALIZED BONE MATRIX BY COUNTRY, 2021-2031,($MILLION)
    TABLE 4. BONE VOID FILLERS MARKET REVENUE, FOR CALCIUM PHOSPHATE BONE GRAFT SUBSTITUTE, BY REGION , 2021-2031,($MILLION)
    TABLE 5. BONE VOID FILLERS MARKET FOR CALCIUM PHOSPHATE BONE GRAFT SUBSTITUTE BY COUNTRY, 2021-2031,($MILLION)
    TABLE 6. BONE VOID FILLERS MARKET REVENUE, FOR COLLAGEN MATRIX, BY REGION , 2021-2031,($MILLION)
    TABLE 7. BONE VOID FILLERS MARKET FOR COLLAGEN MATRIX BY COUNTRY, 2021-2031,($MILLION)
    TABLE 8. BONE VOID FILLERS MARKET REVENUE, FOR OTHERS, BY REGION , 2021-2031,($MILLION)
    TABLE 9. BONE VOID FILLERS MARKET FOR OTHERS BY COUNTRY, 2021-2031,($MILLION)
    TABLE 10. GLOBAL BONE VOID FILLERS MARKET, BY FORM, 2021-2031,($MILLION)
    TABLE 11. BONE VOID FILLERS MARKET REVENUE, FOR GEL AND PUTTY, BY REGION , 2021-2031,($MILLION)
    TABLE 12. BONE VOID FILLERS MARKET FOR GEL AND PUTTY BY COUNTRY, 2021-2031,($MILLION)
    TABLE 13. BONE VOID FILLERS MARKET REVENUE, FOR GRANULES, BY REGION , 2021-2031,($MILLION)
    TABLE 14. BONE VOID FILLERS MARKET FOR GRANULES BY COUNTRY, 2021-2031,($MILLION)
    TABLE 15. BONE VOID FILLERS MARKET REVENUE, FOR OTHERS, BY REGION , 2021-2031,($MILLION)
    TABLE 16. BONE VOID FILLERS MARKET FOR OTHERS BY COUNTRY, 2021-2031,($MILLION)
    TABLE 17. GLOBAL BONE VOID FILLERS MARKET, BY APPLICATION, 2021-2031,($MILLION)
    TABLE 18. BONE VOID FILLERS MARKET REVENUE, FOR SPINE FUSION, BY REGION , 2021-2031,($MILLION)
    TABLE 19. BONE VOID FILLERS MARKET FOR SPINE FUSION BY COUNTRY, 2021-2031,($MILLION)
    TABLE 20. BONE VOID FILLERS MARKET REVENUE, FOR BONE FRACTURE, BY REGION , 2021-2031,($MILLION)
    TABLE 21. BONE VOID FILLERS MARKET FOR BONE FRACTURE BY COUNTRY, 2021-2031,($MILLION)
    TABLE 22. BONE VOID FILLERS MARKET REVENUE, FOR OTHERS, BY REGION , 2021-2031,($MILLION)
    TABLE 23. BONE VOID FILLERS MARKET FOR OTHERS BY COUNTRY, 2021-2031,($MILLION)
    TABLE 24. GLOBAL BONE VOID FILLERS MARKET, BY END USER, 2021-2031,($MILLION)
    TABLE 25. BONE VOID FILLERS MARKET REVENUE, FOR HOSPITAL, BY REGION , 2021-2031,($MILLION)
    TABLE 26. BONE VOID FILLERS MARKET FOR HOSPITAL BY COUNTRY, 2021-2031,($MILLION)
    TABLE 27. BONE VOID FILLERS MARKET REVENUE, FOR SPECIALTY CLINICS, BY REGION , 2021-2031,($MILLION)
    TABLE 28. BONE VOID FILLERS MARKET FOR SPECIALTY CLINICS BY COUNTRY, 2021-2031,($MILLION)
    TABLE 29. BONE VOID FILLERS MARKET REVENUE, FOR OTHERS, BY REGION , 2021-2031,($MILLION)
    TABLE 30. BONE VOID FILLERS MARKET FOR OTHERS BY COUNTRY, 2021-2031,($MILLION)
    TABLE 31. BONE VOID FILLERS MARKET, BY REGION, 2021-2031,($MILLION)
    TABLE 32. NORTH AMERICA BONE VOID FILLERS MARKET, BY TYPE, 2021-2031,($MILLION)
    TABLE 33. NORTH AMERICA BONE VOID FILLERS MARKET, BY FORM, 2021-2031,($MILLION)
    TABLE 34. NORTH AMERICA BONE VOID FILLERS MARKET, BY APPLICATION, 2021-2031,($MILLION)
    TABLE 35. NORTH AMERICA BONE VOID FILLERS MARKET, BY END USER, 2021-2031,($MILLION)
    TABLE 36. NORTH AMERICA BONE VOID FILLERS MARKET, BY COUNTRY, 2021-2031,($MILLION)
    TABLE 37. U.S. BONE VOID FILLERS MARKET, BY TYPE, 2021-2031,($MILLION)
    TABLE 38. U.S. BONE VOID FILLERS MARKET, BY FORM, 2021-2031,($MILLION)
    TABLE 39. U.S. BONE VOID FILLERS MARKET, BY APPLICATION, 2021-2031,($MILLION)
    TABLE 40. U.S. BONE VOID FILLERS MARKET, BY END USER, 2021-2031,($MILLION)
    TABLE 41. CANADA BONE VOID FILLERS MARKET, BY TYPE, 2021-2031,($MILLION)
    TABLE 42. CANADA BONE VOID FILLERS MARKET, BY FORM, 2021-2031,($MILLION)
    TABLE 43. CANADA BONE VOID FILLERS MARKET, BY APPLICATION, 2021-2031,($MILLION)
    TABLE 44. CANADA BONE VOID FILLERS MARKET, BY END USER, 2021-2031,($MILLION)
    TABLE 45. MEXICO BONE VOID FILLERS MARKET, BY TYPE, 2021-2031,($MILLION)
    TABLE 46. MEXICO BONE VOID FILLERS MARKET, BY FORM, 2021-2031,($MILLION)
    TABLE 47. MEXICO BONE VOID FILLERS MARKET, BY APPLICATION, 2021-2031,($MILLION)
    TABLE 48. MEXICO BONE VOID FILLERS MARKET, BY END USER, 2021-2031,($MILLION)
    TABLE 49. EUROPE BONE VOID FILLERS MARKET, BY TYPE, 2021-2031,($MILLION)
    TABLE 50. EUROPE BONE VOID FILLERS MARKET, BY FORM, 2021-2031,($MILLION)
    TABLE 51. EUROPE BONE VOID FILLERS MARKET, BY APPLICATION, 2021-2031,($MILLION)
    TABLE 52. EUROPE BONE VOID FILLERS MARKET, BY END USER, 2021-2031,($MILLION)
    TABLE 53. EUROPE BONE VOID FILLERS MARKET, BY COUNTRY, 2021-2031,($MILLION)
    TABLE 54. GERMANY BONE VOID FILLERS MARKET, BY TYPE, 2021-2031,($MILLION)
    TABLE 55. GERMANY BONE VOID FILLERS MARKET, BY FORM, 2021-2031,($MILLION)
    TABLE 56. GERMANY BONE VOID FILLERS MARKET, BY APPLICATION, 2021-2031,($MILLION)
    TABLE 57. GERMANY BONE VOID FILLERS MARKET, BY END USER, 2021-2031,($MILLION)
    TABLE 58. FRANCE BONE VOID FILLERS MARKET, BY TYPE, 2021-2031,($MILLION)
    TABLE 59. FRANCE BONE VOID FILLERS MARKET, BY FORM, 2021-2031,($MILLION)
    TABLE 60. FRANCE BONE VOID FILLERS MARKET, BY APPLICATION, 2021-2031,($MILLION)
    TABLE 61. FRANCE BONE VOID FILLERS MARKET, BY END USER, 2021-2031,($MILLION)
    TABLE 62. U.K. BONE VOID FILLERS MARKET, BY TYPE, 2021-2031,($MILLION)
    TABLE 63. U.K. BONE VOID FILLERS MARKET, BY FORM, 2021-2031,($MILLION)
    TABLE 64. U.K. BONE VOID FILLERS MARKET, BY APPLICATION, 2021-2031,($MILLION)
    TABLE 65. U.K. BONE VOID FILLERS MARKET, BY END USER, 2021-2031,($MILLION)
    TABLE 66. ITALY BONE VOID FILLERS MARKET, BY TYPE, 2021-2031,($MILLION)
    TABLE 67. ITALY BONE VOID FILLERS MARKET, BY FORM, 2021-2031,($MILLION)
    TABLE 68. ITALY BONE VOID FILLERS MARKET, BY APPLICATION, 2021-2031,($MILLION)
    TABLE 69. ITALY BONE VOID FILLERS MARKET, BY END USER, 2021-2031,($MILLION)
    TABLE 70. SPAIN BONE VOID FILLERS MARKET, BY TYPE, 2021-2031,($MILLION)
    TABLE 71. SPAIN BONE VOID FILLERS MARKET, BY FORM, 2021-2031,($MILLION)
    TABLE 72. SPAIN BONE VOID FILLERS MARKET, BY APPLICATION, 2021-2031,($MILLION)
    TABLE 73. SPAIN BONE VOID FILLERS MARKET, BY END USER, 2021-2031,($MILLION)
    TABLE 74. REST OF EUROPE BONE VOID FILLERS MARKET, BY TYPE, 2021-2031,($MILLION)
    TABLE 75. REST OF EUROPE BONE VOID FILLERS MARKET, BY FORM, 2021-2031,($MILLION)
    TABLE 76. REST OF EUROPE BONE VOID FILLERS MARKET, BY APPLICATION, 2021-2031,($MILLION)
    TABLE 77. REST OF EUROPE BONE VOID FILLERS MARKET, BY END USER, 2021-2031,($MILLION)
    TABLE 78. ASIA-PACIFIC BONE VOID FILLERS MARKET, BY TYPE, 2021-2031,($MILLION)
    TABLE 79. ASIA-PACIFIC BONE VOID FILLERS MARKET, BY FORM, 2021-2031,($MILLION)
    TABLE 80. ASIA-PACIFIC BONE VOID FILLERS MARKET, BY APPLICATION, 2021-2031,($MILLION)
    TABLE 81. ASIA-PACIFIC BONE VOID FILLERS MARKET, BY END USER, 2021-2031,($MILLION)
    TABLE 82. ASIA-PACIFIC BONE VOID FILLERS MARKET, BY COUNTRY, 2021-2031,($MILLION)
    TABLE 83. CHINA BONE VOID FILLERS MARKET, BY TYPE, 2021-2031,($MILLION)
    TABLE 84. CHINA BONE VOID FILLERS MARKET, BY FORM, 2021-2031,($MILLION)
    TABLE 85. CHINA BONE VOID FILLERS MARKET, BY APPLICATION, 2021-2031,($MILLION)
    TABLE 86. CHINA BONE VOID FILLERS MARKET, BY END USER, 2021-2031,($MILLION)
    TABLE 87. JAPAN BONE VOID FILLERS MARKET, BY TYPE, 2021-2031,($MILLION)
    TABLE 88. JAPAN BONE VOID FILLERS MARKET, BY FORM, 2021-2031,($MILLION)
    TABLE 89. JAPAN BONE VOID FILLERS MARKET, BY APPLICATION, 2021-2031,($MILLION)
    TABLE 90. JAPAN BONE VOID FILLERS MARKET, BY END USER, 2021-2031,($MILLION)
    TABLE 91. INDIA BONE VOID FILLERS MARKET, BY TYPE, 2021-2031,($MILLION)
    TABLE 92. INDIA BONE VOID FILLERS MARKET, BY FORM, 2021-2031,($MILLION)
    TABLE 93. INDIA BONE VOID FILLERS MARKET, BY APPLICATION, 2021-2031,($MILLION)
    TABLE 94. INDIA BONE VOID FILLERS MARKET, BY END USER, 2021-2031,($MILLION)
    TABLE 95. AUSTRALIA BONE VOID FILLERS MARKET, BY TYPE, 2021-2031,($MILLION)
    TABLE 96. AUSTRALIA BONE VOID FILLERS MARKET, BY FORM, 2021-2031,($MILLION)
    TABLE 97. AUSTRALIA BONE VOID FILLERS MARKET, BY APPLICATION, 2021-2031,($MILLION)
    TABLE 98. AUSTRALIA BONE VOID FILLERS MARKET, BY END USER, 2021-2031,($MILLION)
    TABLE 99. SOUTH KOREA BONE VOID FILLERS MARKET, BY TYPE, 2021-2031,($MILLION)
    TABLE 100. SOUTH KOREA BONE VOID FILLERS MARKET, BY FORM, 2021-2031,($MILLION)
    TABLE 101. SOUTH KOREA BONE VOID FILLERS MARKET, BY APPLICATION, 2021-2031,($MILLION)
    TABLE 102. SOUTH KOREA BONE VOID FILLERS MARKET, BY END USER, 2021-2031,($MILLION)
    TABLE 103. REST OF ASIA-PACIFIC BONE VOID FILLERS MARKET, BY TYPE, 2021-2031,($MILLION)
    TABLE 104. REST OF ASIA-PACIFIC BONE VOID FILLERS MARKET, BY FORM, 2021-2031,($MILLION)
    TABLE 105. REST OF ASIA-PACIFIC BONE VOID FILLERS MARKET, BY APPLICATION, 2021-2031,($MILLION)
    TABLE 106. REST OF ASIA-PACIFIC BONE VOID FILLERS MARKET, BY END USER, 2021-2031,($MILLION)
    TABLE 107. LAMEA BONE VOID FILLERS MARKET, BY TYPE, 2021-2031,($MILLION)
    TABLE 108. LAMEA BONE VOID FILLERS MARKET, BY FORM, 2021-2031,($MILLION)
    TABLE 109. LAMEA BONE VOID FILLERS MARKET, BY APPLICATION, 2021-2031,($MILLION)
    TABLE 110. LAMEA BONE VOID FILLERS MARKET, BY END USER, 2021-2031,($MILLION)
    TABLE 111. LAMEA BONE VOID FILLERS MARKET, BY COUNTRY, 2021-2031,($MILLION)
    TABLE 112. BRAZIL BONE VOID FILLERS MARKET, BY TYPE, 2021-2031,($MILLION)
    TABLE 113. BRAZIL BONE VOID FILLERS MARKET, BY FORM, 2021-2031,($MILLION)
    TABLE 114. BRAZIL BONE VOID FILLERS MARKET, BY APPLICATION, 2021-2031,($MILLION)
    TABLE 115. BRAZIL BONE VOID FILLERS MARKET, BY END USER, 2021-2031,($MILLION)
    TABLE 116. SAUDI ARABIA BONE VOID FILLERS MARKET, BY TYPE, 2021-2031,($MILLION)
    TABLE 117. SAUDI ARABIA BONE VOID FILLERS MARKET, BY FORM, 2021-2031,($MILLION)
    TABLE 118. SAUDI ARABIA BONE VOID FILLERS MARKET, BY APPLICATION, 2021-2031,($MILLION)
    TABLE 119. SAUDI ARABIA BONE VOID FILLERS MARKET, BY END USER, 2021-2031,($MILLION)
    TABLE 120. SOUTH AFRICA BONE VOID FILLERS MARKET, BY TYPE, 2021-2031,($MILLION)
    TABLE 121. SOUTH AFRICA BONE VOID FILLERS MARKET, BY FORM, 2021-2031,($MILLION)
    TABLE 122. SOUTH AFRICA BONE VOID FILLERS MARKET, BY APPLICATION, 2021-2031,($MILLION)
    TABLE 123. SOUTH AFRICA BONE VOID FILLERS MARKET, BY END USER, 2021-2031,($MILLION)
    TABLE 124. REST OF LAMEA BONE VOID FILLERS MARKET, BY TYPE, 2021-2031,($MILLION)
    TABLE 125. REST OF LAMEA BONE VOID FILLERS MARKET, BY FORM, 2021-2031,($MILLION)
    TABLE 126. REST OF LAMEA BONE VOID FILLERS MARKET, BY APPLICATION, 2021-2031,($MILLION)
    TABLE 127. REST OF LAMEA BONE VOID FILLERS MARKET, BY END USER, 2021-2031,($MILLION)
    TABLE 128.ARTHREX INC: COMPANY SNAPSHOT
    TABLE 129.ARTHREX INC: OPERATING SEGMENTS
    TABLE 130.ARTHREX INC: PRODUCT PORTFOLIO
    TABLE 131.ARTHREX INC: NET SALES,
    TABLE 132.ARTHREX INC: KEY STRATERGIES
    TABLE 133.BAXTER INTERNATIONAL INC.: COMPANY SNAPSHOT
    TABLE 134.BAXTER INTERNATIONAL INC.: OPERATING SEGMENTS
    TABLE 135.BAXTER INTERNATIONAL INC.: PRODUCT PORTFOLIO
    TABLE 136.BAXTER INTERNATIONAL INC.: NET SALES,
    TABLE 137.BAXTER INTERNATIONAL INC.: KEY STRATERGIES
    TABLE 138.DEPUY SYNTHES COMPANIES: COMPANY SNAPSHOT
    TABLE 139.DEPUY SYNTHES COMPANIES: OPERATING SEGMENTS
    TABLE 140.DEPUY SYNTHES COMPANIES: PRODUCT PORTFOLIO
    TABLE 141.DEPUY SYNTHES COMPANIES: NET SALES,
    TABLE 142.DEPUY SYNTHES COMPANIES: KEY STRATERGIES
    TABLE 143.MEDTRONIC PLC: COMPANY SNAPSHOT
    TABLE 144.MEDTRONIC PLC: OPERATING SEGMENTS
    TABLE 145.MEDTRONIC PLC: PRODUCT PORTFOLIO
    TABLE 146.MEDTRONIC PLC: NET SALES,
    TABLE 147.MEDTRONIC PLC: KEY STRATERGIES
    TABLE 148.NUVASIVE INC: COMPANY SNAPSHOT
    TABLE 149.NUVASIVE INC: OPERATING SEGMENTS
    TABLE 150.NUVASIVE INC: PRODUCT PORTFOLIO
    TABLE 151.NUVASIVE INC: NET SALES,
    TABLE 152.NUVASIVE INC: KEY STRATERGIES
    TABLE 153.ORTHOFIX MEDICAL INC: COMPANY SNAPSHOT
    TABLE 154.ORTHOFIX MEDICAL INC: OPERATING SEGMENTS
    TABLE 155.ORTHOFIX MEDICAL INC: PRODUCT PORTFOLIO
    TABLE 156.ORTHOFIX MEDICAL INC: NET SALES,
    TABLE 157.ORTHOFIX MEDICAL INC: KEY STRATERGIES
    TABLE 158.SMITH AND NEPHEW PLC: COMPANY SNAPSHOT
    TABLE 159.SMITH AND NEPHEW PLC: OPERATING SEGMENTS
    TABLE 160.SMITH AND NEPHEW PLC: PRODUCT PORTFOLIO
    TABLE 161.SMITH AND NEPHEW PLC: NET SALES,
    TABLE 162.SMITH AND NEPHEW PLC: KEY STRATERGIES
    TABLE 163.STRYKER CORPORATION: COMPANY SNAPSHOT
    TABLE 164.STRYKER CORPORATION: OPERATING SEGMENTS
    TABLE 165.STRYKER CORPORATION: PRODUCT PORTFOLIO
    TABLE 166.STRYKER CORPORATION: NET SALES,
    TABLE 167.STRYKER CORPORATION: KEY STRATERGIES
    TABLE 168.WRIGHT MEDICAL GROUP INC: COMPANY SNAPSHOT
    TABLE 169.WRIGHT MEDICAL GROUP INC: OPERATING SEGMENTS
    TABLE 170.WRIGHT MEDICAL GROUP INC: PRODUCT PORTFOLIO
    TABLE 171.WRIGHT MEDICAL GROUP INC: NET SALES,
    TABLE 172.WRIGHT MEDICAL GROUP INC: KEY STRATERGIES
    TABLE 173.ZIMMER BIOMET: COMPANY SNAPSHOT
    TABLE 174.ZIMMER BIOMET: OPERATING SEGMENTS
    TABLE 175.ZIMMER BIOMET: PRODUCT PORTFOLIO
    TABLE 176.ZIMMER BIOMET: NET SALES,
    TABLE 177.ZIMMER BIOMET: KEY STRATERGIES
  • LIST OF FIGURES

  • FIGURE 1.BONE VOID FILLERS MARKET SEGMENTATION
    FIGURE 2.BONE VOID FILLERS MARKET,2021-2031
    FIGURE 3.BONE VOID FILLERS MARKET,2021-2031
    FIGURE 4. TOP INVESTMENT POCKETS, BY REGION
    FIGURE 5.PORTER FIVE-1
    FIGURE 6.PORTER FIVE-2
    FIGURE 7.PORTER FIVE-3
    FIGURE 8.PORTER FIVE-4
    FIGURE 9.PORTER FIVE-5
    FIGURE 10.TOP PLAYER POSITIONING
    FIGURE 11.BONE VOID FILLERS MARKET:DRIVERS, RESTRAINTS AND OPPORTUNITIES
    FIGURE 12.BONE VOID FILLERS MARKET,BY TYPE,2021(%)
    FIGURE 13.COMPARATIVE SHARE ANALYSIS OF DEMINERALIZED BONE MATRIX BONE VOID FILLERS MARKET,2021-2031(%)
    FIGURE 14.COMPARATIVE SHARE ANALYSIS OF CALCIUM PHOSPHATE BONE GRAFT SUBSTITUTE BONE VOID FILLERS MARKET,2021-2031(%)
    FIGURE 15.COMPARATIVE SHARE ANALYSIS OF COLLAGEN MATRIX BONE VOID FILLERS MARKET,2021-2031(%)
    FIGURE 16.COMPARATIVE SHARE ANALYSIS OF OTHERS BONE VOID FILLERS MARKET,2021-2031(%)
    FIGURE 17.BONE VOID FILLERS MARKET,BY FORM,2021(%)
    FIGURE 18.COMPARATIVE SHARE ANALYSIS OF GEL AND PUTTY BONE VOID FILLERS MARKET,2021-2031(%)
    FIGURE 19.COMPARATIVE SHARE ANALYSIS OF GRANULES BONE VOID FILLERS MARKET,2021-2031(%)
    FIGURE 20.COMPARATIVE SHARE ANALYSIS OF OTHERS BONE VOID FILLERS MARKET,2021-2031(%)
    FIGURE 21.BONE VOID FILLERS MARKET,BY APPLICATION,2021(%)
    FIGURE 22.COMPARATIVE SHARE ANALYSIS OF SPINE FUSION BONE VOID FILLERS MARKET,2021-2031(%)
    FIGURE 23.COMPARATIVE SHARE ANALYSIS OF BONE FRACTURE BONE VOID FILLERS MARKET,2021-2031(%)
    FIGURE 24.COMPARATIVE SHARE ANALYSIS OF OTHERS BONE VOID FILLERS MARKET,2021-2031(%)
    FIGURE 25.BONE VOID FILLERS MARKET,BY END USER,2021(%)
    FIGURE 26.COMPARATIVE SHARE ANALYSIS OF HOSPITAL BONE VOID FILLERS MARKET,2021-2031(%)
    FIGURE 27.COMPARATIVE SHARE ANALYSIS OF SPECIALTY CLINICS BONE VOID FILLERS MARKET,2021-2031(%)
    FIGURE 28.COMPARATIVE SHARE ANALYSIS OF OTHERS BONE VOID FILLERS MARKET,2021-2031(%)
    FIGURE 29.BONE VOID FILLERS MARKET BY REGION,2021
    FIGURE 30.U.S. BONE VOID FILLERS MARKET,2021-2031($MILLION)
    FIGURE 31.CANADA BONE VOID FILLERS MARKET,2021-2031($MILLION)
    FIGURE 32.MEXICO BONE VOID FILLERS MARKET,2021-2031($MILLION)
    FIGURE 33.GERMANY BONE VOID FILLERS MARKET,2021-2031($MILLION)
    FIGURE 34.FRANCE BONE VOID FILLERS MARKET,2021-2031($MILLION)
    FIGURE 35.U.K. BONE VOID FILLERS MARKET,2021-2031($MILLION)
    FIGURE 36.ITALY BONE VOID FILLERS MARKET,2021-2031($MILLION)
    FIGURE 37.SPAIN BONE VOID FILLERS MARKET,2021-2031($MILLION)
    FIGURE 38.REST OF EUROPE BONE VOID FILLERS MARKET,2021-2031($MILLION)
    FIGURE 39.CHINA BONE VOID FILLERS MARKET,2021-2031($MILLION)
    FIGURE 40.JAPAN BONE VOID FILLERS MARKET,2021-2031($MILLION)
    FIGURE 41.INDIA BONE VOID FILLERS MARKET,2021-2031($MILLION)
    FIGURE 42.AUSTRALIA BONE VOID FILLERS MARKET,2021-2031($MILLION)
    FIGURE 43.SOUTH KOREA BONE VOID FILLERS MARKET,2021-2031($MILLION)
    FIGURE 44.REST OF ASIA-PACIFIC BONE VOID FILLERS MARKET,2021-2031($MILLION)
    FIGURE 45.BRAZIL BONE VOID FILLERS MARKET,2021-2031($MILLION)
    FIGURE 46.SAUDI ARABIA BONE VOID FILLERS MARKET,2021-2031($MILLION)
    FIGURE 47.SOUTH AFRICA BONE VOID FILLERS MARKET,2021-2031($MILLION)
    FIGURE 48.REST OF LAMEA BONE VOID FILLERS MARKET,2021-2031($MILLION)
    FIGURE 49. TOP WINNING STRATEGIES, BY YEAR
    FIGURE 50. TOP WINNING STRATEGIES, BY DEVELOPMENT
    FIGURE 51. TOP WINNING STRATEGIES, BY COMPANY
    FIGURE 52.PRODUCT MAPPING OF TOP 10 PLAYERS
    FIGURE 53.COMPETITIVE DASHBOARD
    FIGURE 54.COMPETITIVE HEATMAP OF TOP 10 KEY PLAYERS
    FIGURE 55.ARTHREX INC.: NET SALES ,($MILLION)
    FIGURE 56.BAXTER INTERNATIONAL INC..: NET SALES ,($MILLION)
    FIGURE 57.DEPUY SYNTHES COMPANIES.: NET SALES ,($MILLION)
    FIGURE 58.MEDTRONIC PLC.: NET SALES ,($MILLION)
    FIGURE 59.NUVASIVE INC.: NET SALES ,($MILLION)
    FIGURE 60.ORTHOFIX MEDICAL INC.: NET SALES ,($MILLION)
    FIGURE 61.SMITH AND NEPHEW PLC.: NET SALES ,($MILLION)
    FIGURE 62.STRYKER CORPORATION.: NET SALES ,($MILLION)
    FIGURE 63.WRIGHT MEDICAL GROUP INC.: NET SALES ,($MILLION)
    FIGURE 64.ZIMMER BIOMET.: NET SALES ,($MILLION)


This section provides the insights of the top-level CXOs operating in the bone void fillers market. Bone void fillers are gaining high traction in the market, due to numerous product launches. For instance, in February 2019, Medtronic PLC, a medical device company, announced the launch of demineralized bone matrix (DBM), which is a bone void filler used in spine and orthopedic surgeries. Moreover, in January 2022, NuVasive Inc., a medical device company, announced approval from U.S Food and Drug Administration (FDA) for the product Attrax putty, which is a synthetic, bioactive, and osteoconductive bone void filler used in interbody fusions of the thoracolumbar spine. Furthermore, in July 2020, Baxter international, a medical equipment manufacturing company, announced the FDA clearance of Altrapore Shape bioactive bone graft, which is designed to enhance bone growth and help to achieve fusion. Thus, increase in the number of product approval fuels the growth of bone void fillers market.  

PURCHASE OPTIONS

Call or Email us

U.S.-Canada Toll-free: +1-800-792-5285
Int'l : +1-503-894-6022
Europe : +44-845-528-1300
Email : help@alliedmarketresearch.com
 
FREQUENTLY ASKED QUESTIONS?

A. The total market value of bone void filler market is $3,228.4 million in 2021.

A. The forecast period in the report is from 2022 to 2031

A. The market value of bone void filler Market in 2022 was $3,510.9 million

A. Yes, bone void filler companies are profiled in the report

A. The top companies that hold the market share in bone void filler market are Arthrex Inc., Baxter Internation, DePuy Synthesis, Medtronic Plc., NuVasive Inc. Orthofix Medical Inc., Smith and Nephew Plc., Stryker Corporation, Wright Medical Group Inc., and Zimmer Biomet

A. Asia-Pacific is expected to register highest CAGR of 9.9% from 2022 to 2031, owing to increase in prevalence of orthopedic diseases, rise in awareness about the use of bone void fillers, surge in healthcare expenditure, and increase in geriatric population.

A. The key trends in the bone void filler market are increase in prevalence of orthopedic diseases such as osteoarthritis, osteoporosis, scoliosis, bone tumor, and bone infection; increase in R&D activities for bone void fillers; rise in funding from private & government organizations for development of the healthcare sector and research centers; and surge in geriatric population

Looking for Customization?

 Customization Request

Have a Question?

 Speak with Analyst

Any Confusion?

 Inquire Before Buying

Have a glance of the Report

  Request Sample
RELATED TAGS

Purchase Full Report of
Bone Void Fillers Market

Start reading instantly.
This Report and over 66,905+ more Reports, Available with Avenue Library. T&C*.

  • Online Only
  • $3,456
  • Online cloud access only
  • Restricted print, copy, paste & download
  • Read only
  • Free industry update
    (Within 180 days)
  • Free report update in next update cycle
    (Jun 2023 - Jun 2024)
  • Data Pack
  • $3,840
  • Restricted to one authorized user
  • One print only
  • Available in
    Excel
  • Free industry update
    (Within 180 days)
  •   Free report update in next update cycle
    (Jun 2023 - Jun 2024)
  • Single User
  • $5,769
  • Restricted to one authorized user
  • One print only
  • Available in
    PDF
  • Free industry update
    (Within 180 days)
  •   Free report update in next update cycle
    (Jun 2023 - Jun 2024)
  • Five Users
  • $6,450
  • Limited to five authorized users
  • Print upto five copies
  • Available in
    PDF
  • Free industry update
    (Within 180 days)
  •   Free report update in next update cycle
    (Jun 2023 - Jun 2024)
  • Enterprise
    License/PDF

  • $10,995
  • Unlimited
    within
    company/enterprise
  • Available in Excel & PDF
  • Free industry update
    (Within 180 days)
  •   Free report update in next update cycle
    (Jun 2023 - Jun 2024)
  • Library
    Membership

  • $999 $ 1,175
    Per User/ Per month/ Billed annually
  • Published Content
    E-access
  • Company Profiles
    E-access
  • Newly Added Content Access
  • 10 PDF
    Downloads
  • 5 Excel Data
    Pack Downloads
  • 250 Company Profiles PDF Downloads
  • Buy Now

*Taxes/Fees, if applicable will be added during checkout. All prices in USD

RELATED REPORTS
 

Why Allied Market Research?


Infallible Methodology

To ensure high-level data integrity, accurate analysis, and impeccable forecasts

Analyst Support

For complete satisfaction

Customization

On-demand customization of scope of the report to exactly meet your needs

TARGETED MARKET VIEW

Targeted market view to provide pertinent information and save time of readers

Get fresh content delivered

Get insights on topics that are crucial for your business. Stay abreast of your interest areas.

Get Industry Data Alerts

Why Allied Market Research?

Infallible Methodology

To ensure high-level data integrity, accurate analysis, and impeccable forecasts

Analyst Support

For complete satisfaction

Customization

On-demand customization of scope of the report to exactly meet your needs

TARGETED MARKET VIEW

Targeted market view to provide pertinent information and save time of readers