0
2022
Breast Biopsy Market

Breast Biopsy Market

by Product (Vacuum Assisted Biopsy, Core Needle Biopsy, Fine Needle Aspiration Biopsy), by Image Guided Technology (Mri Guided Breast Biopsy, Ultrasound Guided Breast Biopsy, Mammography Guided Stereotactic Biopsy, Ct Guided Biopsy, Other Image Guided Breast Biopsy), by End User (Hospitals And Clinics, Diagnostic Centers): Global Opportunity Analysis and Industry Forecast, 2020-2030

✷  Report Code: A00912
Mar 2022 | Pages: 170
Tables: 148
Charts: 59
  • Formats*:

  • pdf

    Single User License, Five User
    License & Enterprise User License

  • xls

    Data Pack Excel License

  • ppt

    It comes with the additional cost
    of $2500.00 contact sales.


Breast Biopsy Market Research, 2030

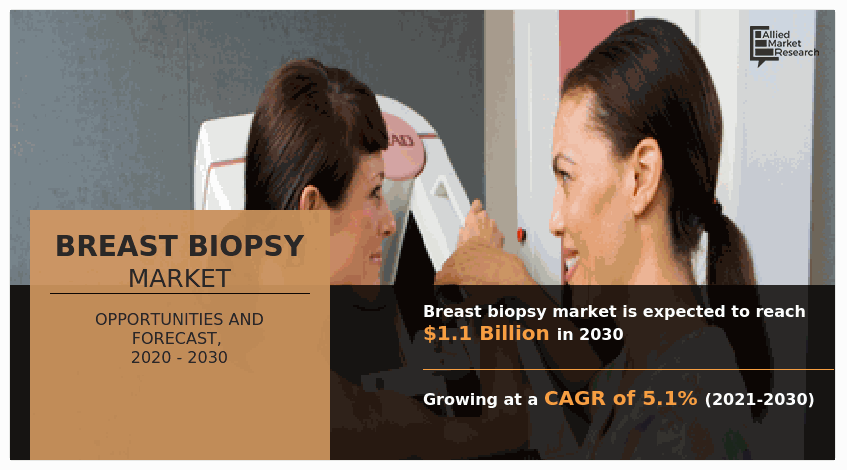
The global breast biopsy market was valued at $658.17 million in 2020, and is projected to reach $1,082.44 million by 2030, growing at a CAGR of 5.1% from 2021 to 2030.Breast biopsies are most typically used to diagnose breast cancer, although they can also be used to check for other diseases that are discovered through a physical examination. The Breast Biopsy market may be segmented using a variety of approaches.Breast biopsies are commonly done with fine needle aspiration biopsy, which is one of the least invasive procedures available and leaves no scarring. A needle is introduced through the dermal tissue of the breast to remove tissue. The other method involves using ultrasound radiation to guide the biopsy, which is also known as stereotactic needle biopsy in conjunction with a mammogram. During this treatment, the ultrasound monitor guides the needle to the target spot in the breast. Stereotactic mammography uses images acquired from various angles to pinpoint the site of the breast tumor, as well as where the needle will be put to get a breast biopsy sample.

Breast biopsy is a diagnostic process that is used to see if a small sample of breast tissue removed is malignant or not. It is thought to be one of the most effective ways for cancer detection. About 70-80 percent of biopsies are determined to be cancer-free, although they may reveal characteristics that predispose to mammary carcinoma. When a person experiences symptoms such as a breast lump, sore breast, breast dimpling, peeling of the breast, and nipple discharge, a breast biopsy is indicated. Invasive surgical procedures for breast biopsy have been found to be ineffective since they are uncomfortable and subject the patient to the psychological burden of false positive referrals.

The impact of COVID-19 on the breast biopsy market was fairly negative in the starting of 2021 due to worldwide lockdowns which lead to drop in number of breast cancer checkups.

The World Health Organization (WHO) on January 30, 2020 declared COVID-19 flare-up a general wellbeing crisis of international concern. Coronavirus has impacted around 210 countries across the globe. Owing to the COVID-19 pandemic, state run administrations across the globe declared inescapable lockdowns as well as friendly distancing measures to forestall breakdown of the healthcare structure. States have additionally given constraints and preventions on undertaking and elective surgeries. These obstructions continue to influence the growth of different industries, and the quick effect of the episode changes starting with one industry then onto the following. The scattering, production, and store network have been impacted due to lockdowns across the globe.

The pandemic of COVID-19 has a detrimental impact on market growth. The pandemic had a number of negative consequences for breast cancer biopsy services. Owing to lockdowns in several nations to prevent the spread of COVID-19, hospitals, clinics, and diagnostic facilities were unable to deliver biopsy services. The repercussions of delayed cancer detection owing to COVID-19 were investigated in a study undertaken in the UK and published in The Lancet Oncology in March 2021. The study looked at data from over 100,000 people with breast, colorectal, esophageal, or lung cancer. Owing to the lack of availability to screening services, the study found that 1- and 5-year cancer survival rates are anticipated to be severely reduced as a result of the pandemic

The factors that contribute to the breast biopsy market growth are increased sensitivity of women to mammary cancer in all countries, as well as awareness campaigns and screenings done in their favor. The biopsy market growth market has benefited from the broad and intensive research environment, which has contributed in the development of more accurate and minimally invasive procedures for early identification of mammary cancer. Governments have also tried to create a stable and comprehensive environment for cancer research, which has aided the development of these diagnostic technologies. In addition, advantageous reimbursements have significantly enhanced the health of this sector. The incidence of adverse effects and infections after the biopsy impedes the growth of these diagnostic instruments.

The breast biopsy market is segmented on the basis of product, image guided technology, end user, and region. On the basis of product, it is categorized into vacuum-assisted biopsy (VAB), core needle biopsy (CNB), and fine needle aspiration biopsy (FNAB). By image guided technology, it is classified into MRI-guided biopsy, ultrasound guided biopsy, mammography guided stereotactic biopsy, CT-guided biopsy, and others. On the basis of end user, it is bifurcated into clinic diagnostic centers and hospitals. By region, it is analyzed across North America (U.S., Canada, and Mexico), Europe (Germany, France, UK, Italy, Germany, Russia, Spain, and rest of Europe), Asia-Pacific (Japan, China, India, Australia, Singapore, Philippines, and rest of Asia-Pacific), and LAMEA (Brazil, Turkey, Israel, Saudi Arabia, South Africa, and rest of LAMEA)

On the basis of product, the market is divided into biopsy needles, guidance systems, biopsy tables, localization wires, assay kits, liquid biopsy instruments, and others. By type, the market segments include needle breast biopsy (core needle biopsy (CNB), fine-needle aspiration biopsy (FNAB), and vacuum-assisted biopsy (VAB). Under product type segment, core biopsy is acquired the largest breast biopsy market size and is also the fastest growing segment, as with core biopsy, a larger tissue sample can be obtained that is regarded to draw better architectural information regarding the cancerous presence.

Breast Biopsy Market

On the basis of image guided technology, the market is fragmented into ultrasound-guided biopsy, MRI-guided biopsy, mammography guided stereotactic biopsy, CT-guided biopsy, and other image guided breast biopsy. In addition, breast biopsy has application across early cancer screening, therapy selection, treatment monitoring, and recurrence monitoring. Among all reliable techniques provided under the image guided technology segment, the ultrasound guided breast biopsy segment acquired the largest breast biopsy market size and is also the fastest growing segment, as it is a faster method than MRI & liquid biopsy and avoids need for ionizing radiation exposure and helps in better & reliable determination of tissue samples that can denote whether the lump is benign or malignant.

Breast Biopsy Market

By end user, hospitals & clinics was the largest segment in 2020 due to the rise in number of breast cancer checkups in these acilities. Furthermore, other factors that contributed to the growth of the market were presence of highly skilled satff in these facilties which are technical experts in the treatment and daignosis of breast cancer. 

Breast Biopsy Market

In 2020, North America held the major share (%) in terms of revenue in the global breast biopsy market, and the region is also projected to maintain its dominance over the forecast period from 2021 to 2027. The major economies of the region including the U.S. and Canada are the major revenue contributors to the regional market value. The region has a potential medical tourism market, which supports the dominating regional market value.

Furthermore, Asia Pacific is anticipated to experience the fastest growth over the forecast period from 2021 to 2027. The rapidly developing economies of the region have invested in infrastructural development in the healthcare sector that propels the market growth.

Breast Biopsy Market

The list of key players included in the report include Becton, Dickinson & company, Hologic, Inc., Cell-Signalling Technology, Danaher, QIAGEN, Illumina, Fujifilm, Medtronic, Bio-rad and Thermo Fisher Scientific Corp

The other players in the value chain include Zenalux Biomedical, Inc., F. Hoffmann-La Roche Ltd., OncoCyte Corporation, Laboratory Corporation of America Holdings (Labcorp), Scion Medical Technologies, Planmed Oy, Aurora Imaging Technology Inc., Carestream Health, Cardinal Health, and PerkinElmer.

Key Benefits For Stakeholders

  • This report provides a quantitative analysis of the market segments, current trends, estimations, and dynamics of the breast biopsy market analysis from 2020 to 2030 to identify the prevailing breast biopsy market opportunities.
  • The breast biopsy market forecast is studied for years 202 to 2030. 
  • The market research is offered along with information related to key drivers, restraints, and opportunities.
  • Porter's five forces analysis highlights the potency of buyers and suppliers to enable stakeholders make profit-oriented business decisions and strengthen their supplier-buyer network.
  • In-depth analysis of the breast biopsy industry segmentation assists to determine the prevailing market opportunities.
  • Major countries in each region are mapped according to their revenue contribution to the global market.
  • Market player positioning facilitates benchmarking and provides a clear understanding of the present position of the market players.
  • The report includes the analysis of the regional as well as global breast biopsy market trends, key players, market segments, application areas, and market growth strategies.

Breast Biopsy Market Report Highlights

Aspects Details
By Product
  • Vacuum Assisted Biopsy
  • Core Needle Biopsy
  • Fine Needle Aspiration Biopsy
By Image Guided Technology
  • Mri Guided Breast Biopsy
  • Ultrasound Guided Breast Biopsy
  • Mammography Guided Stereotactic Biopsy
  • Ct Guided Biopsy
  • Other Image Guided Breast Biopsy
By End User
  • Hospitals And Clinics
  • Diagnostic Centers
By Region
  • Europe  (Germany, U.K., Italy, France, Spain, Rest of Europe)
  • Asia-Pacific  (Japan, China, Australia, India, South Korea, Rest of Asia-Pacific)
  • North America  (U.S., Canada, Mexico)
  • LAMEA  (Brazil, Saudi Arabia, South Africa, Rest of LAMEA)
Key Market Players Intact Medical Corporation, Encapsule medical Devices LLC., Hologic Inc., Leica Biosystems Nussloch GmbH, Galini SRL, Argon Medical Devices, C. R. Bard, Inc., Ethicon Endo Surgery, Cook Medical Incorporated, Becton and Dickinson Company
 
  • CHAPTER 1:INTRODUCTION

    • 1.1.Report description

    • 1.2.Key market segments

    • 1.3.Key benefits to the stakeholders

    • 1.4.Research Methodology

      • 1.4.1.Secondary research

      • 1.4.2.Primary research

      • 1.4.3.Analyst tools and models

  • CHAPTER 2:EXECUTIVE SUMMARY

    • 2.1.Key findings of the study

    • 2.2.CXO Perspective

  • CHAPTER 3:MARKET OVERVIEW

    • 3.1.Market definition and scope

    • 3.2.Key findings

      • 3.2.1.Top investment pockets

    • 3.3.Porter’s five forces analysis

    • 3.4.Top player positioning

    • 3.5.Market dynamics

      • 3.5.1.Drivers

      • 3.5.2.Restraints

      • 3.5.3.Opportunities

    • 3.6.COVID-19 Impact Analysis on the market

  • CHAPTER 4: BREAST BIOPSY MARKET, BY PRODUCT

    • 4.1 Overview

      • 4.1.1 Market size and forecast

    • 4.2 Vacuum Assisted Biopsy

      • 4.2.1 Key market trends, growth factors and opportunities

      • 4.2.2 Market size and forecast, by region

      • 4.2.3 Market analysis by country

    • 4.3 Core Needle Biopsy

      • 4.3.1 Key market trends, growth factors and opportunities

      • 4.3.2 Market size and forecast, by region

      • 4.3.3 Market analysis by country

    • 4.4 Fine Needle Aspiration Biopsy

      • 4.4.1 Key market trends, growth factors and opportunities

      • 4.4.2 Market size and forecast, by region

      • 4.4.3 Market analysis by country

  • CHAPTER 5: BREAST BIOPSY MARKET, BY IMAGE GUIDED TECHNOLOGY

    • 5.1 Overview

      • 5.1.1 Market size and forecast

    • 5.2 Mri Guided Breast Biopsy

      • 5.2.1 Key market trends, growth factors and opportunities

      • 5.2.2 Market size and forecast, by region

      • 5.2.3 Market analysis by country

    • 5.3 Ultrasound Guided Breast Biopsy

      • 5.3.1 Key market trends, growth factors and opportunities

      • 5.3.2 Market size and forecast, by region

      • 5.3.3 Market analysis by country

    • 5.4 Mammography Guided Stereotactic Biopsy

      • 5.4.1 Key market trends, growth factors and opportunities

      • 5.4.2 Market size and forecast, by region

      • 5.4.3 Market analysis by country

    • 5.5 Ct Guided Biopsy

      • 5.5.1 Key market trends, growth factors and opportunities

      • 5.5.2 Market size and forecast, by region

      • 5.5.3 Market analysis by country

    • 5.6 Other Image Guided Breast Biopsy

      • 5.6.1 Key market trends, growth factors and opportunities

      • 5.6.2 Market size and forecast, by region

      • 5.6.3 Market analysis by country

  • CHAPTER 6: BREAST BIOPSY MARKET, BY END USER

    • 6.1 Overview

      • 6.1.1 Market size and forecast

    • 6.2 Hospitals And Clinics

      • 6.2.1 Key market trends, growth factors and opportunities

      • 6.2.2 Market size and forecast, by region

      • 6.2.3 Market analysis by country

    • 6.3 Diagnostic Centers

      • 6.3.1 Key market trends, growth factors and opportunities

      • 6.3.2 Market size and forecast, by region

      • 6.3.3 Market analysis by country

  • CHAPTER 7: BREAST BIOPSY MARKET, BY REGION

    • 7.1 Overview

      • 7.1.1 Market size and forecast

    • 7.2 Europe

      • 7.2.1 Key trends and opportunities

      • 7.2.2 Europe Market size and forecast, by Product

      • 7.2.3 Europe Market size and forecast, by Image Guided Technology

      • 7.2.4 Europe Market size and forecast, by End User

      • 7.2.5 Europe Market size and forecast, by country

        • 7.2.5.1 France
          • 7.2.5.1.1 Market size and forecast, by Product
          • 7.2.5.1.2 Market size and forecast, by Image Guided Technology
          • 7.2.5.1.3 Market size and forecast, by End User
        • 7.2.5.2 Germany
          • 7.2.5.2.1 Market size and forecast, by Product
          • 7.2.5.2.2 Market size and forecast, by Image Guided Technology
          • 7.2.5.2.3 Market size and forecast, by End User
        • 7.2.5.3 U.K.
          • 7.2.5.3.1 Market size and forecast, by Product
          • 7.2.5.3.2 Market size and forecast, by Image Guided Technology
          • 7.2.5.3.3 Market size and forecast, by End User
        • 7.2.5.4 Italy
          • 7.2.5.4.1 Market size and forecast, by Product
          • 7.2.5.4.2 Market size and forecast, by Image Guided Technology
          • 7.2.5.4.3 Market size and forecast, by End User
        • 7.2.5.5 Spain
          • 7.2.5.5.1 Market size and forecast, by Product
          • 7.2.5.5.2 Market size and forecast, by Image Guided Technology
          • 7.2.5.5.3 Market size and forecast, by End User
        • 7.2.5.6 Rest of Europe
          • 7.2.5.6.1 Market size and forecast, by Product
          • 7.2.5.6.2 Market size and forecast, by Image Guided Technology
          • 7.2.5.6.3 Market size and forecast, by End User
    • 7.3 Asia-Pacific

      • 7.3.1 Key trends and opportunities

      • 7.3.2 Asia-Pacific Market size and forecast, by Product

      • 7.3.3 Asia-Pacific Market size and forecast, by Image Guided Technology

      • 7.3.4 Asia-Pacific Market size and forecast, by End User

      • 7.3.5 Asia-Pacific Market size and forecast, by country

        • 7.3.5.1 Japan
          • 7.3.5.1.1 Market size and forecast, by Product
          • 7.3.5.1.2 Market size and forecast, by Image Guided Technology
          • 7.3.5.1.3 Market size and forecast, by End User
        • 7.3.5.2 China
          • 7.3.5.2.1 Market size and forecast, by Product
          • 7.3.5.2.2 Market size and forecast, by Image Guided Technology
          • 7.3.5.2.3 Market size and forecast, by End User
        • 7.3.5.3 Australia
          • 7.3.5.3.1 Market size and forecast, by Product
          • 7.3.5.3.2 Market size and forecast, by Image Guided Technology
          • 7.3.5.3.3 Market size and forecast, by End User
        • 7.3.5.4 India
          • 7.3.5.4.1 Market size and forecast, by Product
          • 7.3.5.4.2 Market size and forecast, by Image Guided Technology
          • 7.3.5.4.3 Market size and forecast, by End User
        • 7.3.5.5 South Korea
          • 7.3.5.5.1 Market size and forecast, by Product
          • 7.3.5.5.2 Market size and forecast, by Image Guided Technology
          • 7.3.5.5.3 Market size and forecast, by End User
        • 7.3.5.6 Rest of Asia-Pacific
          • 7.3.5.6.1 Market size and forecast, by Product
          • 7.3.5.6.2 Market size and forecast, by Image Guided Technology
          • 7.3.5.6.3 Market size and forecast, by End User
    • 7.4 North America

      • 7.4.1 Key trends and opportunities

      • 7.4.2 North America Market size and forecast, by Product

      • 7.4.3 North America Market size and forecast, by Image Guided Technology

      • 7.4.4 North America Market size and forecast, by End User

      • 7.4.5 North America Market size and forecast, by country

        • 7.4.5.1 U.S.
          • 7.4.5.1.1 Market size and forecast, by Product
          • 7.4.5.1.2 Market size and forecast, by Image Guided Technology
          • 7.4.5.1.3 Market size and forecast, by End User
        • 7.4.5.2 Canada
          • 7.4.5.2.1 Market size and forecast, by Product
          • 7.4.5.2.2 Market size and forecast, by Image Guided Technology
          • 7.4.5.2.3 Market size and forecast, by End User
        • 7.4.5.3 Mexico
          • 7.4.5.3.1 Market size and forecast, by Product
          • 7.4.5.3.2 Market size and forecast, by Image Guided Technology
          • 7.4.5.3.3 Market size and forecast, by End User
    • 7.5 LAMEA

      • 7.5.1 Key trends and opportunities

      • 7.5.2 LAMEA Market size and forecast, by Product

      • 7.5.3 LAMEA Market size and forecast, by Image Guided Technology

      • 7.5.4 LAMEA Market size and forecast, by End User

      • 7.5.5 LAMEA Market size and forecast, by country

        • 7.5.5.1 Brazil
          • 7.5.5.1.1 Market size and forecast, by Product
          • 7.5.5.1.2 Market size and forecast, by Image Guided Technology
          • 7.5.5.1.3 Market size and forecast, by End User
        • 7.5.5.2 Saudi Arabia
          • 7.5.5.2.1 Market size and forecast, by Product
          • 7.5.5.2.2 Market size and forecast, by Image Guided Technology
          • 7.5.5.2.3 Market size and forecast, by End User
        • 7.5.5.3 South Africa
          • 7.5.5.3.1 Market size and forecast, by Product
          • 7.5.5.3.2 Market size and forecast, by Image Guided Technology
          • 7.5.5.3.3 Market size and forecast, by End User
        • 7.5.5.4 Rest of LAMEA
          • 7.5.5.4.1 Market size and forecast, by Product
          • 7.5.5.4.2 Market size and forecast, by Image Guided Technology
          • 7.5.5.4.3 Market size and forecast, by End User
  • CHAPTER 8: COMPANY LANDSCAPE

    • 8.1. Introduction

    • 8.2. Top winning strategies

    • 8.3. Product Mapping of Top 10 Player

    • 8.4. Competitive Dashboard

    • 8.5. Competitive Heatmap

    • 8.6. Key developments

  • CHAPTER 9: COMPANY PROFILES

    • 9.1 Ethicon Endo Surgery

      • 9.1.1 Company overview

      • 9.1.2 Company snapshot

      • 9.1.3 Operating business segments

      • 9.1.4 Product portfolio

      • 9.1.5 Business performance

      • 9.1.6 Key strategic moves and developments

    • 9.2 Intact Medical Corporation

      • 9.2.1 Company overview

      • 9.2.2 Company snapshot

      • 9.2.3 Operating business segments

      • 9.2.4 Product portfolio

      • 9.2.5 Business performance

      • 9.2.6 Key strategic moves and developments

    • 9.3 Galini SRL

      • 9.3.1 Company overview

      • 9.3.2 Company snapshot

      • 9.3.3 Operating business segments

      • 9.3.4 Product portfolio

      • 9.3.5 Business performance

      • 9.3.6 Key strategic moves and developments

    • 9.4 Hologic Inc.

      • 9.4.1 Company overview

      • 9.4.2 Company snapshot

      • 9.4.3 Operating business segments

      • 9.4.4 Product portfolio

      • 9.4.5 Business performance

      • 9.4.6 Key strategic moves and developments

    • 9.5 Leica Biosystems Nussloch GmbH

      • 9.5.1 Company overview

      • 9.5.2 Company snapshot

      • 9.5.3 Operating business segments

      • 9.5.4 Product portfolio

      • 9.5.5 Business performance

      • 9.5.6 Key strategic moves and developments

    • 9.6 C. R. Bard, Inc.

      • 9.6.1 Company overview

      • 9.6.2 Company snapshot

      • 9.6.3 Operating business segments

      • 9.6.4 Product portfolio

      • 9.6.5 Business performance

      • 9.6.6 Key strategic moves and developments

    • 9.7 Becton and Dickinson Company

      • 9.7.1 Company overview

      • 9.7.2 Company snapshot

      • 9.7.3 Operating business segments

      • 9.7.4 Product portfolio

      • 9.7.5 Business performance

      • 9.7.6 Key strategic moves and developments

    • 9.8 Argon Medical Devices

      • 9.8.1 Company overview

      • 9.8.2 Company snapshot

      • 9.8.3 Operating business segments

      • 9.8.4 Product portfolio

      • 9.8.5 Business performance

      • 9.8.6 Key strategic moves and developments

    • 9.9 Cook Medical Incorporated

      • 9.9.1 Company overview

      • 9.9.2 Company snapshot

      • 9.9.3 Operating business segments

      • 9.9.4 Product portfolio

      • 9.9.5 Business performance

      • 9.9.6 Key strategic moves and developments

    • 9.10 Encapsule medical Devices LLC.

      • 9.10.1 Company overview

      • 9.10.2 Company snapshot

      • 9.10.3 Operating business segments

      • 9.10.4 Product portfolio

      • 9.10.5 Business performance

      • 9.10.6 Key strategic moves and developments

  • LIST OF TABLES

  • TABLE 1. GLOBAL BREAST BIOPSY MARKET, BY PRODUCT, 2020-2030,($MILLION)
    TABLE 2. BREAST BIOPSY MARKET REVENUE, FOR VACUUM ASSISTED BIOPSY, BY REGION , 2020-2030,($MILLION)
    TABLE 3. BREAST BIOPSY MARKET VACUUM ASSISTED BIOPSY BY COUNTRY, 2020-2030,($MILLION)
    TABLE 4. BREAST BIOPSY MARKET REVENUE, FOR CORE NEEDLE BIOPSY, BY REGION , 2020-2030,($MILLION)
    TABLE 5. BREAST BIOPSY MARKET CORE NEEDLE BIOPSY BY COUNTRY, 2020-2030,($MILLION)
    TABLE 6. BREAST BIOPSY MARKET REVENUE, FOR FINE NEEDLE ASPIRATION BIOPSY, BY REGION , 2020-2030,($MILLION)
    TABLE 7. BREAST BIOPSY MARKET FINE NEEDLE ASPIRATION BIOPSY BY COUNTRY, 2020-2030,($MILLION)
    TABLE 8. GLOBAL BREAST BIOPSY MARKET, BY IMAGE GUIDED TECHNOLOGY, 2020-2030,($MILLION)
    TABLE 9. BREAST BIOPSY MARKET REVENUE, FOR MRI GUIDED BREAST BIOPSY, BY REGION , 2020-2030,($MILLION)
    TABLE 10. BREAST BIOPSY MARKET MRI GUIDED BREAST BIOPSY BY COUNTRY, 2020-2030,($MILLION)
    TABLE 11. BREAST BIOPSY MARKET REVENUE, FOR ULTRASOUND GUIDED BREAST BIOPSY, BY REGION , 2020-2030,($MILLION)
    TABLE 12. BREAST BIOPSY MARKET ULTRASOUND GUIDED BREAST BIOPSY BY COUNTRY, 2020-2030,($MILLION)
    TABLE 13. BREAST BIOPSY MARKET REVENUE, FOR MAMMOGRAPHY GUIDED STEREOTACTIC BIOPSY, BY REGION , 2020-2030,($MILLION)
    TABLE 14. BREAST BIOPSY MARKET MAMMOGRAPHY GUIDED STEREOTACTIC BIOPSY BY COUNTRY, 2020-2030,($MILLION)
    TABLE 15. BREAST BIOPSY MARKET REVENUE, FOR CT GUIDED BIOPSY, BY REGION , 2020-2030,($MILLION)
    TABLE 16. BREAST BIOPSY MARKET CT GUIDED BIOPSY BY COUNTRY, 2020-2030,($MILLION)
    TABLE 17. BREAST BIOPSY MARKET REVENUE, FOR OTHER IMAGE GUIDED BREAST BIOPSY, BY REGION , 2020-2030,($MILLION)
    TABLE 18. BREAST BIOPSY MARKET OTHER IMAGE GUIDED BREAST BIOPSY BY COUNTRY, 2020-2030,($MILLION)
    TABLE 19. GLOBAL BREAST BIOPSY MARKET, BY END USER, 2020-2030,($MILLION)
    TABLE 20. BREAST BIOPSY MARKET REVENUE, FOR HOSPITALS AND CLINICS, BY REGION , 2020-2030,($MILLION)
    TABLE 21. BREAST BIOPSY MARKET HOSPITALS AND CLINICS BY COUNTRY, 2020-2030,($MILLION)
    TABLE 22. BREAST BIOPSY MARKET REVENUE, FOR DIAGNOSTIC CENTERS, BY REGION , 2020-2030,($MILLION)
    TABLE 23. BREAST BIOPSY MARKET DIAGNOSTIC CENTERS BY COUNTRY, 2020-2030,($MILLION)
    TABLE 24. BREAST BIOPSY MARKET, BY REGION, 2020-2030,($MILLION)
    TABLE 25. EUROPE BREAST BIOPSY MARKET, BY PRODUCT, 2020-2030,($MILLION)
    TABLE 26. EUROPE BREAST BIOPSY MARKET, BY IMAGE GUIDED TECHNOLOGY, 2020-2030,($MILLION)
    TABLE 27. EUROPE BREAST BIOPSY MARKET, BY END USER, 2020-2030,($MILLION)
    TABLE 28. EUROPE BREAST BIOPSY MARKET, BY COUNTRY, 2020-2030,($MILLION)
    TABLE 29. FRANCE BREAST BIOPSY MARKET BY PRODUCT 2020-2030,($MILLION)
    TABLE 30. FRANCE BREAST BIOPSY MARKET BY IMAGE GUIDED TECHNOLOGY 2020-2030,($MILLION)
    TABLE 31. FRANCE BREAST BIOPSY MARKET BY END USER 2020-2030,($MILLION)
    TABLE 32. GERMANY BREAST BIOPSY MARKET BY PRODUCT 2020-2030,($MILLION)
    TABLE 33. GERMANY BREAST BIOPSY MARKET BY IMAGE GUIDED TECHNOLOGY 2020-2030,($MILLION)
    TABLE 34. GERMANY BREAST BIOPSY MARKET BY END USER 2020-2030,($MILLION)
    TABLE 35. U.K. BREAST BIOPSY MARKET BY PRODUCT 2020-2030,($MILLION)
    TABLE 36. U.K. BREAST BIOPSY MARKET BY IMAGE GUIDED TECHNOLOGY 2020-2030,($MILLION)
    TABLE 37. U.K. BREAST BIOPSY MARKET BY END USER 2020-2030,($MILLION)
    TABLE 38. ITALY BREAST BIOPSY MARKET BY PRODUCT 2020-2030,($MILLION)
    TABLE 39. ITALY BREAST BIOPSY MARKET BY IMAGE GUIDED TECHNOLOGY 2020-2030,($MILLION)
    TABLE 40. ITALY BREAST BIOPSY MARKET BY END USER 2020-2030,($MILLION)
    TABLE 41. SPAIN BREAST BIOPSY MARKET BY PRODUCT 2020-2030,($MILLION)
    TABLE 42. SPAIN BREAST BIOPSY MARKET BY IMAGE GUIDED TECHNOLOGY 2020-2030,($MILLION)
    TABLE 43. SPAIN BREAST BIOPSY MARKET BY END USER 2020-2030,($MILLION)
    TABLE 44. REST OF EUROPE BREAST BIOPSY MARKET BY PRODUCT 2020-2030,($MILLION)
    TABLE 45. REST OF EUROPE BREAST BIOPSY MARKET BY IMAGE GUIDED TECHNOLOGY 2020-2030,($MILLION)
    TABLE 46. REST OF EUROPE BREAST BIOPSY MARKET BY END USER 2020-2030,($MILLION)
    TABLE 47. ASIA-PACIFIC BREAST BIOPSY MARKET, BY PRODUCT, 2020-2030,($MILLION)
    TABLE 48. ASIA-PACIFIC BREAST BIOPSY MARKET, BY IMAGE GUIDED TECHNOLOGY, 2020-2030,($MILLION)
    TABLE 49. ASIA-PACIFIC BREAST BIOPSY MARKET, BY END USER, 2020-2030,($MILLION)
    TABLE 50. ASIA-PACIFIC BREAST BIOPSY MARKET, BY COUNTRY, 2020-2030,($MILLION)
    TABLE 51. JAPAN BREAST BIOPSY MARKET BY PRODUCT 2020-2030,($MILLION)
    TABLE 52. JAPAN BREAST BIOPSY MARKET BY IMAGE GUIDED TECHNOLOGY 2020-2030,($MILLION)
    TABLE 53. JAPAN BREAST BIOPSY MARKET BY END USER 2020-2030,($MILLION)
    TABLE 54. CHINA BREAST BIOPSY MARKET BY PRODUCT 2020-2030,($MILLION)
    TABLE 55. CHINA BREAST BIOPSY MARKET BY IMAGE GUIDED TECHNOLOGY 2020-2030,($MILLION)
    TABLE 56. CHINA BREAST BIOPSY MARKET BY END USER 2020-2030,($MILLION)
    TABLE 57. AUSTRALIA BREAST BIOPSY MARKET BY PRODUCT 2020-2030,($MILLION)
    TABLE 58. AUSTRALIA BREAST BIOPSY MARKET BY IMAGE GUIDED TECHNOLOGY 2020-2030,($MILLION)
    TABLE 59. AUSTRALIA BREAST BIOPSY MARKET BY END USER 2020-2030,($MILLION)
    TABLE 60. INDIA BREAST BIOPSY MARKET BY PRODUCT 2020-2030,($MILLION)
    TABLE 61. INDIA BREAST BIOPSY MARKET BY IMAGE GUIDED TECHNOLOGY 2020-2030,($MILLION)
    TABLE 62. INDIA BREAST BIOPSY MARKET BY END USER 2020-2030,($MILLION)
    TABLE 63. SOUTH KOREA BREAST BIOPSY MARKET BY PRODUCT 2020-2030,($MILLION)
    TABLE 64. SOUTH KOREA BREAST BIOPSY MARKET BY IMAGE GUIDED TECHNOLOGY 2020-2030,($MILLION)
    TABLE 65. SOUTH KOREA BREAST BIOPSY MARKET BY END USER 2020-2030,($MILLION)
    TABLE 66. REST OF ASIA-PACIFIC BREAST BIOPSY MARKET BY PRODUCT 2020-2030,($MILLION)
    TABLE 67. REST OF ASIA-PACIFIC BREAST BIOPSY MARKET BY IMAGE GUIDED TECHNOLOGY 2020-2030,($MILLION)
    TABLE 68. REST OF ASIA-PACIFIC BREAST BIOPSY MARKET BY END USER 2020-2030,($MILLION)
    TABLE 69. NORTH AMERICA BREAST BIOPSY MARKET, BY PRODUCT, 2020-2030,($MILLION)
    TABLE 70. NORTH AMERICA BREAST BIOPSY MARKET, BY IMAGE GUIDED TECHNOLOGY, 2020-2030,($MILLION)
    TABLE 71. NORTH AMERICA BREAST BIOPSY MARKET, BY END USER, 2020-2030,($MILLION)
    TABLE 72. NORTH AMERICA BREAST BIOPSY MARKET, BY COUNTRY, 2020-2030,($MILLION)
    TABLE 73. U.S. BREAST BIOPSY MARKET BY PRODUCT 2020-2030,($MILLION)
    TABLE 74. U.S. BREAST BIOPSY MARKET BY IMAGE GUIDED TECHNOLOGY 2020-2030,($MILLION)
    TABLE 75. U.S. BREAST BIOPSY MARKET BY END USER 2020-2030,($MILLION)
    TABLE 76. CANADA BREAST BIOPSY MARKET BY PRODUCT 2020-2030,($MILLION)
    TABLE 77. CANADA BREAST BIOPSY MARKET BY IMAGE GUIDED TECHNOLOGY 2020-2030,($MILLION)
    TABLE 78. CANADA BREAST BIOPSY MARKET BY END USER 2020-2030,($MILLION)
    TABLE 79. MEXICO BREAST BIOPSY MARKET BY PRODUCT 2020-2030,($MILLION)
    TABLE 80. MEXICO BREAST BIOPSY MARKET BY IMAGE GUIDED TECHNOLOGY 2020-2030,($MILLION)
    TABLE 81. MEXICO BREAST BIOPSY MARKET BY END USER 2020-2030,($MILLION)
    TABLE 82. LAMEA BREAST BIOPSY MARKET, BY PRODUCT, 2020-2030,($MILLION)
    TABLE 83. LAMEA BREAST BIOPSY MARKET, BY IMAGE GUIDED TECHNOLOGY, 2020-2030,($MILLION)
    TABLE 84. LAMEA BREAST BIOPSY MARKET, BY END USER, 2020-2030,($MILLION)
    TABLE 85. LAMEA BREAST BIOPSY MARKET, BY COUNTRY, 2020-2030,($MILLION)
    TABLE 86. BRAZIL BREAST BIOPSY MARKET BY PRODUCT 2020-2030,($MILLION)
    TABLE 87. BRAZIL BREAST BIOPSY MARKET BY IMAGE GUIDED TECHNOLOGY 2020-2030,($MILLION)
    TABLE 88. BRAZIL BREAST BIOPSY MARKET BY END USER 2020-2030,($MILLION)
    TABLE 89. SAUDI ARABIA BREAST BIOPSY MARKET BY PRODUCT 2020-2030,($MILLION)
    TABLE 90. SAUDI ARABIA BREAST BIOPSY MARKET BY IMAGE GUIDED TECHNOLOGY 2020-2030,($MILLION)
    TABLE 91. SAUDI ARABIA BREAST BIOPSY MARKET BY END USER 2020-2030,($MILLION)
    TABLE 92. SOUTH AFRICA BREAST BIOPSY MARKET BY PRODUCT 2020-2030,($MILLION)
    TABLE 93. SOUTH AFRICA BREAST BIOPSY MARKET BY IMAGE GUIDED TECHNOLOGY 2020-2030,($MILLION)
    TABLE 94. SOUTH AFRICA BREAST BIOPSY MARKET BY END USER 2020-2030,($MILLION)
    TABLE 95. REST OF LAMEA BREAST BIOPSY MARKET BY PRODUCT 2020-2030,($MILLION)
    TABLE 96. REST OF LAMEA BREAST BIOPSY MARKET BY IMAGE GUIDED TECHNOLOGY 2020-2030,($MILLION)
    TABLE 97. REST OF LAMEA BREAST BIOPSY MARKET BY END USER 2020-2030,($MILLION)
    TABLE 98.ETHICON ENDO SURGERY: COMPANY SNAPSHOT
    TABLE 99.ETHICON ENDO SURGERY: OPERATING SEGMENTS
    TABLE 100.ETHICON ENDO SURGERY: PRODUCT PORTFOLIO
    TABLE 101.ETHICON ENDO SURGERY: NET SALES,
    TABLE 102.ETHICON ENDO SURGERY: KEY STRATERGIES
    TABLE 103.INTACT MEDICAL CORPORATION: COMPANY SNAPSHOT
    TABLE 104.INTACT MEDICAL CORPORATION: OPERATING SEGMENTS
    TABLE 105.INTACT MEDICAL CORPORATION: PRODUCT PORTFOLIO
    TABLE 106.INTACT MEDICAL CORPORATION: NET SALES,
    TABLE 107.INTACT MEDICAL CORPORATION: KEY STRATERGIES
    TABLE 108.GALINI SRL: COMPANY SNAPSHOT
    TABLE 109.GALINI SRL: OPERATING SEGMENTS
    TABLE 110.GALINI SRL: PRODUCT PORTFOLIO
    TABLE 111.GALINI SRL: NET SALES,
    TABLE 112.GALINI SRL: KEY STRATERGIES
    TABLE 113.HOLOGIC INC.: COMPANY SNAPSHOT
    TABLE 114.HOLOGIC INC.: OPERATING SEGMENTS
    TABLE 115.HOLOGIC INC.: PRODUCT PORTFOLIO
    TABLE 116.HOLOGIC INC.: NET SALES,
    TABLE 117.HOLOGIC INC.: KEY STRATERGIES
    TABLE 118.LEICA BIOSYSTEMS NUSSLOCH GMBH: COMPANY SNAPSHOT
    TABLE 119.LEICA BIOSYSTEMS NUSSLOCH GMBH: OPERATING SEGMENTS
    TABLE 120.LEICA BIOSYSTEMS NUSSLOCH GMBH: PRODUCT PORTFOLIO
    TABLE 121.LEICA BIOSYSTEMS NUSSLOCH GMBH: NET SALES,
    TABLE 122.LEICA BIOSYSTEMS NUSSLOCH GMBH: KEY STRATERGIES
    TABLE 123.C. R. BARD, INC.: COMPANY SNAPSHOT
    TABLE 124.C. R. BARD, INC.: OPERATING SEGMENTS
    TABLE 125.C. R. BARD, INC.: PRODUCT PORTFOLIO
    TABLE 126.C. R. BARD, INC.: NET SALES,
    TABLE 127.C. R. BARD, INC.: KEY STRATERGIES
    TABLE 128.BECTON AND DICKINSON COMPANY: COMPANY SNAPSHOT
    TABLE 129.BECTON AND DICKINSON COMPANY: OPERATING SEGMENTS
    TABLE 130.BECTON AND DICKINSON COMPANY: PRODUCT PORTFOLIO
    TABLE 131.BECTON AND DICKINSON COMPANY: NET SALES,
    TABLE 132.BECTON AND DICKINSON COMPANY: KEY STRATERGIES
    TABLE 133.ARGON MEDICAL DEVICES: COMPANY SNAPSHOT
    TABLE 134.ARGON MEDICAL DEVICES: OPERATING SEGMENTS
    TABLE 135.ARGON MEDICAL DEVICES: PRODUCT PORTFOLIO
    TABLE 136.ARGON MEDICAL DEVICES: NET SALES,
    TABLE 137.ARGON MEDICAL DEVICES: KEY STRATERGIES
    TABLE 138.COOK MEDICAL INCORPORATED: COMPANY SNAPSHOT
    TABLE 139.COOK MEDICAL INCORPORATED: OPERATING SEGMENTS
    TABLE 140.COOK MEDICAL INCORPORATED: PRODUCT PORTFOLIO
    TABLE 141.COOK MEDICAL INCORPORATED: NET SALES,
    TABLE 142.COOK MEDICAL INCORPORATED: KEY STRATERGIES
  • LIST OF FIGURES

  • FIGURE 1.BREAST BIOPSY MARKET SEGMENTATION
    FIGURE 2.BREAST BIOPSY MARKET,2020-2030
    FIGURE 3.BREAST BIOPSY MARKET,2020-2030
    FIGURE 4. TOP INVESTMENT POCKETS, BY REGION
    FIGURE 5.PORTER FIVE-1
    FIGURE 6.PORTER FIVE-2
    FIGURE 7.PORTER FIVE-3
    FIGURE 8.PORTER FIVE-4
    FIGURE 9.PORTER FIVE-5
    FIGURE 10.TOP PLAYER POSITIONING
    FIGURE 11.BREAST BIOPSY MARKET:DRIVERS, RESTRAINTS AND OPPORTUNITIES
    FIGURE 11.BREAST BIOPSY MARKET,BY PRODUCT,2020(%)
    FIGURE 12.COMPARATIVE SHARE ANALYSIS OF VACUUM ASSISTED BIOPSY BREAST BIOPSY MARKET,2020-2030(%)
    FIGURE 13.COMPARATIVE SHARE ANALYSIS OF CORE NEEDLE BIOPSY BREAST BIOPSY MARKET,2020-2030(%)
    FIGURE 14.COMPARATIVE SHARE ANALYSIS OF FINE NEEDLE ASPIRATION BIOPSY BREAST BIOPSY MARKET,2020-2030(%)
    FIGURE 15.BREAST BIOPSY MARKET,BY IMAGE GUIDED TECHNOLOGY,2020(%)
    FIGURE 16.COMPARATIVE SHARE ANALYSIS OF MRI GUIDED BREAST BIOPSY BREAST BIOPSY MARKET,2020-2030(%)
    FIGURE 17.COMPARATIVE SHARE ANALYSIS OF ULTRASOUND GUIDED BREAST BIOPSY BREAST BIOPSY MARKET,2020-2030(%)
    FIGURE 18.COMPARATIVE SHARE ANALYSIS OF MAMMOGRAPHY GUIDED STEREOTACTIC BIOPSY BREAST BIOPSY MARKET,2020-2030(%)
    FIGURE 19.COMPARATIVE SHARE ANALYSIS OF CT GUIDED BIOPSY BREAST BIOPSY MARKET,2020-2030(%)
    FIGURE 20.COMPARATIVE SHARE ANALYSIS OF OTHER IMAGE GUIDED BREAST BIOPSY BREAST BIOPSY MARKET,2020-2030(%)
    FIGURE 21.BREAST BIOPSY MARKET,BY END USER,2020(%)
    FIGURE 22.COMPARATIVE SHARE ANALYSIS OF HOSPITALS AND CLINICS BREAST BIOPSY MARKET,2020-2030(%)
    FIGURE 23.COMPARATIVE SHARE ANALYSIS OF DIAGNOSTIC CENTERS BREAST BIOPSY MARKET,2020-2030(%)
    FIGURE 24.BREAST BIOPSY MARKET BY REGION,2020
    FIGURE 25.FRANCE BREAST BIOPSY MARKET,2020-2030($MILLION)
    FIGURE 26.GERMANY BREAST BIOPSY MARKET,2020-2030($MILLION)
    FIGURE 27.U.K. BREAST BIOPSY MARKET,2020-2030($MILLION)
    FIGURE 28.ITALY BREAST BIOPSY MARKET,2020-2030($MILLION)
    FIGURE 29.SPAIN BREAST BIOPSY MARKET,2020-2030($MILLION)
    FIGURE 30.REST OF EUROPE BREAST BIOPSY MARKET,2020-2030($MILLION)
    FIGURE 31.JAPAN BREAST BIOPSY MARKET,2020-2030($MILLION)
    FIGURE 32.CHINA BREAST BIOPSY MARKET,2020-2030($MILLION)
    FIGURE 33.AUSTRALIA BREAST BIOPSY MARKET,2020-2030($MILLION)
    FIGURE 34.INDIA BREAST BIOPSY MARKET,2020-2030($MILLION)
    FIGURE 35.SOUTH KOREA BREAST BIOPSY MARKET,2020-2030($MILLION)
    FIGURE 36.REST OF ASIA-PACIFIC BREAST BIOPSY MARKET,2020-2030($MILLION)
    FIGURE 37.U.S. BREAST BIOPSY MARKET,2020-2030($MILLION)
    FIGURE 38.CANADA BREAST BIOPSY MARKET,2020-2030($MILLION)
    FIGURE 39.MEXICO BREAST BIOPSY MARKET,2020-2030($MILLION)
    FIGURE 40.BRAZIL BREAST BIOPSY MARKET,2020-2030($MILLION)
    FIGURE 41.SAUDI ARABIA BREAST BIOPSY MARKET,2020-2030($MILLION)
    FIGURE 42.SOUTH AFRICA BREAST BIOPSY MARKET,2020-2030($MILLION)
    FIGURE 43.REST OF LAMEA BREAST BIOPSY MARKET,2020-2030($MILLION)
    FIGURE 44. TOP WINNING STRATEGIES, BY YEAR
    FIGURE 45. TOP WINNING STRATEGIES, BY DEVELOPMENT
    FIGURE 46. TOP WINNING STRATEGIES, BY COMPANY
    FIGURE 47.PRODUCT MAPPING OF TOP 10 PLAYERS
    FIGURE 48.COMPETITIVE DASHBOARD
    FIGURE 49.COMPETITIVE HEATMAP OF TOP 10 KEY PLAYERS
    FIGURE 50.ETHICON ENDO SURGERY.: NET SALES ,($MILLION)
    FIGURE 51.INTACT MEDICAL CORPORATION.: NET SALES ,($MILLION)
    FIGURE 52.GALINI SRL.: NET SALES ,($MILLION)
    FIGURE 53.HOLOGIC INC..: NET SALES ,($MILLION)
    FIGURE 54.LEICA BIOSYSTEMS NUSSLOCH GMBH.: NET SALES ,($MILLION)
    FIGURE 55.C. R. BARD, INC..: NET SALES ,($MILLION)
    FIGURE 56.BECTON AND DICKINSON COMPANY.: NET SALES ,($MILLION)
    FIGURE 57.ARGON MEDICAL DEVICES.: NET SALES ,($MILLION)
    FIGURE 58.COOK MEDICAL INCORPORATED.: NET SALES ,($MILLION)
    FIGURE 59.ENCAPSULE MEDICAL DEVICES LLC..: NET SALES ,($MILLION)


Breast biopsy is a medical technique that examines suspicious regions of the breast to determine if they are cancerous. It takes a sample of breast tissue to discover and diagnose abnormalities in the cells that might cause breast lumps and other unexpected breast alterations. Breast biopsy is a diagnostic process used to see if a small sample of breast tissue removed is malignant or not. It is thought to be one of the most effective ways for cancer detection.

When a person experiences symptoms such as a breast lump, sore breast, breast dimpling, peeling of the breast, and nipple discharge, a breast biopsy is indicated. Invasive surgical procedures for breast biopsy have been found to be ineffective since they are uncomfortable and subject the patient to the psychological burden of false positive referrals.

Factors such as the increased sensitivity of women to mammary cancer in all countries, as well as awareness campaigns and screenings done in their favor have fueled the demand side of the breast biopsy market. Therefore, the market has benefited from the broad and intensive research environment, which has contributed in the development of more accurate and minimally invasive procedures for the early identification of mammary cancer. Governments have also tried to create a stable and comprehensive environment for cancer research, which has aided the development of these diagnostic technologies. In addition, advantageous reimbursements have significantly enhanced the health of this sector.

In 2020, North America held the major share in terms of revenue in the global breast biopsy market, and the region is also projected to maintain its dominance during the forecast period from 2021 to 2030. The region has a potential medical tourism market, which additionally supports the dominating regional market value. Furthermore, Asia Pacific is anticipated to experience the fastest growth over the forecast period from 2021 to 2030. The rapidly developing economies of the region have invested in infrastructural development in the healthcare sector that propels the market growth

PURCHASE OPTIONS

Call or Email us

U.S.-Canada Toll-free: +1-800-792-5285
Int'l : +1-503-894-6022
Europe : +44-845-528-1300
Email : help@alliedmarketresearch.com
 
FREQUENTLY ASKED QUESTIONS?

A. The total market value of Breast Biopsy market is $658 million in 2020.

A. The forecast period for Breast Biopsy market is 2021 to 2030

A. The base year is 2020 in Breast Biopsy market

A. Top companies such as Becton, Dickinson & company, Hologic, Inc., Danaher, Bio-rad held a high market position in 2020.

A. The market value of Breast Biopsy market in 2030 is $1,082 million.

Looking for Customization?

 Customization Request

Have a Question?

 Speak with Analyst

Any Confusion?

 Inquire Before Buying

Have a glance of the Report

  Request Sample
RELATED TAGS

Purchase Full Report of
Breast Biopsy Market

Start reading instantly.
This Report and over 66,965+ more Reports, Available with Avenue Library. T&C*.

  • Online Only
  • $3,565
  • Online cloud access only
  • Restricted print, copy, paste & download
  • Read only
  • Free industry update
    (Within 180 days)
  • Free report update in next update cycle
    (Mar 2023 - Mar 2024)
  • Data Pack
  • $3,961
  • Restricted to one authorized user
  • One print only
  • Available in
    Excel
  • Free industry update
    (Within 180 days)
  •   Free report update in next update cycle
    (Mar 2023 - Mar 2024)
  • Single User
  • $5,540
  • Restricted to one authorized user
  • One print only
  • Available in
    PDF
  • Free industry update
    (Within 180 days)
  •   Free report update in next update cycle
    (Mar 2023 - Mar 2024)
  • Five Users
  • $6,654
  • Limited to five authorized users
  • Print upto five copies
  • Available in
    PDF
  • Free industry update
    (Within 180 days)
  •   Free report update in next update cycle
    (Mar 2023 - Mar 2024)
  • Enterprise
    License/PDF

  • $10,280
  • Unlimited
    within
    company/enterprise
  • Available in Excel & PDF
  • Free industry update
    (Within 180 days)
  •   Free report update in next update cycle
    (Mar 2023 - Mar 2024)
  • Library
    Membership

  • $999 $ 1,175
    Per User/ Per month/ Billed annually
  • Published Content
    E-access
  • Company Profiles
    E-access
  • Newly Added Content Access
  • 10 PDF
    Downloads
  • 5 Excel Data
    Pack Downloads
  • 250 Company Profiles PDF Downloads
  • Buy Now

*Taxes/Fees, if applicable will be added during checkout. All prices in USD

RELATED REPORTS
 

Why Allied Market Research?


Infallible Methodology

To ensure high-level data integrity, accurate analysis, and impeccable forecasts

Analyst Support

For complete satisfaction

Customization

On-demand customization of scope of the report to exactly meet your needs

TARGETED MARKET VIEW

Targeted market view to provide pertinent information and save time of readers

Get fresh content delivered

Get insights on topics that are crucial for your business. Stay abreast of your interest areas.

Get Industry Data Alerts

Why Allied Market Research?

Infallible Methodology

To ensure high-level data integrity, accurate analysis, and impeccable forecasts

Analyst Support

For complete satisfaction

Customization

On-demand customization of scope of the report to exactly meet your needs

TARGETED MARKET VIEW

Targeted market view to provide pertinent information and save time of readers