0
2022
Breast Implants Market

Breast Implants Market

by Type (Silicone Implants, Saline Implants), by Shape (Round, Anatomical), by Texture (Smooth, Textured), by Application (Breast Augmentation, Breast Reconstruction), by End-use (Hospital, Clinics): Global Opportunity Analysis and Industry Forecast, 2021-2031

Report Code: A02324
Oct 2022 | Pages: 390
Tables: 201
Charts: 69
  • Formats*:

  • pdf

    Single User License, Five User
    License & Enterprise User License

  • xls

    Data Pack Excel License

  • ppt

    It comes with the additional cost
    of $2500.00 contact sales.


Breast Implants Market Research, 2031

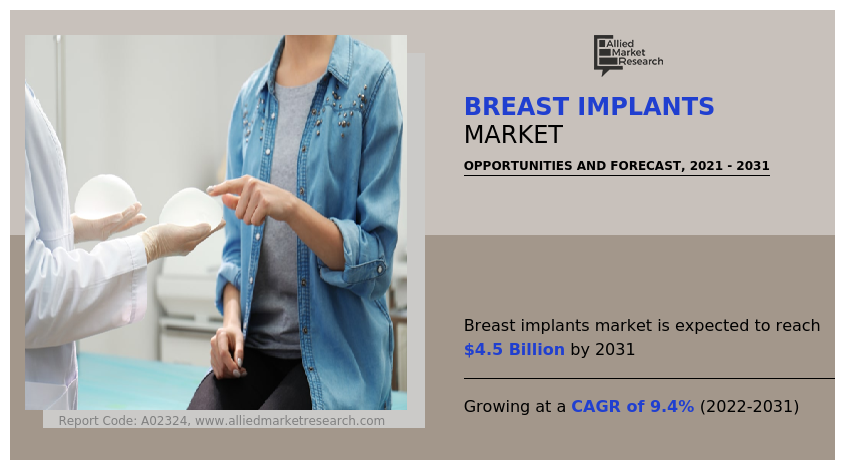
The global breast implants market size was valued at $1.8 billion in 2021, and is projected to reach $4.5 billion by 2031, growing at a CAGR of 9.4% from 2022 to 2031. A breast implant is made up of silicone shells filled with silicone gel or sterile salt water(saline). Breast implants are artificial objects (prostheses) that are surgically implanted into the breast during breast augmentation surgery, commonly known as mammoplasty. Breast implantation is done for a variety of reasons, including for women who had mastectomy (breast removal due to cancer), whose breast size has decreased due to pregnancy, weight loss, or aging, whose breasts are asymmetrical, and for women who want to boost their self-esteem and body image.
The Covid-19 pandemic has had a significant and long-term impact on healthcare delivery. The epidemic has also resulted in decreased access to life-saving diagnostics and screening programmes, which has significantly hampered the breast implantation service providers. During the pandemic due to the limitations and lockdown, ongoing and scheduled surgical procedures were delayed or cancelled, negatively impacting the breast implant market.

Breast Implants Market

One of the major factors driving the growth of the breast implant market is the global increase in the prevalence of breast cancer. According to WHO, breast cancer surpassed lung cancer and became the most diagnosed cancer worldwide. According to the World Health Organization, in 2020, around 2.3 million women were diagnosed with breast cancer, and 685,000 of them died globally. While, in Asian women, the breast cancer prevalence was so high that it accounted for 22.9% of the total cancer cases in women in 2020. As of January 2022, there are more than 3.8 million women with a history of breast cancer in the U.S. This includes women currently being treated and women who have finished treatment. As of 2021, breast cancer was the most common cancer worldwide, accounting for 12% of all new cancer cases worldwide. These factors are anticipated to propell the breast implants market growth in the near future.

However, the post-surgery complications and risks associated with the breast implant, along with the high cost associated with the implant, are the major factors hampering the growth of the breast implant market. In addition, there is a high misconception about post-surgical complications and risks from breast implants in women. However, if this constraint is solved by creating awareness in women and clearing their misconceptions, it will contribute to the global breast implant market.

As per the 2020 International Society for Aesthetic Plastic Surgeons (ISAPS) statistics, breast augmentation remained the most common surgical procedure, accounting for 16% of all procedures. Thus, increase in inclination and awareness of women worldwide toward breast augmentation and reconstruction procedures for beauty enhancement is expected to drive global breast implant market revenue during the forecast period. These are the key factors propelling the breast implants market opportunity over the coming years.

The key players profiled in this report include Sebbin, Allergan, Mentor Worldwide LLC, GC Aesthetics, Laboratories Arion, Sientra Inc, Hansbiomed, Cereplas, Silimed, and Groupe Sebbin SAS.

The global breast implant market is segmented on the basis of product, shape, application, end-use and region. By product, the market is sub-segmented into saline implant and silicone implant. On the basis of shape, the market is sub-segmented into anatomical shape and round shape. According to application, the market is sub-segmented into breast reconstruction and breast augmentation. By end use, the market is sub-segmented into clinics, hospitals, and others. On the basis of region, the market is analyzed across North America, Europe, Asia-Pacific, and LAMEA.

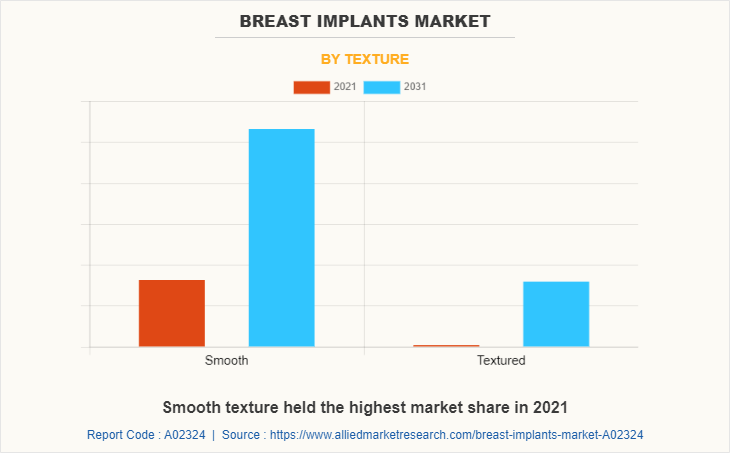
The breast implants industry is segmented into Type, Shape, Texture, Application and End-use.

Breast Implants Market

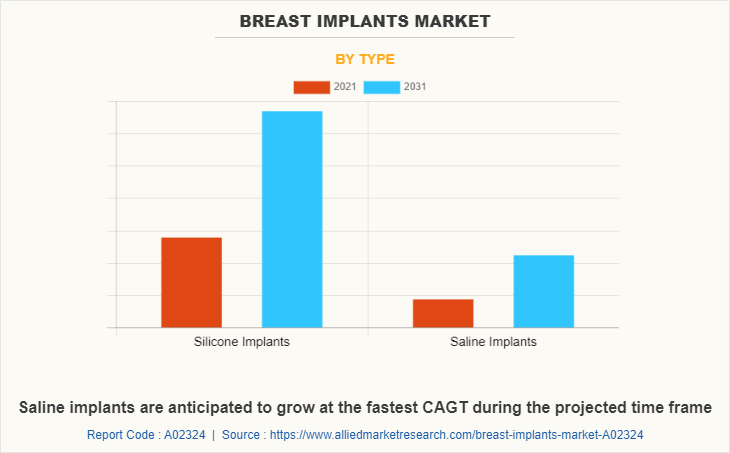
By product, the silicone implant sub-segment dominates the market and is anticipated to be the fastest growing during the forecast period. This type of implant has the ability to replicate the natural breast and is lightweight. This is expected to significantly increase the preference over other types. These implants offer changeable flexibility as needed, as well as the ability to be filled at the time of implant surgery. Moreover, there will be a reduction in wrinkling, which will further impel the growth of this segment in the forecast timeline. These are predicted to be the major factors affecting the breast implant market size during the forecast period.
Breast Implants Market

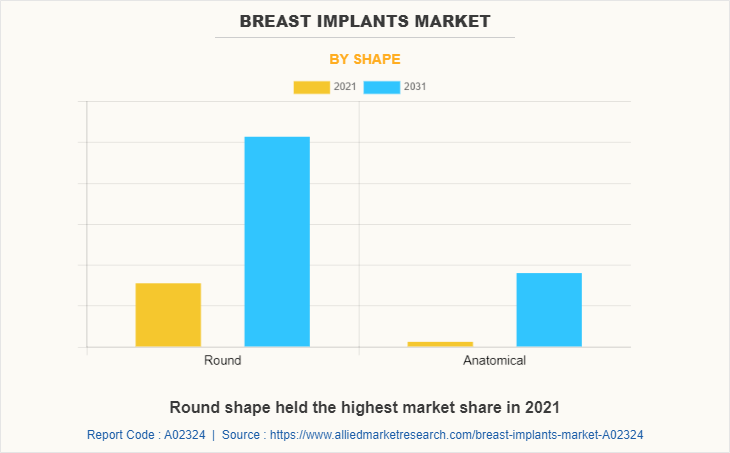
By shape, the round shape sub-segment dominated the global breast implant market share and is predicted to be the fastest growing sub-segment in the forecasted years. The growth of this sub-segment can be attributed to the implants’ ability to properly arrange for the creation of a proportioned breast shape. Round implants give the breasts a more natural appearance when they are implanted by a qualified surgeon. Breasts with anatomical implants appear more natural. However, while standing, round implants take on a natural slope due to gravity, making them look natural. Additionally, these items come in a wide variety of diameters and projection levels, which increases their adaptability and further demand.
Breast Implants Market

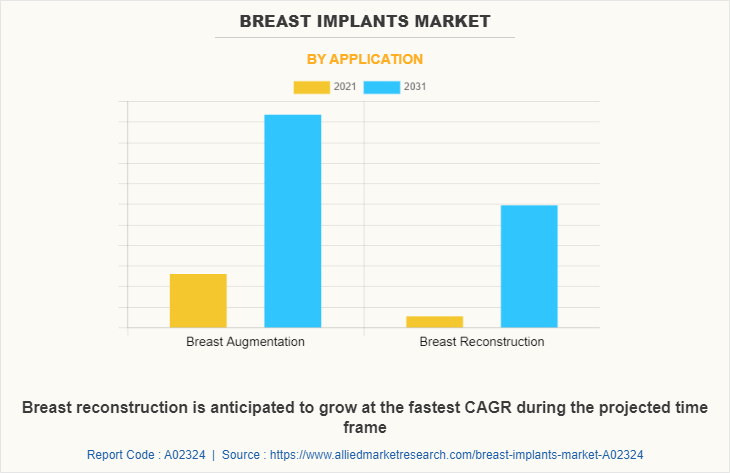
By application, the breast augmentation sub-segment is the most dominant and fastest growing in the coming years. Breast augmentation procedures are specifically designed to increase the current breast volume while breast reconstruction is performed to restore function and normal appearance after surgery due to cancer or to adjust the setting of breasts after a birth difference. Breast augmentation procedures are anticipated to witness robust growth during the projected period, owing to a significant increase in the number of women choosing this procedure. Features such as short procedure duration and less involvement of complications is expected to boost product demand during the forecast period.
Breast Implants Market

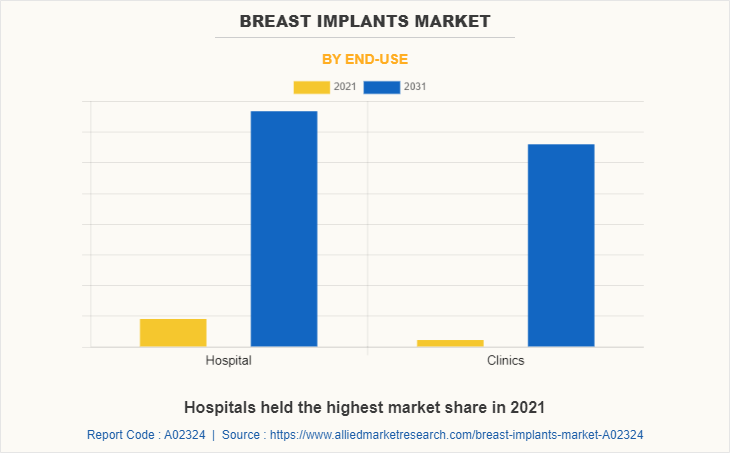
By end use, clinics sub-segment is forecasted to generate the most revenue during the forecast period. Rise in number of private clinics, coupled with increase in number of plastic surgeons, is expected to enhance the growth of this segment. These clinics are anticipated to conduct the breast implant procedures in a very short time span, which is preferable by the majority of the patients, and this is anticipated to drive the demand for these procedures in the coming years. Moreover, the availability of advanced products and skilled resources will increase the adoption of breast implantation processes at the clinics, which will thereby enhance the market revenue generated through the clinics in the forthcoming period.
Breast Implants Market

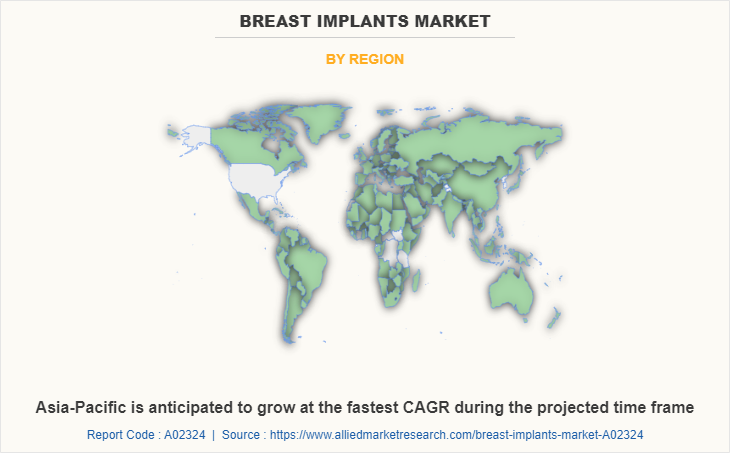
By region, North America dominated the global market in 2021 and is projected to remain the fastest-growing sub-segment during the forecast period. The high share attained by this region can be majorly attributed to the rise in the number of breast augmentation processes. Furthermore, increase in adoption of cosmetic procedures will further augment the region’s market growth. Moreover, the availability of reimbursement policies with respect to breast reconstruction is further boosting the North American breast implants market. In the last two decades, there has been a significant rise in the incidence rate of breast cancer in this region, thus further adding to the global breast implant market growth.
Impact of COVID-19 on the Global Breast implant Industry

  • The COVID-19 outbreak had a short-term impact on the breast implant market. Surgeries such as breast implants and cheek augmentation procedures were considered ‘non-essential’ during the pandemic and were either postponed or cancelled. Priority was given to COVID-infected patients, thus the breast implant surgeries were temporarily not prioritized.
  • According to the American Society of Plastic Surgeons' April 2021 survey report, women in the U.S. had a greater interest in and desire for cosmetic operations during the COVID-19 pandemic, including breast augmentation and implants, with 11% of polled women indicating that they are likely to have surgery post pandemic. Therefore, the market is expected to recover soon from the impact of the COVID-19 pandemic and grow in the future.

Key Benefits For Stakeholders

  • This report provides a quantitative analysis of the breast implants market size, segments, current trends, estimations, and dynamics of the breast implants market analysis from 2021 to 2031 to identify the prevailing breast implants market opportunities.
  • The market research is offered along with information related to breast implants market forecast, key drivers, restraints, and opportunities.
  • Porter's five forces analysis highlights the potency of buyers and suppliers to enable stakeholders make profit-oriented business decisions and strengthen their supplier-buyer network.
  • In-depth analysis of the breast implants market segmentation assists to determine the prevailing market opportunities.
  • Major countries in each region are mapped according to their revenue contribution to the global market.
  • Market player positioning facilitates benchmarking and provides a clear understanding of the present breast implants market share of the key players.
  • The report includes the analysis of the regional as well as global breast implants market trends, key players, market segments, application areas, and market growth strategies.

Breast Implants Market Report Highlights

Aspects Details
Market Size By 2031 USD 4.5 billion
Growth Rate CAGR of 9.4%
Forecast period 2021 - 2031
Report Pages 390
By Type
  • Silicone Implants
  • Saline Implants
By Shape
  • Round
  • Anatomical
By Texture
  • Smooth
  • Textured
By Application
  • Breast Augmentation
  • Breast Reconstruction
By End-use
  • Hospital
  • Clinics
By Region
  • North America  (U.S., Canada, Mexico)
  • Europe  (Germany, U.K., France, Spain, Italy, Rest of Europe)
  • Asia-Pacific  (China, Japan, India, South Korea, Australia, Rest of Asia-Pacific)
  • LAMEA  (Brazil, Saudi Arabia, United Arab Emirates, South Africa, Rest of LAMEA)
Key Market Players Establishment Labs S.A., Polytech Health and Aesthetics GmBH, Mentor Worldwide LLC, CEREPLAS, Groupe Sebbin SAS, Allergan plc, Sientra, Inc., HansBioMed, Laboratoires Arion, GC Aesthetics
 
  • CHAPTER 1:INTRODUCTION

    • 1.1.Report description

    • 1.2.Key market segments

    • 1.3.Key benefits to the stakeholders

    • 1.4.Research Methodology

      • 1.4.1.Secondary research

      • 1.4.2.Primary research

      • 1.4.3.Analyst tools and models

  • CHAPTER 2:EXECUTIVE SUMMARY

    • 2.1.Key findings of the study

    • 2.2.CXO Perspective

  • CHAPTER 3:MARKET OVERVIEW

    • 3.1.Market definition and scope

    • 3.2.Key findings

      • 3.2.1.Top investment pockets

    • 3.3.Porter’s five forces analysis

    • 3.4.Top player positioning

    • 3.5.Market dynamics

      • 3.5.1.Drivers

      • 3.5.2.Restraints

      • 3.5.3.Opportunities

    • 3.6.COVID-19 Impact Analysis on the market

    • 3.7.Value Chain Analysis

    • 3.8.Regulatory Guidelines

    • 3.9.Market Share Analysis

    • 3.10.Key Regulation Analysis

    • 3.11.Patent Landscape

  • CHAPTER 4: BREAST IMPLANTS MARKET, BY TYPE

    • 4.1 Overview

      • 4.1.1 Market size and forecast

    • 4.2 Silicone Implants

      • 4.2.1 Key market trends, growth factors and opportunities

      • 4.2.2 Market size and forecast, by region

      • 4.2.3 Market analysis by country

    • 4.3 Saline Implants

      • 4.3.1 Key market trends, growth factors and opportunities

      • 4.3.2 Market size and forecast, by region

      • 4.3.3 Market analysis by country

  • CHAPTER 5: BREAST IMPLANTS MARKET, BY SHAPE

    • 5.1 Overview

      • 5.1.1 Market size and forecast

    • 5.2 Round

      • 5.2.1 Key market trends, growth factors and opportunities

      • 5.2.2 Market size and forecast, by region

      • 5.2.3 Market analysis by country

    • 5.3 Anatomical

      • 5.3.1 Key market trends, growth factors and opportunities

      • 5.3.2 Market size and forecast, by region

      • 5.3.3 Market analysis by country

  • CHAPTER 6: BREAST IMPLANTS MARKET, BY TEXTURE

    • 6.1 Overview

      • 6.1.1 Market size and forecast

    • 6.2 Smooth

      • 6.2.1 Key market trends, growth factors and opportunities

      • 6.2.2 Market size and forecast, by region

      • 6.2.3 Market analysis by country

    • 6.3 Textured

      • 6.3.1 Key market trends, growth factors and opportunities

      • 6.3.2 Market size and forecast, by region

      • 6.3.3 Market analysis by country

  • CHAPTER 7: BREAST IMPLANTS MARKET, BY APPLICATION

    • 7.1 Overview

      • 7.1.1 Market size and forecast

    • 7.2 Breast Augmentation

      • 7.2.1 Key market trends, growth factors and opportunities

      • 7.2.2 Market size and forecast, by region

      • 7.2.3 Market analysis by country

    • 7.3 Breast Reconstruction

      • 7.3.1 Key market trends, growth factors and opportunities

      • 7.3.2 Market size and forecast, by region

      • 7.3.3 Market analysis by country

  • CHAPTER 8: BREAST IMPLANTS MARKET, BY END-USE

    • 8.1 Overview

      • 8.1.1 Market size and forecast

    • 8.2 Hospital

      • 8.2.1 Key market trends, growth factors and opportunities

      • 8.2.2 Market size and forecast, by region

      • 8.2.3 Market analysis by country

    • 8.3 Clinics

      • 8.3.1 Key market trends, growth factors and opportunities

      • 8.3.2 Market size and forecast, by region

      • 8.3.3 Market analysis by country

  • CHAPTER 9: BREAST IMPLANTS MARKET, BY REGION

    • 9.1 Overview

      • 9.1.1 Market size and forecast

    • 9.2 North America

      • 9.2.1 Key trends and opportunities

      • 9.2.2 North America Market size and forecast, by Type

      • 9.2.3 North America Market size and forecast, by Shape

      • 9.2.4 North America Market size and forecast, by Texture

      • 9.2.5 North America Market size and forecast, by Application

      • 9.2.6 North America Market size and forecast, by End-use

      • 9.2.7 North America Market size and forecast, by country

        • 9.2.7.1 U.S.
          • 9.2.7.1.1 Market size and forecast, by Type
          • 9.2.7.1.2 Market size and forecast, by Shape
          • 9.2.7.1.3 Market size and forecast, by Texture
          • 9.2.7.1.4 Market size and forecast, by Application
          • 9.2.7.1.5 Market size and forecast, by End-use
        • 9.2.7.2 Canada
          • 9.2.7.2.1 Market size and forecast, by Type
          • 9.2.7.2.2 Market size and forecast, by Shape
          • 9.2.7.2.3 Market size and forecast, by Texture
          • 9.2.7.2.4 Market size and forecast, by Application
          • 9.2.7.2.5 Market size and forecast, by End-use
        • 9.2.7.3 Mexico
          • 9.2.7.3.1 Market size and forecast, by Type
          • 9.2.7.3.2 Market size and forecast, by Shape
          • 9.2.7.3.3 Market size and forecast, by Texture
          • 9.2.7.3.4 Market size and forecast, by Application
          • 9.2.7.3.5 Market size and forecast, by End-use
    • 9.3 Europe

      • 9.3.1 Key trends and opportunities

      • 9.3.2 Europe Market size and forecast, by Type

      • 9.3.3 Europe Market size and forecast, by Shape

      • 9.3.4 Europe Market size and forecast, by Texture

      • 9.3.5 Europe Market size and forecast, by Application

      • 9.3.6 Europe Market size and forecast, by End-use

      • 9.3.7 Europe Market size and forecast, by country

        • 9.3.7.1 Germany
          • 9.3.7.1.1 Market size and forecast, by Type
          • 9.3.7.1.2 Market size and forecast, by Shape
          • 9.3.7.1.3 Market size and forecast, by Texture
          • 9.3.7.1.4 Market size and forecast, by Application
          • 9.3.7.1.5 Market size and forecast, by End-use
        • 9.3.7.2 U.K.
          • 9.3.7.2.1 Market size and forecast, by Type
          • 9.3.7.2.2 Market size and forecast, by Shape
          • 9.3.7.2.3 Market size and forecast, by Texture
          • 9.3.7.2.4 Market size and forecast, by Application
          • 9.3.7.2.5 Market size and forecast, by End-use
        • 9.3.7.3 France
          • 9.3.7.3.1 Market size and forecast, by Type
          • 9.3.7.3.2 Market size and forecast, by Shape
          • 9.3.7.3.3 Market size and forecast, by Texture
          • 9.3.7.3.4 Market size and forecast, by Application
          • 9.3.7.3.5 Market size and forecast, by End-use
        • 9.3.7.4 Spain
          • 9.3.7.4.1 Market size and forecast, by Type
          • 9.3.7.4.2 Market size and forecast, by Shape
          • 9.3.7.4.3 Market size and forecast, by Texture
          • 9.3.7.4.4 Market size and forecast, by Application
          • 9.3.7.4.5 Market size and forecast, by End-use
        • 9.3.7.5 Italy
          • 9.3.7.5.1 Market size and forecast, by Type
          • 9.3.7.5.2 Market size and forecast, by Shape
          • 9.3.7.5.3 Market size and forecast, by Texture
          • 9.3.7.5.4 Market size and forecast, by Application
          • 9.3.7.5.5 Market size and forecast, by End-use
        • 9.3.7.6 Rest of Europe
          • 9.3.7.6.1 Market size and forecast, by Type
          • 9.3.7.6.2 Market size and forecast, by Shape
          • 9.3.7.6.3 Market size and forecast, by Texture
          • 9.3.7.6.4 Market size and forecast, by Application
          • 9.3.7.6.5 Market size and forecast, by End-use
    • 9.4 Asia-Pacific

      • 9.4.1 Key trends and opportunities

      • 9.4.2 Asia-Pacific Market size and forecast, by Type

      • 9.4.3 Asia-Pacific Market size and forecast, by Shape

      • 9.4.4 Asia-Pacific Market size and forecast, by Texture

      • 9.4.5 Asia-Pacific Market size and forecast, by Application

      • 9.4.6 Asia-Pacific Market size and forecast, by End-use

      • 9.4.7 Asia-Pacific Market size and forecast, by country

        • 9.4.7.1 China
          • 9.4.7.1.1 Market size and forecast, by Type
          • 9.4.7.1.2 Market size and forecast, by Shape
          • 9.4.7.1.3 Market size and forecast, by Texture
          • 9.4.7.1.4 Market size and forecast, by Application
          • 9.4.7.1.5 Market size and forecast, by End-use
        • 9.4.7.2 Japan
          • 9.4.7.2.1 Market size and forecast, by Type
          • 9.4.7.2.2 Market size and forecast, by Shape
          • 9.4.7.2.3 Market size and forecast, by Texture
          • 9.4.7.2.4 Market size and forecast, by Application
          • 9.4.7.2.5 Market size and forecast, by End-use
        • 9.4.7.3 India
          • 9.4.7.3.1 Market size and forecast, by Type
          • 9.4.7.3.2 Market size and forecast, by Shape
          • 9.4.7.3.3 Market size and forecast, by Texture
          • 9.4.7.3.4 Market size and forecast, by Application
          • 9.4.7.3.5 Market size and forecast, by End-use
        • 9.4.7.4 South Korea
          • 9.4.7.4.1 Market size and forecast, by Type
          • 9.4.7.4.2 Market size and forecast, by Shape
          • 9.4.7.4.3 Market size and forecast, by Texture
          • 9.4.7.4.4 Market size and forecast, by Application
          • 9.4.7.4.5 Market size and forecast, by End-use
        • 9.4.7.5 Australia
          • 9.4.7.5.1 Market size and forecast, by Type
          • 9.4.7.5.2 Market size and forecast, by Shape
          • 9.4.7.5.3 Market size and forecast, by Texture
          • 9.4.7.5.4 Market size and forecast, by Application
          • 9.4.7.5.5 Market size and forecast, by End-use
        • 9.4.7.6 Rest of Asia-Pacific
          • 9.4.7.6.1 Market size and forecast, by Type
          • 9.4.7.6.2 Market size and forecast, by Shape
          • 9.4.7.6.3 Market size and forecast, by Texture
          • 9.4.7.6.4 Market size and forecast, by Application
          • 9.4.7.6.5 Market size and forecast, by End-use
    • 9.5 LAMEA

      • 9.5.1 Key trends and opportunities

      • 9.5.2 LAMEA Market size and forecast, by Type

      • 9.5.3 LAMEA Market size and forecast, by Shape

      • 9.5.4 LAMEA Market size and forecast, by Texture

      • 9.5.5 LAMEA Market size and forecast, by Application

      • 9.5.6 LAMEA Market size and forecast, by End-use

      • 9.5.7 LAMEA Market size and forecast, by country

        • 9.5.7.1 Brazil
          • 9.5.7.1.1 Market size and forecast, by Type
          • 9.5.7.1.2 Market size and forecast, by Shape
          • 9.5.7.1.3 Market size and forecast, by Texture
          • 9.5.7.1.4 Market size and forecast, by Application
          • 9.5.7.1.5 Market size and forecast, by End-use
        • 9.5.7.2 Saudi Arabia
          • 9.5.7.2.1 Market size and forecast, by Type
          • 9.5.7.2.2 Market size and forecast, by Shape
          • 9.5.7.2.3 Market size and forecast, by Texture
          • 9.5.7.2.4 Market size and forecast, by Application
          • 9.5.7.2.5 Market size and forecast, by End-use
        • 9.5.7.3 United Arab Emirates
          • 9.5.7.3.1 Market size and forecast, by Type
          • 9.5.7.3.2 Market size and forecast, by Shape
          • 9.5.7.3.3 Market size and forecast, by Texture
          • 9.5.7.3.4 Market size and forecast, by Application
          • 9.5.7.3.5 Market size and forecast, by End-use
        • 9.5.7.4 South Africa
          • 9.5.7.4.1 Market size and forecast, by Type
          • 9.5.7.4.2 Market size and forecast, by Shape
          • 9.5.7.4.3 Market size and forecast, by Texture
          • 9.5.7.4.4 Market size and forecast, by Application
          • 9.5.7.4.5 Market size and forecast, by End-use
        • 9.5.7.5 Rest of LAMEA
          • 9.5.7.5.1 Market size and forecast, by Type
          • 9.5.7.5.2 Market size and forecast, by Shape
          • 9.5.7.5.3 Market size and forecast, by Texture
          • 9.5.7.5.4 Market size and forecast, by Application
          • 9.5.7.5.5 Market size and forecast, by End-use
  • CHAPTER 10: COMPANY LANDSCAPE

    • 10.1. Introduction

    • 10.2. Top winning strategies

    • 10.3. Product Mapping of Top 10 Player

    • 10.4. Competitive Dashboard

    • 10.5. Competitive Heatmap

    • 10.6. Key developments

  • CHAPTER 11: COMPANY PROFILES

    • 11.1 Allergan plc

      • 11.1.1 Company overview

      • 11.1.2 Company snapshot

      • 11.1.3 Operating business segments

      • 11.1.4 Product portfolio

      • 11.1.5 Business performance

      • 11.1.6 Key strategic moves and developments

    • 11.2 Mentor Worldwide LLC

      • 11.2.1 Company overview

      • 11.2.2 Company snapshot

      • 11.2.3 Operating business segments

      • 11.2.4 Product portfolio

      • 11.2.5 Business performance

      • 11.2.6 Key strategic moves and developments

    • 11.3 HansBioMed

      • 11.3.1 Company overview

      • 11.3.2 Company snapshot

      • 11.3.3 Operating business segments

      • 11.3.4 Product portfolio

      • 11.3.5 Business performance

      • 11.3.6 Key strategic moves and developments

    • 11.4 Establishment Labs S.A.

      • 11.4.1 Company overview

      • 11.4.2 Company snapshot

      • 11.4.3 Operating business segments

      • 11.4.4 Product portfolio

      • 11.4.5 Business performance

      • 11.4.6 Key strategic moves and developments

    • 11.5 Polytech Health and Aesthetics GmBH

      • 11.5.1 Company overview

      • 11.5.2 Company snapshot

      • 11.5.3 Operating business segments

      • 11.5.4 Product portfolio

      • 11.5.5 Business performance

      • 11.5.6 Key strategic moves and developments

    • 11.6 Sientra, Inc.

      • 11.6.1 Company overview

      • 11.6.2 Company snapshot

      • 11.6.3 Operating business segments

      • 11.6.4 Product portfolio

      • 11.6.5 Business performance

      • 11.6.6 Key strategic moves and developments

    • 11.7 GC Aesthetics

      • 11.7.1 Company overview

      • 11.7.2 Company snapshot

      • 11.7.3 Operating business segments

      • 11.7.4 Product portfolio

      • 11.7.5 Business performance

      • 11.7.6 Key strategic moves and developments

    • 11.8 CEREPLAS

      • 11.8.1 Company overview

      • 11.8.2 Company snapshot

      • 11.8.3 Operating business segments

      • 11.8.4 Product portfolio

      • 11.8.5 Business performance

      • 11.8.6 Key strategic moves and developments

    • 11.9 Laboratoires Arion

      • 11.9.1 Company overview

      • 11.9.2 Company snapshot

      • 11.9.3 Operating business segments

      • 11.9.4 Product portfolio

      • 11.9.5 Business performance

      • 11.9.6 Key strategic moves and developments

    • 11.10 Groupe Sebbin SAS

      • 11.10.1 Company overview

      • 11.10.2 Company snapshot

      • 11.10.3 Operating business segments

      • 11.10.4 Product portfolio

      • 11.10.5 Business performance

      • 11.10.6 Key strategic moves and developments

  • LIST OF TABLES

  • TABLE 1. GLOBAL BREAST IMPLANTS MARKET, BY TYPE, 2021-2031 ($MILLION)
    TABLE 2. BREAST IMPLANTS MARKET SIZE, FOR SILICONE IMPLANTS, BY REGION, 2021-2031 ($MILLION)
    TABLE 3. BREAST IMPLANTS MARKET FOR SILICONE IMPLANTS BY COUNTRY, 2021-2031 ($MILLION)
    TABLE 4. BREAST IMPLANTS MARKET SIZE, FOR SALINE IMPLANTS, BY REGION, 2021-2031 ($MILLION)
    TABLE 5. BREAST IMPLANTS MARKET FOR SALINE IMPLANTS BY COUNTRY, 2021-2031 ($MILLION)
    TABLE 6. GLOBAL BREAST IMPLANTS MARKET, BY SHAPE, 2021-2031 ($MILLION)
    TABLE 7. BREAST IMPLANTS MARKET SIZE, FOR ROUND, BY REGION, 2021-2031 ($MILLION)
    TABLE 8. BREAST IMPLANTS MARKET FOR ROUND BY COUNTRY, 2021-2031 ($MILLION)
    TABLE 9. BREAST IMPLANTS MARKET SIZE, FOR ANATOMICAL, BY REGION, 2021-2031 ($MILLION)
    TABLE 10. BREAST IMPLANTS MARKET FOR ANATOMICAL BY COUNTRY, 2021-2031 ($MILLION)
    TABLE 11. GLOBAL BREAST IMPLANTS MARKET, BY TEXTURE, 2021-2031 ($MILLION)
    TABLE 12. BREAST IMPLANTS MARKET SIZE, FOR SMOOTH, BY REGION, 2021-2031 ($MILLION)
    TABLE 13. BREAST IMPLANTS MARKET FOR SMOOTH BY COUNTRY, 2021-2031 ($MILLION)
    TABLE 14. BREAST IMPLANTS MARKET SIZE, FOR TEXTURED, BY REGION, 2021-2031 ($MILLION)
    TABLE 15. BREAST IMPLANTS MARKET FOR TEXTURED BY COUNTRY, 2021-2031 ($MILLION)
    TABLE 16. GLOBAL BREAST IMPLANTS MARKET, BY APPLICATION, 2021-2031 ($MILLION)
    TABLE 17. BREAST IMPLANTS MARKET SIZE, FOR BREAST AUGMENTATION, BY REGION, 2021-2031 ($MILLION)
    TABLE 18. BREAST IMPLANTS MARKET FOR BREAST AUGMENTATION BY COUNTRY, 2021-2031 ($MILLION)
    TABLE 19. BREAST IMPLANTS MARKET SIZE, FOR BREAST RECONSTRUCTION, BY REGION, 2021-2031 ($MILLION)
    TABLE 20. BREAST IMPLANTS MARKET FOR BREAST RECONSTRUCTION BY COUNTRY, 2021-2031 ($MILLION)
    TABLE 21. GLOBAL BREAST IMPLANTS MARKET, BY END-USE, 2021-2031 ($MILLION)
    TABLE 22. BREAST IMPLANTS MARKET SIZE, FOR HOSPITAL, BY REGION, 2021-2031 ($MILLION)
    TABLE 23. BREAST IMPLANTS MARKET FOR HOSPITAL BY COUNTRY, 2021-2031 ($MILLION)
    TABLE 24. BREAST IMPLANTS MARKET SIZE, FOR CLINICS, BY REGION, 2021-2031 ($MILLION)
    TABLE 25. BREAST IMPLANTS MARKET FOR CLINICS BY COUNTRY, 2021-2031 ($MILLION)
    TABLE 26. BREAST IMPLANTS MARKET, BY REGION, 2021-2031 ($MILLION)
    TABLE 27. NORTH AMERICA BREAST IMPLANTS MARKET, BY TYPE, 2021-2031 ($MILLION)
    TABLE 28. NORTH AMERICA BREAST IMPLANTS MARKET, BY SHAPE, 2021-2031 ($MILLION)
    TABLE 29. NORTH AMERICA BREAST IMPLANTS MARKET, BY TEXTURE, 2021-2031 ($MILLION)
    TABLE 30. NORTH AMERICA BREAST IMPLANTS MARKET, BY APPLICATION, 2021-2031 ($MILLION)
    TABLE 31. NORTH AMERICA BREAST IMPLANTS MARKET, BY END-USE, 2021-2031 ($MILLION)
    TABLE 32. NORTH AMERICA BREAST IMPLANTS MARKET, BY COUNTRY, 2021-2031 ($MILLION)
    TABLE 33. U.S. BREAST IMPLANTS MARKET, BY TYPE, 2021-2031 ($MILLION)
    TABLE 34. U.S. BREAST IMPLANTS MARKET, BY SHAPE, 2021-2031 ($MILLION)
    TABLE 35. U.S. BREAST IMPLANTS MARKET, BY TEXTURE, 2021-2031 ($MILLION)
    TABLE 36. U.S. BREAST IMPLANTS MARKET, BY APPLICATION, 2021-2031 ($MILLION)
    TABLE 37. U.S. BREAST IMPLANTS MARKET, BY END-USE, 2021-2031 ($MILLION)
    TABLE 38. CANADA BREAST IMPLANTS MARKET, BY TYPE, 2021-2031 ($MILLION)
    TABLE 39. CANADA BREAST IMPLANTS MARKET, BY SHAPE, 2021-2031 ($MILLION)
    TABLE 40. CANADA BREAST IMPLANTS MARKET, BY TEXTURE, 2021-2031 ($MILLION)
    TABLE 41. CANADA BREAST IMPLANTS MARKET, BY APPLICATION, 2021-2031 ($MILLION)
    TABLE 42. CANADA BREAST IMPLANTS MARKET, BY END-USE, 2021-2031 ($MILLION)
    TABLE 43. MEXICO BREAST IMPLANTS MARKET, BY TYPE, 2021-2031 ($MILLION)
    TABLE 44. MEXICO BREAST IMPLANTS MARKET, BY SHAPE, 2021-2031 ($MILLION)
    TABLE 45. MEXICO BREAST IMPLANTS MARKET, BY TEXTURE, 2021-2031 ($MILLION)
    TABLE 46. MEXICO BREAST IMPLANTS MARKET, BY APPLICATION, 2021-2031 ($MILLION)
    TABLE 47. MEXICO BREAST IMPLANTS MARKET, BY END-USE, 2021-2031 ($MILLION)
    TABLE 48. EUROPE BREAST IMPLANTS MARKET, BY TYPE, 2021-2031 ($MILLION)
    TABLE 49. EUROPE BREAST IMPLANTS MARKET, BY SHAPE, 2021-2031 ($MILLION)
    TABLE 50. EUROPE BREAST IMPLANTS MARKET, BY TEXTURE, 2021-2031 ($MILLION)
    TABLE 51. EUROPE BREAST IMPLANTS MARKET, BY APPLICATION, 2021-2031 ($MILLION)
    TABLE 52. EUROPE BREAST IMPLANTS MARKET, BY END-USE, 2021-2031 ($MILLION)
    TABLE 53. EUROPE BREAST IMPLANTS MARKET, BY COUNTRY, 2021-2031 ($MILLION)
    TABLE 54. GERMANY BREAST IMPLANTS MARKET, BY TYPE, 2021-2031 ($MILLION)
    TABLE 55. GERMANY BREAST IMPLANTS MARKET, BY SHAPE, 2021-2031 ($MILLION)
    TABLE 56. GERMANY BREAST IMPLANTS MARKET, BY TEXTURE, 2021-2031 ($MILLION)
    TABLE 57. GERMANY BREAST IMPLANTS MARKET, BY APPLICATION, 2021-2031 ($MILLION)
    TABLE 58. GERMANY BREAST IMPLANTS MARKET, BY END-USE, 2021-2031 ($MILLION)
    TABLE 59. U.K. BREAST IMPLANTS MARKET, BY TYPE, 2021-2031 ($MILLION)
    TABLE 60. U.K. BREAST IMPLANTS MARKET, BY SHAPE, 2021-2031 ($MILLION)
    TABLE 61. U.K. BREAST IMPLANTS MARKET, BY TEXTURE, 2021-2031 ($MILLION)
    TABLE 62. U.K. BREAST IMPLANTS MARKET, BY APPLICATION, 2021-2031 ($MILLION)
    TABLE 63. U.K. BREAST IMPLANTS MARKET, BY END-USE, 2021-2031 ($MILLION)
    TABLE 64. FRANCE BREAST IMPLANTS MARKET, BY TYPE, 2021-2031 ($MILLION)
    TABLE 65. FRANCE BREAST IMPLANTS MARKET, BY SHAPE, 2021-2031 ($MILLION)
    TABLE 66. FRANCE BREAST IMPLANTS MARKET, BY TEXTURE, 2021-2031 ($MILLION)
    TABLE 67. FRANCE BREAST IMPLANTS MARKET, BY APPLICATION, 2021-2031 ($MILLION)
    TABLE 68. FRANCE BREAST IMPLANTS MARKET, BY END-USE, 2021-2031 ($MILLION)
    TABLE 69. SPAIN BREAST IMPLANTS MARKET, BY TYPE, 2021-2031 ($MILLION)
    TABLE 70. SPAIN BREAST IMPLANTS MARKET, BY SHAPE, 2021-2031 ($MILLION)
    TABLE 71. SPAIN BREAST IMPLANTS MARKET, BY TEXTURE, 2021-2031 ($MILLION)
    TABLE 72. SPAIN BREAST IMPLANTS MARKET, BY APPLICATION, 2021-2031 ($MILLION)
    TABLE 73. SPAIN BREAST IMPLANTS MARKET, BY END-USE, 2021-2031 ($MILLION)
    TABLE 74. ITALY BREAST IMPLANTS MARKET, BY TYPE, 2021-2031 ($MILLION)
    TABLE 75. ITALY BREAST IMPLANTS MARKET, BY SHAPE, 2021-2031 ($MILLION)
    TABLE 76. ITALY BREAST IMPLANTS MARKET, BY TEXTURE, 2021-2031 ($MILLION)
    TABLE 77. ITALY BREAST IMPLANTS MARKET, BY APPLICATION, 2021-2031 ($MILLION)
    TABLE 78. ITALY BREAST IMPLANTS MARKET, BY END-USE, 2021-2031 ($MILLION)
    TABLE 79. REST OF EUROPE BREAST IMPLANTS MARKET, BY TYPE, 2021-2031 ($MILLION)
    TABLE 80. REST OF EUROPE BREAST IMPLANTS MARKET, BY SHAPE, 2021-2031 ($MILLION)
    TABLE 81. REST OF EUROPE BREAST IMPLANTS MARKET, BY TEXTURE, 2021-2031 ($MILLION)
    TABLE 82. REST OF EUROPE BREAST IMPLANTS MARKET, BY APPLICATION, 2021-2031 ($MILLION)
    TABLE 83. REST OF EUROPE BREAST IMPLANTS MARKET, BY END-USE, 2021-2031 ($MILLION)
    TABLE 84. ASIA-PACIFIC BREAST IMPLANTS MARKET, BY TYPE, 2021-2031 ($MILLION)
    TABLE 85. ASIA-PACIFIC BREAST IMPLANTS MARKET, BY SHAPE, 2021-2031 ($MILLION)
    TABLE 86. ASIA-PACIFIC BREAST IMPLANTS MARKET, BY TEXTURE, 2021-2031 ($MILLION)
    TABLE 87. ASIA-PACIFIC BREAST IMPLANTS MARKET, BY APPLICATION, 2021-2031 ($MILLION)
    TABLE 88. ASIA-PACIFIC BREAST IMPLANTS MARKET, BY END-USE, 2021-2031 ($MILLION)
    TABLE 89. ASIA-PACIFIC BREAST IMPLANTS MARKET, BY COUNTRY, 2021-2031 ($MILLION)
    TABLE 90. CHINA BREAST IMPLANTS MARKET, BY TYPE, 2021-2031 ($MILLION)
    TABLE 91. CHINA BREAST IMPLANTS MARKET, BY SHAPE, 2021-2031 ($MILLION)
    TABLE 92. CHINA BREAST IMPLANTS MARKET, BY TEXTURE, 2021-2031 ($MILLION)
    TABLE 93. CHINA BREAST IMPLANTS MARKET, BY APPLICATION, 2021-2031 ($MILLION)
    TABLE 94. CHINA BREAST IMPLANTS MARKET, BY END-USE, 2021-2031 ($MILLION)
    TABLE 95. JAPAN BREAST IMPLANTS MARKET, BY TYPE, 2021-2031 ($MILLION)
    TABLE 96. JAPAN BREAST IMPLANTS MARKET, BY SHAPE, 2021-2031 ($MILLION)
    TABLE 97. JAPAN BREAST IMPLANTS MARKET, BY TEXTURE, 2021-2031 ($MILLION)
    TABLE 98. JAPAN BREAST IMPLANTS MARKET, BY APPLICATION, 2021-2031 ($MILLION)
    TABLE 99. JAPAN BREAST IMPLANTS MARKET, BY END-USE, 2021-2031 ($MILLION)
    TABLE 100. INDIA BREAST IMPLANTS MARKET, BY TYPE, 2021-2031 ($MILLION)
    TABLE 101. INDIA BREAST IMPLANTS MARKET, BY SHAPE, 2021-2031 ($MILLION)
    TABLE 102. INDIA BREAST IMPLANTS MARKET, BY TEXTURE, 2021-2031 ($MILLION)
    TABLE 103. INDIA BREAST IMPLANTS MARKET, BY APPLICATION, 2021-2031 ($MILLION)
    TABLE 104. INDIA BREAST IMPLANTS MARKET, BY END-USE, 2021-2031 ($MILLION)
    TABLE 105. SOUTH KOREA BREAST IMPLANTS MARKET, BY TYPE, 2021-2031 ($MILLION)
    TABLE 106. SOUTH KOREA BREAST IMPLANTS MARKET, BY SHAPE, 2021-2031 ($MILLION)
    TABLE 107. SOUTH KOREA BREAST IMPLANTS MARKET, BY TEXTURE, 2021-2031 ($MILLION)
    TABLE 108. SOUTH KOREA BREAST IMPLANTS MARKET, BY APPLICATION, 2021-2031 ($MILLION)
    TABLE 109. SOUTH KOREA BREAST IMPLANTS MARKET, BY END-USE, 2021-2031 ($MILLION)
    TABLE 110. AUSTRALIA BREAST IMPLANTS MARKET, BY TYPE, 2021-2031 ($MILLION)
    TABLE 111. AUSTRALIA BREAST IMPLANTS MARKET, BY SHAPE, 2021-2031 ($MILLION)
    TABLE 112. AUSTRALIA BREAST IMPLANTS MARKET, BY TEXTURE, 2021-2031 ($MILLION)
    TABLE 113. AUSTRALIA BREAST IMPLANTS MARKET, BY APPLICATION, 2021-2031 ($MILLION)
    TABLE 114. AUSTRALIA BREAST IMPLANTS MARKET, BY END-USE, 2021-2031 ($MILLION)
    TABLE 115. REST OF ASIA-PACIFIC BREAST IMPLANTS MARKET, BY TYPE, 2021-2031 ($MILLION)
    TABLE 116. REST OF ASIA-PACIFIC BREAST IMPLANTS MARKET, BY SHAPE, 2021-2031 ($MILLION)
    TABLE 117. REST OF ASIA-PACIFIC BREAST IMPLANTS MARKET, BY TEXTURE, 2021-2031 ($MILLION)
    TABLE 118. REST OF ASIA-PACIFIC BREAST IMPLANTS MARKET, BY APPLICATION, 2021-2031 ($MILLION)
    TABLE 119. REST OF ASIA-PACIFIC BREAST IMPLANTS MARKET, BY END-USE, 2021-2031 ($MILLION)
    TABLE 120. LAMEA BREAST IMPLANTS MARKET, BY TYPE, 2021-2031 ($MILLION)
    TABLE 121. LAMEA BREAST IMPLANTS MARKET, BY SHAPE, 2021-2031 ($MILLION)
    TABLE 122. LAMEA BREAST IMPLANTS MARKET, BY TEXTURE, 2021-2031 ($MILLION)
    TABLE 123. LAMEA BREAST IMPLANTS MARKET, BY APPLICATION, 2021-2031 ($MILLION)
    TABLE 124. LAMEA BREAST IMPLANTS MARKET, BY END-USE, 2021-2031 ($MILLION)
    TABLE 125. LAMEA BREAST IMPLANTS MARKET, BY COUNTRY, 2021-2031 ($MILLION)
    TABLE 126. BRAZIL BREAST IMPLANTS MARKET, BY TYPE, 2021-2031 ($MILLION)
    TABLE 127. BRAZIL BREAST IMPLANTS MARKET, BY SHAPE, 2021-2031 ($MILLION)
    TABLE 128. BRAZIL BREAST IMPLANTS MARKET, BY TEXTURE, 2021-2031 ($MILLION)
    TABLE 129. BRAZIL BREAST IMPLANTS MARKET, BY APPLICATION, 2021-2031 ($MILLION)
    TABLE 130. BRAZIL BREAST IMPLANTS MARKET, BY END-USE, 2021-2031 ($MILLION)
    TABLE 131. SAUDI ARABIA BREAST IMPLANTS MARKET, BY TYPE, 2021-2031 ($MILLION)
    TABLE 132. SAUDI ARABIA BREAST IMPLANTS MARKET, BY SHAPE, 2021-2031 ($MILLION)
    TABLE 133. SAUDI ARABIA BREAST IMPLANTS MARKET, BY TEXTURE, 2021-2031 ($MILLION)
    TABLE 134. SAUDI ARABIA BREAST IMPLANTS MARKET, BY APPLICATION, 2021-2031 ($MILLION)
    TABLE 135. SAUDI ARABIA BREAST IMPLANTS MARKET, BY END-USE, 2021-2031 ($MILLION)
    TABLE 136. UNITED ARAB EMIRATES BREAST IMPLANTS MARKET, BY TYPE, 2021-2031 ($MILLION)
    TABLE 137. UNITED ARAB EMIRATES BREAST IMPLANTS MARKET, BY SHAPE, 2021-2031 ($MILLION)
    TABLE 138. UNITED ARAB EMIRATES BREAST IMPLANTS MARKET, BY TEXTURE, 2021-2031 ($MILLION)
    TABLE 139. UNITED ARAB EMIRATES BREAST IMPLANTS MARKET, BY APPLICATION, 2021-2031 ($MILLION)
    TABLE 140. UNITED ARAB EMIRATES BREAST IMPLANTS MARKET, BY END-USE, 2021-2031 ($MILLION)
    TABLE 141. SOUTH AFRICA BREAST IMPLANTS MARKET, BY TYPE, 2021-2031 ($MILLION)
    TABLE 142. SOUTH AFRICA BREAST IMPLANTS MARKET, BY SHAPE, 2021-2031 ($MILLION)
    TABLE 143. SOUTH AFRICA BREAST IMPLANTS MARKET, BY TEXTURE, 2021-2031 ($MILLION)
    TABLE 144. SOUTH AFRICA BREAST IMPLANTS MARKET, BY APPLICATION, 2021-2031 ($MILLION)
    TABLE 145. SOUTH AFRICA BREAST IMPLANTS MARKET, BY END-USE, 2021-2031 ($MILLION)
    TABLE 146. REST OF LAMEA BREAST IMPLANTS MARKET, BY TYPE, 2021-2031 ($MILLION)
    TABLE 147. REST OF LAMEA BREAST IMPLANTS MARKET, BY SHAPE, 2021-2031 ($MILLION)
    TABLE 148. REST OF LAMEA BREAST IMPLANTS MARKET, BY TEXTURE, 2021-2031 ($MILLION)
    TABLE 149. REST OF LAMEA BREAST IMPLANTS MARKET, BY APPLICATION, 2021-2031 ($MILLION)
    TABLE 150. REST OF LAMEA BREAST IMPLANTS MARKET, BY END-USE, 2021-2031 ($MILLION)
    TABLE 151.ALLERGAN PLC: COMPANY SNAPSHOT
    TABLE 152.ALLERGAN PLC: OPERATING SEGMENTS
    TABLE 153.ALLERGAN PLC: PRODUCT PORTFOLIO
    TABLE 154.ALLERGAN PLC: NET SALES,
    TABLE 155.ALLERGAN PLC: KEY STRATERGIES
    TABLE 156.MENTOR WORLDWIDE LLC: COMPANY SNAPSHOT
    TABLE 157.MENTOR WORLDWIDE LLC: OPERATING SEGMENTS
    TABLE 158.MENTOR WORLDWIDE LLC: PRODUCT PORTFOLIO
    TABLE 159.MENTOR WORLDWIDE LLC: NET SALES,
    TABLE 160.MENTOR WORLDWIDE LLC: KEY STRATERGIES
    TABLE 161.HANSBIOMED: COMPANY SNAPSHOT
    TABLE 162.HANSBIOMED: OPERATING SEGMENTS
    TABLE 163.HANSBIOMED: PRODUCT PORTFOLIO
    TABLE 164.HANSBIOMED: NET SALES,
    TABLE 165.HANSBIOMED: KEY STRATERGIES
    TABLE 166.ESTABLISHMENT LABS S.A.: COMPANY SNAPSHOT
    TABLE 167.ESTABLISHMENT LABS S.A.: OPERATING SEGMENTS
    TABLE 168.ESTABLISHMENT LABS S.A.: PRODUCT PORTFOLIO
    TABLE 169.ESTABLISHMENT LABS S.A.: NET SALES,
    TABLE 170.ESTABLISHMENT LABS S.A.: KEY STRATERGIES
    TABLE 171.POLYTECH HEALTH AND AESTHETICS GMBH: COMPANY SNAPSHOT
    TABLE 172.POLYTECH HEALTH AND AESTHETICS GMBH: OPERATING SEGMENTS
    TABLE 173.POLYTECH HEALTH AND AESTHETICS GMBH: PRODUCT PORTFOLIO
    TABLE 174.POLYTECH HEALTH AND AESTHETICS GMBH: NET SALES,
    TABLE 175.POLYTECH HEALTH AND AESTHETICS GMBH: KEY STRATERGIES
    TABLE 176.SIENTRA, INC.: COMPANY SNAPSHOT
    TABLE 177.SIENTRA, INC.: OPERATING SEGMENTS
    TABLE 178.SIENTRA, INC.: PRODUCT PORTFOLIO
    TABLE 179.SIENTRA, INC.: NET SALES,
    TABLE 180.SIENTRA, INC.: KEY STRATERGIES
    TABLE 181.GC AESTHETICS: COMPANY SNAPSHOT
    TABLE 182.GC AESTHETICS: OPERATING SEGMENTS
    TABLE 183.GC AESTHETICS: PRODUCT PORTFOLIO
    TABLE 184.GC AESTHETICS: NET SALES,
    TABLE 185.GC AESTHETICS: KEY STRATERGIES
    TABLE 186.CEREPLAS: COMPANY SNAPSHOT
    TABLE 187.CEREPLAS: OPERATING SEGMENTS
    TABLE 188.CEREPLAS: PRODUCT PORTFOLIO
    TABLE 189.CEREPLAS: NET SALES,
    TABLE 190.CEREPLAS: KEY STRATERGIES
    TABLE 191.LABORATOIRES ARION: COMPANY SNAPSHOT
    TABLE 192.LABORATOIRES ARION: OPERATING SEGMENTS
    TABLE 193.LABORATOIRES ARION: PRODUCT PORTFOLIO
    TABLE 194.LABORATOIRES ARION: NET SALES,
    TABLE 195.LABORATOIRES ARION: KEY STRATERGIES
    TABLE 196.GROUPE SEBBIN SAS: COMPANY SNAPSHOT
    TABLE 197.GROUPE SEBBIN SAS: OPERATING SEGMENTS
    TABLE 198.GROUPE SEBBIN SAS: PRODUCT PORTFOLIO
    TABLE 199.GROUPE SEBBIN SAS: NET SALES,
    TABLE 200.GROUPE SEBBIN SAS: KEY STRATERGIES
  • LIST OF FIGURES

  • FIGURE 1.BREAST IMPLANTS MARKET SEGMENTATION
    FIGURE 2.BREAST IMPLANTS MARKET,2021-2031
    FIGURE 3.BREAST IMPLANTS MARKET,2021-2031
    FIGURE 4. TOP INVESTMENT POCKETS, BY REGION
    FIGURE 5.PORTER FIVE-1
    FIGURE 6.PORTER FIVE-2
    FIGURE 7.PORTER FIVE-3
    FIGURE 8.PORTER FIVE-4
    FIGURE 9.PORTER FIVE-5
    FIGURE 10.TOP PLAYER POSITIONING
    FIGURE 11.BREAST IMPLANTS MARKET:DRIVERS, RESTRAINTS AND OPPORTUNITIES
    FIGURE 12.VALUE CHAIN ANALYSIS
    FIGURE 13.REGULATORY GUIDELINES
    FIGURE 14.MARKET SHARE ANALYSIS
    FIGURE 15.KEY REGULATION ANALYSIS
    FIGURE 16.PATENT ANALYSIS BY COMPANY
    FIGURE 17.PATENT ANALYSIS BY COUNTRY
    FIGURE 18.BREAST IMPLANTS MARKET,BY TYPE,2021(%)
    FIGURE 19.COMPARATIVE SHARE ANALYSIS OF SILICONE IMPLANTS BREAST IMPLANTS MARKET,2021-2031(%)
    FIGURE 20.COMPARATIVE SHARE ANALYSIS OF SALINE IMPLANTS BREAST IMPLANTS MARKET,2021-2031(%)
    FIGURE 21.BREAST IMPLANTS MARKET,BY SHAPE,2021(%)
    FIGURE 22.COMPARATIVE SHARE ANALYSIS OF ROUND BREAST IMPLANTS MARKET,2021-2031(%)
    FIGURE 23.COMPARATIVE SHARE ANALYSIS OF ANATOMICAL BREAST IMPLANTS MARKET,2021-2031(%)
    FIGURE 24.BREAST IMPLANTS MARKET,BY TEXTURE,2021(%)
    FIGURE 25.COMPARATIVE SHARE ANALYSIS OF SMOOTH BREAST IMPLANTS MARKET,2021-2031(%)
    FIGURE 26.COMPARATIVE SHARE ANALYSIS OF TEXTURED BREAST IMPLANTS MARKET,2021-2031(%)
    FIGURE 27.BREAST IMPLANTS MARKET,BY APPLICATION,2021(%)
    FIGURE 28.COMPARATIVE SHARE ANALYSIS OF BREAST AUGMENTATION BREAST IMPLANTS MARKET,2021-2031(%)
    FIGURE 29.COMPARATIVE SHARE ANALYSIS OF BREAST RECONSTRUCTION BREAST IMPLANTS MARKET,2021-2031(%)
    FIGURE 30.BREAST IMPLANTS MARKET,BY END-USE,2021(%)
    FIGURE 31.COMPARATIVE SHARE ANALYSIS OF HOSPITAL BREAST IMPLANTS MARKET,2021-2031(%)
    FIGURE 32.COMPARATIVE SHARE ANALYSIS OF CLINICS BREAST IMPLANTS MARKET,2021-2031(%)
    FIGURE 33.BREAST IMPLANTS MARKET BY REGION,2021
    FIGURE 34.U.S. BREAST IMPLANTS MARKET,2021-2031($MILLION)
    FIGURE 35.CANADA BREAST IMPLANTS MARKET,2021-2031($MILLION)
    FIGURE 36.MEXICO BREAST IMPLANTS MARKET,2021-2031($MILLION)
    FIGURE 37.GERMANY BREAST IMPLANTS MARKET,2021-2031($MILLION)
    FIGURE 38.U.K. BREAST IMPLANTS MARKET,2021-2031($MILLION)
    FIGURE 39.FRANCE BREAST IMPLANTS MARKET,2021-2031($MILLION)
    FIGURE 40.SPAIN BREAST IMPLANTS MARKET,2021-2031($MILLION)
    FIGURE 41.ITALY BREAST IMPLANTS MARKET,2021-2031($MILLION)
    FIGURE 42.REST OF EUROPE BREAST IMPLANTS MARKET,2021-2031($MILLION)
    FIGURE 43.CHINA BREAST IMPLANTS MARKET,2021-2031($MILLION)
    FIGURE 44.JAPAN BREAST IMPLANTS MARKET,2021-2031($MILLION)
    FIGURE 45.INDIA BREAST IMPLANTS MARKET,2021-2031($MILLION)
    FIGURE 46.SOUTH KOREA BREAST IMPLANTS MARKET,2021-2031($MILLION)
    FIGURE 47.AUSTRALIA BREAST IMPLANTS MARKET,2021-2031($MILLION)
    FIGURE 48.REST OF ASIA-PACIFIC BREAST IMPLANTS MARKET,2021-2031($MILLION)
    FIGURE 49.BRAZIL BREAST IMPLANTS MARKET,2021-2031($MILLION)
    FIGURE 50.SAUDI ARABIA BREAST IMPLANTS MARKET,2021-2031($MILLION)
    FIGURE 51.UNITED ARAB EMIRATES BREAST IMPLANTS MARKET,2021-2031($MILLION)
    FIGURE 52.SOUTH AFRICA BREAST IMPLANTS MARKET,2021-2031($MILLION)
    FIGURE 53.REST OF LAMEA BREAST IMPLANTS MARKET,2021-2031($MILLION)
    FIGURE 54. TOP WINNING STRATEGIES, BY YEAR
    FIGURE 55. TOP WINNING STRATEGIES, BY DEVELOPMENT
    FIGURE 56. TOP WINNING STRATEGIES, BY COMPANY
    FIGURE 57.PRODUCT MAPPING OF TOP 10 PLAYERS
    FIGURE 58.COMPETITIVE DASHBOARD
    FIGURE 59.COMPETITIVE HEATMAP OF TOP 10 KEY PLAYERS
    FIGURE 60.ALLERGAN PLC.: NET SALES ,($MILLION)
    FIGURE 61.MENTOR WORLDWIDE LLC.: NET SALES ,($MILLION)
    FIGURE 62.HANSBIOMED.: NET SALES ,($MILLION)
    FIGURE 63.ESTABLISHMENT LABS S.A..: NET SALES ,($MILLION)
    FIGURE 64.POLYTECH HEALTH AND AESTHETICS GMBH.: NET SALES ,($MILLION)
    FIGURE 65.SIENTRA, INC..: NET SALES ,($MILLION)
    FIGURE 66.GC AESTHETICS.: NET SALES ,($MILLION)
    FIGURE 67.CEREPLAS.: NET SALES ,($MILLION)
    FIGURE 68.LABORATOIRES ARION.: NET SALES ,($MILLION)
    FIGURE 69.GROUPE SEBBIN SAS.: NET SALES ,($MILLION)


Rise in breast cancer cases around the world, increased research & development efforts for patients undergoing breast implant surgery to recover more quickly and experience less post-operative discomfort, as well as the desire among women to achieve proportion in their bodies, are some of the major reasons propelling the market's growth. However, the risks associated with breast implants, such as breast pain, changes in nipple, additional surgeries, breast implants associated with anaplastic large cell lymphoma (BIA-ALCL), are some of the factors that are expected to hinder the growth of global breast implants market during the forecast period. Additionally, the market players in the area are continuously working toward better and more efficient solutions and evolving the lives of available products through new product launches, collaborations, and mergers & acquisitions, which is anticipated to drive the growth of the breast implant market.

Among the analyzed regions, North America is expected to account for the highest revenue in the market during the forecast period. This can be owed to rise in number of breast augmentation processes in the region. Furthermore, accelerating adoption of cosmetic procedures is expected to augment the region’s market growth in future.

PURCHASE OPTIONS

Call or Email us

U.S.-Canada Toll-free: +1-800-792-5285
Int'l : +1-503-894-6022
Europe : +44-845-528-1300
Email : help@alliedmarketresearch.com
 
FREQUENTLY ASKED QUESTIONS?

A. Rise in number of breast cancer patients globally, increase in research & development activities for the faster recovery and less post-operative pain of patients in breast implant surgery, and the desire among women to get their body in proportion are some of the key factors driving the growth of the market.

A. The clinic sub-segment of the end use acquired the maximum share of the global breast implant market in 2021.

A. North America is expected to provide more business opportunities for the global breast implant market in future.

A. Sebbin, Allergan, Mentor Worldwide Llc, Gc Aesthetics, Laboratories Arion, Sientra Inc, Hansbiomed, Cereplas, Silimed, Groupe Sebbin SAS are the major players in the breast implant market.

A. The major growth strategies adopted by breast implant market players are technological advancements and mergers & acquisitions.

A. The report provides an extensive qualitative and quantitative analysis of the current trends and future estimations of the global breast implant market from 2021 to 2031 to determine the prevailing opportunities.

Looking for Customization?

 Customization Request

Have a Question?

 Speak with Analyst

Any Confusion?

 Inquire Before Buying

Have a glance of the Report

  Request Sample
RELATED TAGS

Purchase Full Report of
Breast Implants Market

Start reading instantly.
This Report and over 67,070+ more Reports, Available with Avenue Library. T&C*.

  • Online Only
  • $3,570
  • Online cloud access only
  • Restricted print, copy, paste & download
  • Read only
  • Free industry update
    (Within 180 days)
  • Free report update in next update cycle
    (Oct 2023 - Oct 2024)
  • Data Pack
  • $3,840
  • Restricted to one authorized user
  • One print only
  • Available in
    Excel
  • Free industry update
    (Within 180 days)
  •   Free report update in next update cycle
    (Oct 2023 - Oct 2024)
  • Single User
  • $5,730
  • Restricted to one authorized user
  • One print only
  • Available in
    PDF
  • Free industry update
    (Within 180 days)
  •   Free report update in next update cycle
    (Oct 2023 - Oct 2024)
  • Five Users
  • $6,450
  • Limited to five authorized users
  • Print upto five copies
  • Available in
    PDF
  • Free industry update
    (Within 180 days)
  •   Free report update in next update cycle
    (Oct 2023 - Oct 2024)
  • Enterprise
    License/PDF

  • $9,600
  • Unlimited
    within
    company/enterprise
  • Available in Excel & PDF
  • Free industry update
    (Within 180 days)
  •   Free report update in next update cycle
    (Oct 2023 - Oct 2024)
  • Library
    Membership

  • $999 $ 1,175
    Per User/ Per month/ Billed annually
  • Published Content
    E-access
  • Company Profiles
    E-access
  • Newly Added Content Access
  • 10 PDF
    Downloads
  • 5 Excel Data
    Pack Downloads
  • 250 Company Profiles PDF Downloads
  • Buy Now

*Taxes/Fees, if applicable will be added during checkout. All prices in USD

RELATED REPORTS
 

Why Allied Market Research?


Infallible Methodology

To ensure high-level data integrity, accurate analysis, and impeccable forecasts

Analyst Support

For complete satisfaction

Customization

On-demand customization of scope of the report to exactly meet your needs

TARGETED MARKET VIEW

Targeted market view to provide pertinent information and save time of readers

Get fresh content delivered

Get insights on topics that are crucial for your business. Stay abreast of your interest areas.

Get Industry Data Alerts

Why Allied Market Research?

Infallible Methodology

To ensure high-level data integrity, accurate analysis, and impeccable forecasts

Analyst Support

For complete satisfaction

Customization

On-demand customization of scope of the report to exactly meet your needs

TARGETED MARKET VIEW

Targeted market view to provide pertinent information and save time of readers