Report Code: A02915 | Sep 2021 | Pages: 214 | ||
Tables: 123 | Charts: 48 |
|
Pandemic disrupted the entire world and affected many industries.
Get detailed COVID-19 impact analysis on the Building-integrated Photovoltaic (bipv) Skylights Market
Request Now !
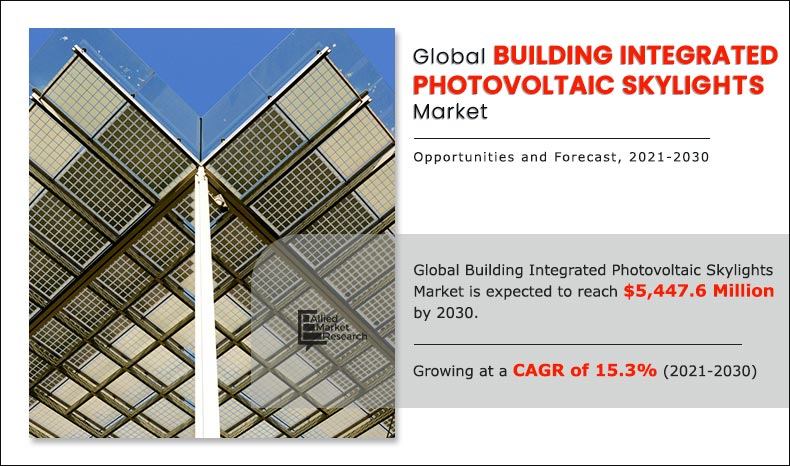
The global building-integrated photovoltaic skylights market size was $1,251.6 million in 2020 and is expected to reach $5,447.6 million by 2030, registering a CAGR of 15.3% from 2021 to 2030. Building-integrated photovoltaic skylight is an application of photovoltaic that involves the installation of photovoltaic materials in the facades, curtain walls, canopies, roofs, and walls of building. Building-integrated photovoltaic skylights are capable of generating electricity as well as providing natural lighting, thermal insulation, and structural stability. building-integrated They exhibit features such as aesthetic look, increased energy efficiency, low noise level, zero carbon footprint, and free power output from the sun. They are widely adopted in residential, commercial, and industrial areas.
The COVID 19 outbreak has affected the growth of the global building integrated photovoltaic (BIPV) skylights industry owing to the lockdown measures in various countries globally and delay in production of BIPV skylights which are utilized in industrial, residential, and commercial spaces.
Increase in construction activities in various regions such as Asia-Pacific & Europe and rise in demand for high appealing designs for buildings drive the growth of the global building-integrated photovoltaic skylights market. The building-integrated photovoltaic skylights products such as solar panel, and thin film panel are widely being used in the residential, commercial, and industrial projects. This is attributed to rapid industrialization and increase in urbanization.
Limited availability of fossil fuels and implementation of stringent norms by government on reducing carbon emission create strong need for cost-efficient and energy-efficient renewable energy sources such as solar energy, which fuels the growth of the market. In addition, increase in urbanization and industrialization in the emerging countries such as Germany, France, and the U.S. propels the growth of the building-integrated photovoltaic skylights market globally. For instance, degree of urbanization in the U.S. increased by 0.4% from 2017 to 2019. Rise in disposable income of population and improvement in standard of living foster the adoption of photovoltaic skylights system in residential properties, thereby augmenting the growth of the market. For instance, disposable income of South African population grew by 1.6% from 2019 to 2020. Rise in construction of commercial buildings & industrial buildings is further expected to boost the growth of the market in France. The commercial construction industry in France is expected to reach $227.7 billion by 2024, with a CAGR of 3.8%. These scenarios are favorable for growth of the market in the region during the forecast period.
The major players such as Wuxi Suntech Power Co Ltd. and Solaria Corporation are adopting business expansion and product launch as their key development strategies to improve the geographical presence of the photovoltaic skylight products. For instance, in September 2019, Solaria Corporation launched a new higher version of leading solar panel named as Solaria PowerXT 370 HP. It has power range of 370 Watts.
However, fluctuation in raw material prices and unreliability in harsh weather condition are anticipated to hamper the growth of the global building-integrated photovoltaic skylights market. Conversely, increase in construction of green buildings is anticipated to provide lucrative opportunities for the growth of the global building-integrated photovoltaic skylights market.
The global building-integrated photovoltaic skylights market is segmented into type, application, construction, and region. On the basis of type, the market is fragmented into crystalline panel and thin film panel. The crystalline panel segment dominated the market in 2020. Depending on application, the market in segregated into residential, commercial, and industrial. The commercial segment registered the highest growth in 2020. By construction, the market is fragmented into new construction and renovation. Renovation was the prominent segment in 2020.
Regionally, the global building-integrated photovoltaic skylights market analyzed across North America (the U.S., Canada, and Mexico), Europe (Germany, France, the UK, Italy, and rest of Europe), Asia-Pacific (China, Japan, India, Australia, and rest of Asia-Pacific), and LAMEA (Latin America, the Middle East, and Africa). Europe generated the highest revenue in 2020.
The key players profiled in the market report include EnergyGlass, ClearVue Technologies Limited, Kaneka Corporation, ML System S.A., Onyx Solar Group LLC, Norsk Hydro ASA, Polysolar Ltd., Super Sky Products Enterprises LLC, Wuxi Suntech Power Co Ltd., and Solaria Corporation.
Major players are adopting business expansion and product launch as key developmental strategies to improve the product portfolio of the global building-integrated photovoltaic skylights market. For instance, in August 2020, Wuxi Suntech Power Co Ltd. opened a new manufacturing facility in China. The business expansion was done for around $101.2 million. The business expansion was done for improve the product portfolio of photovoltaic shading products.
Key Benefits For Stakeholders
Building-integrated Photovoltaic (BIPV) Skylights Market Report Highlights
Aspects | Details |
---|---|
By Type |
|
By APPLICATION |
|
By CONSTRUCTION TYPE |
|
By Region |
|
Key Market Players | Wuxi Suntech Power Co Ltd., EnergyGlass, Super Sky Products Enterprises LLC, Norsk Hydro ASA, ML System S.A., Solaria Corporation, Onyx Solar Group LLC, Polysolar Ltd., Kaneka Corporation, ClearVue Technologies Limited |
CHAPTER 1:INTRODUCTION
1.1.Report description
1.2.Key benefits for stakeholders
1.3.Key market segments
1.4.Key market players
1.5.Research methodology
1.5.1.Secondary research
1.5.2.Primary research
1.5.3.Analyst tools & models
CHAPTER 2:EXECUTIVE SUMMARY
2.1.Key findings of the study
2.2.CXO perspective
CHAPTER 3:MARKET OVERVIEW
3.1.Market definition and scop
3.2.Key findings
3.2.1.Top investment pockets
3.2.2.Top winning strategies
3.3.Market player positioning, 2020
3.4.Porter's five forces analysis
3.5.Market dynamics
3.5.1.Drivers
3.5.1.1.Rapid urbanization
3.5.1.2.Growth in the construction sector
3.5.1.3.Increase in spending on home remodeling and retrofitting activities
3.5.2.Restraints
3.5.2.1.Unreliability in harsh weather conditions
3.5.2.2.Fluctuation in raw material prices
3.5.3.Opportunities
3.5.3.1.Increase in construction of green buildings
3.6.COVID-19 impact analysis
CHAPTER 4:GLOBAL BUILDING INTEGRATED PHOTOVOLTAIC SKYLIGHTS MARKET, BY TYPE
4.1.Overview
4.1.1.Market size and forecast, by type
4.2.Crystalline Panel
4.2.1.Key market trends, growth factors, and opportunities
4.2.2.Market size and forecast, by region
4.2.3.Market size and forecast, by country
4.3.Thin Film Panel
4.3.1.Key market trends, growth factors, and opportunities
4.3.2.Market size and forecast, by region
4.3.3.Market size and forecast, by country
CHAPTER 5:GLOBAL BUILDING INTEGRATED PHOTOVOLTAIC SKYLIGHTS MARKET, BY APPLICATION
5.1.Market overview
5.1.1.Market size and forecast, by application
5.2.Residential
5.2.1.Key market trends, growth factors, and opportunities
5.2.2.Market size and forecast, by region
5.2.3.Market size and forecast, by construction type
5.2.4.Market size and forecast, by country
5.3.Commercial
5.3.1.Key market trends, growth factors, and opportunities
5.3.2.Market size and forecast, by region
5.3.3.Market size and forecast, by construction type
5.3.4.Market size and forecast, by country
5.4.Industrial
5.4.1.Key market trends, growth factors, and opportunities
5.4.2.Market size and forecast, by region
5.4.3.Market size and forecast, by construction type
5.4.4.Market size and forecast, by country
CHAPTER 6:GLOBAL BUILDING INTEGRATED PHOTOVOLTAIC SKYLIGHTS MARKET, BY CONSTRUCTION TYPE
6.1.Market overview
6.1.1.Market size and forecast, by construction
6.2.New construction
6.2.1.Key market trends, growth factors, and opportunities
6.2.2.Market size and forecast, by region
6.2.3.Market size and forecast, by country
6.3.Renovation
6.3.1.Key market trends, growth factors, and opportunities
6.3.2.Market size and forecast, by region
6.3.3.Market size and forecast, by country
CHAPTER 7:GLOBAL BUILDING INTEGRATED PHOTOVOLTAIC SKYLIGHTS MARKET, BY REGION
7.1.Market overview
7.1.1.Market size and forecast
7.2.North America
7.2.1.Key market trends, growth factors, and opportunities
7.2.2.Market size and forecast, by type
7.2.3.Market size and forecast, by application
7.2.3.1.Market size and forecast, by construction type
7.2.4.Market size and forecast, by construction type
7.2.5.Market size and forecast, by country
7.2.5.1.U.S.
7.2.5.1.1.U.S. Market size and forecast, by type
7.2.5.1.2.U.S. Market size and forecast, by application
7.2.5.1.3.U.S. Market size and forecast, by construction type
7.2.5.2.Canada
7.2.5.2.1.Canada Market size and forecast, by type
7.2.5.2.2.Canada Market size and forecast, by application
7.2.5.2.3.Canada Market size and forecast, by construction type
7.2.5.3.Mexico
7.2.5.3.1.Mexico Market size and forecast, by type
7.2.5.3.2.Mexico Market size and forecast, by application
7.2.5.3.3.Mexico Market size and forecast, by construction type
7.3.Europe
7.3.1.Key market trends, growth factors, and opportunities
7.3.2.Market size and forecast, by type
7.3.3.Market size and forecast, by application
7.3.3.1.Market size and forecast, by construction type
7.3.4.Market size and forecast, by construction
7.3.5.Market size and forecast, by country
7.3.5.1.Germany
7.3.5.1.1.Germany Market size and forecast, by type
7.3.5.1.2.Germany Market size and forecast, by application
7.3.5.1.3.Germany Market size and forecast, by construction type
7.3.5.2.Italy
7.3.5.2.1.Italy Market size and forecast, by type
7.3.5.2.2.Italy Market size and forecast, by application
7.3.5.2.3.Italy Market size and forecast, by construction type
7.3.5.3.UK
7.3.5.3.1.UK Market size and forecast, by type
7.3.5.3.2.UK Market size and forecast, by application
7.3.5.3.3.UK Market size and forecast, by construction type
7.3.5.4.France
7.3.5.4.1.France Market size and forecast, by type
7.3.5.4.2.France Market size and forecast, by application
7.3.5.4.3.France Market size and forecast, by construction type
7.3.5.5.Rest of Europe
7.3.5.5.1.Rest of Europe Market size and forecast, by type
7.3.5.5.2.Rest of Europe Market size and forecast, by application
7.3.5.5.3.Rest of Europe Market size and forecast, by construction type
7.4.Asia-Pacific
7.4.1.Key market trends, growth factors, and opportunities
7.4.2.Market size and forecast, by type
7.4.3.Market size and forecast, by application
7.4.3.1.Market size and forecast, by construction type
7.4.4.Market size and forecast, by construction type
7.4.5.Market size and forecast, by country
7.4.5.1.China
7.4.5.1.1.China Market size and forecast, by type
7.4.5.1.2.China Market size and forecast, by application
7.4.5.1.3.China Market size and forecast, by construction type
7.4.5.2.Japan
7.4.5.2.1.Japan Market size and forecast, by type
7.4.5.2.2.Japan Market size and forecast, by application
7.4.5.2.3.Japan Market size and forecast, by construction type
7.4.5.3.India
7.4.5.3.1.India Market size and forecast, by type
7.4.5.3.2.India Market size and forecast, by application
7.4.5.3.3.India Market size and forecast, by construction type
7.4.5.4.Australia
7.4.5.4.1.Australia Market size and forecast, by type
7.4.5.4.2.Australia Market size and forecast, by application
7.4.5.4.3.Australia Market size and forecast, by construction type
7.4.5.5.Rest of Asia-Pacific
7.4.5.5.1.Rest of Asia-Pacific Market size and forecast, by type
7.4.5.5.2.Rest of Asia-Pacific Market size and forecast, by application
7.4.5.5.3.Rest of Asia-Pacific Market size and forecast, by construction type
7.5.LAMEA
7.5.1.Key market trends, growth factors, and opportunities
7.5.2.Market size and forecast, by type
7.5.3.Market size and forecast, by application
7.5.3.1.Market size and forecast, by construction type
7.5.4.Market size and forecast, by construction type
7.5.5.Market size and forecast, by country
7.5.5.1.Latin America
7.5.5.1.1.Latin America Market size and forecast, by type
7.5.5.1.2.Latin America Market size and forecast, by application
7.5.5.1.3.Latin America Market size and forecast, by construction type
7.5.5.2.Middle East
7.5.5.2.1.Middle East Market size and forecast, by type
7.5.5.2.2.Middle East Market size and forecast, by application
7.5.5.2.3.Middle East Market size and forecast, by construction type
7.5.5.3.Africa
7.5.5.3.1.Africa Market size and forecast, by type
7.5.5.3.2.Africa Market size and forecast, by application
7.5.5.3.3.Africa Market size and forecast, by construction type
CHAPTER 8:COMPANY PROFILES
8.1.EnergyGlass
8.1.1.Company overview
8.1.2.Key executives
8.1.3.Company snapshot
8.1.4.Product portfolio
8.2.ClearVue Technologies Limited
8.2.1.Company overview
8.2.2.Key executive
8.2.3.Company snapshot
8.2.4.Operating business segments
8.2.5.Product portfolio
8.2.6.R&D expenditure
8.2.7.Business performance
8.3.Kaneka Corporation
8.3.1.Company overview
8.3.2.Key executives
8.3.3.Company snapshot
8.3.4.Operating business segments
8.3.5.Product portfolio
8.3.6.Business performance
8.4.ML System S.A.
8.4.1.Company overview
8.4.2.Key executives
8.4.3.Company snapshot
8.4.4.Product portfolio
8.4.5.Key strategic moves and developments
8.5.Onyx Solar Group LLC
8.5.1.Company overview
8.5.2.Key executives
8.5.3.Company snapshot
8.5.4.Product portfolio
8.6.Norsk Hydro ASA
8.6.1.Company overview
8.6.2.Key executives
8.6.3.Company snapshot
8.6.4.Operating business segments
8.6.5.Product portfolio
8.6.6.R & D Expenditure
8.6.7.Business performance
8.7.Polysolar Ltd
8.7.1.Company overview
8.7.2.Key executives
8.7.3.Company snapshot
8.7.4.Product portfolio
8.8.Super Sky Products Enterprises, LLC
8.8.1.Company overview
8.8.2.Key executives
8.8.3.Company snapshot
8.8.4.Product portfolio
8.9.Wuxi Suntech Power Co Ltd
8.9.1.Company overview
8.9.2.Key executives
8.9.3.Company snapshot
8.9.4.Product portfolio
8.9.5.Key strategic moves and developments
8.10.Solaria Corporation
8.10.1.Company overview
8.10.2.Key executives
8.10.3.Company snapshot
8.10.4.Product portfolio
8.10.5.Key strategic moves and developments
LIST OF TABLES
TABLE 01.GLOBAL BUILDING INTEGRATED PHOTOVOLTAIC SKYLIGHTS MARKET REVENUE, BY TYPE, 2020–2030 ($MILLION)
TABLE 02.BUILDING INTEGRATED PHOTOVOLTAIC SKYLIGHTS MARKET REVENUE FOR CRYSTALLINE PANEL, BY REGION, 2020–2030 ($MILLION)
TABLE 03.BUILDING INTEGRATED PHOTOVOLTAIC SKYLIGHTS MARKET REVENUE FOR THIN FILM PANEL, BY REGION, 2020–2030 ($MILLION)
TABLE 04.GLOBAL BUILDING INTEGRATED PHOTOVOLTAIC SKYLIGHTS MARKET REVENUE, BY APPLICATION, 2020–2030 ($MILLION)
TABLE 05.BUILDING INTEGRATED PHOTOVOLTAIC SKYLIGHTS MARKET REVENUE FOR RESIDENTIAL, BY REGION, 2020–2030 ($MILLION)
TABLE 06.BUILDING INTEGRATED PHOTOVOLTAIC SKYLIGHTS MARKET REVENUE FOR RESIDENTIAL, BY CONSTRUCTION TYPE, 2020–2030 ($MILLION)
TABLE 07.BUILDING INTEGRATED PHOTOVOLTAIC SKYLIGHTS MARKET REVENUE FOR COMMERCIAL, BY REGION, 2020–2030 ($MILLION)
TABLE 08.BUILDING INTEGRATED PHOTOVOLTAIC SKYLIGHTS MARKET REVENUE FOR COMMERCIAL, BY CONSTRUCTION TYPE, 2020–2030 ($MILLION)
TABLE 09.BUILDING INTEGRATED PHOTOVOLTAIC SKYLIGHTS MARKET REVENUE FOR INDUSTRIAL, BY REGION, 2020–2030 ($MILLION)
TABLE 10.BUILDING INTEGRATED PHOTOVOLTAIC SKYLIGHTS MARKET REVENUE FOR INDUSTRIAL, BY CONSTRUCTION TYPE, 2020–2030 ($MILLION)
TABLE 11.GLOBAL BUILDING INTEGRATED PHOTOVOLTAIC SKYLIGHTS MARKET REVENUE, BY CONSTRUCTION TYPE, 2020–2030 ($MILLION)
TABLE 12.BUILDING INTEGRATED PHOTOVOLTAIC SKYLIGHTS MARKET REVENUE FOR NEW CONSTRUCTION, BY REGION, 2020–2030 ($MILLION)
TABLE 13.BUILDING INTEGRATED PHOTOVOLTAIC SKYLIGHTS MARKET REVENUE FOR RENOVATION, BY REGION, 2020–2030 ($MILLION)
TABLE 14.BUILDING INTEGRATED PHOTOVOLTAIC SKYLIGHTS MARKET, BY REGION, 2020–2030 ($MILLION)
TABLE 15.NORTH AMERICA BUILDING INTEGRATED PHOTOVOLTAIC SKYLIGHTS MARKET, BY TYPE, 2020–2030 ($MILLION)
TABLE 16.NORTH AMERICA BUILDING INTEGRATED PHOTOVOLTAIC SKYLIGHTS MARKET REVENUE, BY APPLICATION, 2020–2030 ($MILLION)
TABLE 17.NORTH AMERICA BUILDING INTEGRATED PHOTOVOLTAIC SKYLIGHTS MARKET REVENUE, FOR RESIDENTIAL, BY CONSTRUCTION TYPE, 2020–2030 ($MILLION)
TABLE 18.NORTH AMERICA BUILDING INTEGRATED PHOTOVOLTAIC SKYLIGHTS MARKET REVENUE, FOR COMMERCIAL, BY CONSTRUCTION TYPE, 2020–2030 ($MILLION)
TABLE 19.NORTH AMERICA BUILDING INTEGRATED PHOTOVOLTAIC SKYLIGHTS MARKET REVENUE, INDUSTRIAL, BY CONSTRUCTION TYPE, 2020–2030 ($MILLION)
TABLE 20.NORTH AMERICA BUILDING INTEGRATED PHOTOVOLTAIC SKYLIGHTS MARKET REVENUE, BY CONSTRUCTION TYPE, 2020–2030 ($MILLION)
TABLE 21.NORTH AMERICA BUILDING INTEGRATED PHOTOVOLTAIC SKYLIGHTS MARKET, BY COUNTRY, 2020–2030 ($MILLION)
TABLE 22.U.S. BUILDING INTEGRATED PHOTOVOLTAIC SKYLIGHTS MARKET, BY TYPE, 2020–2030 ($MILLION)
TABLE 23.U.S. BUILDING INTEGRATED PHOTOVOLTAIC SKYLIGHTS MARKET, BY APPLICATION, 2020–2030 ($MILLION)
TABLE 24.U.S. BUILDING INTEGRATED PHOTOVOLTAIC SKYLIGHTS MARKET, BY CONSTRUCTION TYPE, 2020–2030 ($MILLION)
TABLE 25.CANADA BUILDING INTEGRATED PHOTOVOLTAIC SKYLIGHTS MARKET, BY TYPE, 2020–2030 ($MILLION)
TABLE 26.CANADA BUILDING INTEGRATED PHOTOVOLTAIC SKYLIGHTS MARKET, BY APPLICATION, 2020–2030 ($MILLION)
TABLE 27.CANADA BUILDING INTEGRATED PHOTOVOLTAIC SKYLIGHTS MARKET, BY CONSTRUCTION TYPE, 2020–2030 ($MILLION)
TABLE 28.MEXICO BUILDING INTEGRATED PHOTOVOLTAIC SKYLIGHTS MARKET, BY TYPE, 2020–2030 ($MILLION)
TABLE 29.MEXICO BUILDING INTEGRATED PHOTOVOLTAIC SKYLIGHTS MARKET, BY APPLICATION, 2020–2030 ($MILLION)
TABLE 30.MEXICO BUILDING INTEGRATED PHOTOVOLTAIC SKYLIGHTS MARKET, BY CONSTRUCTION TYPE, 2020–2030 ($MILLION)
TABLE 31.EUROPE BUILDING INTEGRATED PHOTOVOLTAIC SKYLIGHTS MARKET, BY TYPE, 2020–2030 ($MILLION)
TABLE 32.EUROPE BUILDING INTEGRATED PHOTOVOLTAIC SKYLIGHTS MARKET REVENUE, BY APPLICATION, 2020–2030 ($MILLION)
TABLE 33.EUROPE BUILDING INTEGRATED PHOTOVOLTAIC SKYLIGHTS MARKET REVENUE, FOR RESIDENTIAL, BY CONSTRUCTION TYPE, 2020–2030 ($MILLION)
TABLE 34.EUROPE BUILDING INTEGRATED PHOTOVOLTAIC SKYLIGHTS MARKET REVENUE, FOR COMMERCIAL, BY CONSTRUCTION TYPE, 2020–2030 ($MILLION)
TABLE 35.EUROPE BUILDING INTEGRATED PHOTOVOLTAIC SKYLIGHTS MARKET REVENUE, INDUSTRIAL, BY CONSTRUCTION TYPE, 2020–2030 ($MILLION)
TABLE 36.EUROPE BUILDING INTEGRATED PHOTOVOLTAIC SKYLIGHTS MARKET REVENUE, BY CONSTRUCTION, 2020–2030 ($MILLION)
TABLE 37.EUROPE BUILDING INTEGRATED PHOTOVOLTAIC SKYLIGHTS MARKET, BY COUNTRY, 2020–2030 ($MILLION)
TABLE 38.GERMANY BUILDING INTEGRATED PHOTOVOLTAIC SKYLIGHTS MARKET, BY TYPE, 2020–2030 ($MILLION)
TABLE 39.GERMANY BUILDING INTEGRATED PHOTOVOLTAIC SKYLIGHTS MARKET, BY APPLICATION, 2020–2030 ($MILLION)
TABLE 40.GERMANY BUILDING INTEGRATED PHOTOVOLTAIC SKYLIGHTS MARKET, BY CONSTRUCTION TYPE, 2020–2030 ($MILLION)
TABLE 41.ITALY BUILDING INTEGRATED PHOTOVOLTAIC SKYLIGHTS MARKET, BY TYPE, 2020–2030 ($MILLION)
TABLE 42.ITALY BUILDING INTEGRATED PHOTOVOLTAIC SKYLIGHTS MARKET, BY APPLICATION, 2020–2030 ($MILLION)
TABLE 43.ITALY BUILDING INTEGRATED PHOTOVOLTAIC SKYLIGHTS MARKET, BY CONSTRUCTION TYPE, 2020–2030 ($MILLION)
TABLE 44.UK BUILDING INTEGRATED PHOTOVOLTAIC SKYLIGHTS MARKET, BY TYPE, 2020–2030 ($MILLION)
TABLE 45.UK BUILDING INTEGRATED PHOTOVOLTAIC SKYLIGHTS MARKET, BY APPLICATION, 2020–2030 ($MILLION)
TABLE 46.UK BUILDING INTEGRATED PHOTOVOLTAIC SKYLIGHTS MARKET, BY CONSTRUCTION TYPE, 2020–2030 ($MILLION)
TABLE 47.FRANCE BUILDING INTEGRATED PHOTOVOLTAIC SKYLIGHTS MARKET, BY TYPE, 2020–2030 ($MILLION)
TABLE 48.FRANCE BUILDING INTEGRATED PHOTOVOLTAIC SKYLIGHTS MARKET, BY APPLICATION, 2020–2030 ($MILLION)
TABLE 49.FRANCE BUILDING INTEGRATED PHOTOVOLTAIC SKYLIGHTS MARKET, BY CONSTRUCTION TYPE, 2020–2030 ($MILLION)
TABLE 50.REST OF EUROPE BUILDING INTEGRATED PHOTOVOLTAIC SKYLIGHTS MARKET, BY TYPE, 2020–2030 ($MILLION)
TABLE 51.REST OF EUROPE BUILDING INTEGRATED PHOTOVOLTAIC SKYLIGHTS MARKET, BY APPLICATION, 2020–2030 ($MILLION)
TABLE 52.REST OF EUROPE BUILDING INTEGRATED PHOTOVOLTAIC SKYLIGHTS MARKET, BY CONSTRUCTION TYPE, 2020–2030 ($MILLION)
TABLE 53.ASIA-PACIFIC BUILDING INTEGRATED PHOTOVOLTAIC SKYLIGHTS MARKET, BY TYPE, 2020–2030 ($MILLION)
TABLE 54.ASIA-PACIFIC BUILDING INTEGRATED PHOTOVOLTAIC SKYLIGHTS MARKET REVENUE, BY APPLICATION, 2020–2030 ($MILLION)
TABLE 55.ASIA-PACIFIC BUILDING INTEGRATED PHOTOVOLTAIC SKYLIGHTS MARKET REVENUE, FOR RESIDENTIAL, BY CONSTRUCTION TYPE, 2020–2030 ($MILLION)
TABLE 56.ASIA-PACIFIC BUILDING INTEGRATED PHOTOVOLTAIC SKYLIGHTS MARKET REVENUE, FOR COMMERCIAL, BY CONSTRUCTION TYPE, 2020–2030 ($MILLION)
TABLE 57.ASIA-PACIFIC BUILDING INTEGRATED PHOTOVOLTAIC SKYLIGHTS MARKET REVENUE, INDUSTRIAL, BY CONSTRUCTION TYPE, 2020–2030 ($MILLION)
TABLE 58.ASIA-PACIFIC BUILDING INTEGRATED PHOTOVOLTAIC SKYLIGHTS MARKET REVENUE, BY CONSTRUCTION TYPE, 2020–2030 ($MILLION)
TABLE 59.ASIA-PACIFIC BUILDING INTEGRATED PHOTOVOLTAIC SKYLIGHTS MARKET, BY COUNTRY, 2020–2030 ($MILLION)
TABLE 60.CHINA BUILDING INTEGRATED PHOTOVOLTAIC SKYLIGHTS MARKET, BY TYPE, 2020–2030 ($MILLION)
TABLE 61.CHINA BUILDING INTEGRATED PHOTOVOLTAIC SKYLIGHTS MARKET, BY APPLICATION, 2020–2030 ($MILLION)
TABLE 62.CHINA BUILDING INTEGRATED PHOTOVOLTAIC SKYLIGHTS MARKET, BY CONSTRUCTION TYPE, 2020–2030 ($MILLION)
TABLE 63.JAPAN BUILDING INTEGRATED PHOTOVOLTAIC SKYLIGHTS MARKET, BY TYPE, 2020–2030 ($MILLION)
TABLE 64.JAPAN BUILDING INTEGRATED PHOTOVOLTAIC SKYLIGHTS MARKET, BY APPLICATION, 2020–2030 ($MILLION)
TABLE 65.JAPAN BUILDING INTEGRATED PHOTOVOLTAIC SKYLIGHTS MARKET, BY CONSTRUCTION TYPE, 2020–2030 ($MILLION)
TABLE 66.INDIA BUILDING INTEGRATED PHOTOVOLTAIC SKYLIGHTS MARKET, BY TYPE, 2020–2030 ($MILLION)
TABLE 67.INDIA BUILDING INTEGRATED PHOTOVOLTAIC SKYLIGHTS MARKET, BY APPLICATION, 2020–2030 ($MILLION)
TABLE 68.INDIA BUILDING INTEGRATED PHOTOVOLTAIC SKYLIGHTS MARKET, BY CONSTRUCTION TYPE, 2020–2030 ($MILLION)
TABLE 69.AUSTRALIA BUILDING INTEGRATED PHOTOVOLTAIC SKYLIGHTS MARKET, BY TYPE, 2020–2030 ($MILLION)
TABLE 70.AUSTRALIA BUILDING INTEGRATED PHOTOVOLTAIC SKYLIGHTS MARKET, BY APPLICATION, 2020–2030 ($MILLION)
TABLE 71.AUSTRALIA BUILDING INTEGRATED PHOTOVOLTAIC SKYLIGHTS MARKET, BY CONSTRUCTION TYPE, 2020–2030 ($MILLION)
TABLE 72.REST OF ASIA-PACIFIC BUILDING INTEGRATED PHOTOVOLTAIC SKYLIGHTS MARKET, BY TYPE, 2020–2030 ($MILLION)
TABLE 73.REST OF ASIA-PACIFIC BUILDING INTEGRATED PHOTOVOLTAIC SKYLIGHTS MARKET, BY APPLICATION, 2020–2030 ($MILLION)
TABLE 74.REST OF ASIA-PACIFIC BUILDING INTEGRATED PHOTOVOLTAIC SKYLIGHTS MARKET, BY CONSTRUCTION TYPE, 2020–2030 ($MILLION)
TABLE 75.LAMEA BUILDING INTEGRATED PHOTOVOLTAIC SKYLIGHTS MARKET, BY TYPE, 2020–2030 ($MILLION)
TABLE 76.LAMEA BUILDING INTEGRATED PHOTOVOLTAIC SKYLIGHTS MARKET REVENUE, BY APPLICATION, 2020–2030 ($MILLION)
TABLE 77.LAMEA BUILDING INTEGRATED PHOTOVOLTAIC SKYLIGHTS MARKET REVENUE, FOR RESIDENTIAL, BY CONSTRUCTION TYPE, 2020–2030 ($MILLION)
TABLE 78.LAMEA BUILDING INTEGRATED PHOTOVOLTAIC SKYLIGHTS MARKET REVENUE, FOR COMMERCIAL, BY CONSTRUCTION TYPE, 2020–2030 ($MILLION)
TABLE 79.LAMEA BUILDING INTEGRATED PHOTOVOLTAIC SKYLIGHTS MARKET REVENUE, INDUSTRIAL, BY CONSTRUCTION TYPE, 2020–2030 ($MILLION)
TABLE 80.LAMEA BUILDING INTEGRATED PHOTOVOLTAIC SKYLIGHTS MARKET REVENUE, BY CONSTRUCTION TYPE, 2020–2030 ($MILLION)
TABLE 81.LAMEA BUILDING INTEGRATED PHOTOVOLTAIC SKYLIGHTS MARKET, BY COUNTRY, 2020–2030 ($MILLION)
TABLE 82.LATIN AMERICA BUILDING INTEGRATED PHOTOVOLTAIC SKYLIGHTS MARKET, BY TYPE, 2020–2030 ($MILLION)
TABLE 83.LATIN AMERICA BUILDING INTEGRATED PHOTOVOLTAIC SKYLIGHTS MARKET, BY APPLICATION, 2020–2030 ($MILLION)
TABLE 84.LATIN AMERICA BUILDING INTEGRATED PHOTOVOLTAIC SKYLIGHTS MARKET, BY CONSTRUCTION TYPE, 2020–2030 ($MILLION)
TABLE 85.MIDDLE EAST BUILDING INTEGRATED PHOTOVOLTAIC SKYLIGHTS MARKET, BY TYPE, 2020–2030 ($MILLION)
TABLE 86.MIDDLE EAST BUILDING INTEGRATED PHOTOVOLTAIC SKYLIGHTS MARKET, BY APPLICATION, 2020–2030 ($MILLION)
TABLE 87.MIDDLE EAST BUILDING INTEGRATED PHOTOVOLTAIC SKYLIGHTS MARKET, BY CONSTRUCTION TYPE, 2020–2030 ($MILLION)
TABLE 88.AFRICA BUILDING INTEGRATED PHOTOVOLTAIC SKYLIGHTS MARKET, BY TYPE, 2020–2030 ($MILLION)
TABLE 89.AFRICA BUILDING INTEGRATED PHOTOVOLTAIC SKYLIGHTS MARKET, BY APPLICATION, 2020–2030 ($MILLION)
TABLE 90.AFRICA BUILDING INTEGRATED PHOTOVOLTAIC SKYLIGHTS MARKET, BY CONSTRUCTION TYPE, 2020–2030 ($MILLION)
TABLE 91.ENERGYGLASS: KEY EXECUTIVE
TABLE 92.ENERGYGLASS: COMPANY SNAPSHOT
TABLE 93.ENERGYGLASS: PRODUCT PORTFOLIO
TABLE 94.CLEARVUE TECHNOLOGIES LIMITED: KEY EXECUTIVE
TABLE 95.CLEARVUE TECHNOLOGIES LIMITED: COMPANY SNAPSHOT
TABLE 96.CLEARVUE TECHNOLOGIES LIMITED: OPERATING SEGMENTS
TABLE 97.CLEARVUE TECHNOLOGIES LIMITED: PRODUCT PORTFOLIO
TABLE 98.KANEKA CORPORATION: KEY EXECUTIVE
TABLE 99.KANEKA CORPORATION: COMPANY SNAPSHOT
TABLE 100.KANEKA CORPORATION: OPERATING SEGMENTS
TABLE 101.KANKEA CORPORATION: PRODUCT PORTFOLIO
TABLE 102.ML SYSTEM S.A.: KEY EXECUTIVE
TABLE 103.ML SYSTEM S.A.: COMPANY SNAPSHOT
TABLE 104.ML SYSTEM S.A.: PRODUCT PORTFOLIO
TABLE 105.ONYX SOLAR GROUP LLC: KEY EXECUTIVE
TABLE 106.ONYX SOLAR GROUP LLC: COMPANY SNAPSHOT
TABLE 107.ONYX SOLAR GROUP LLC: PRODUCT PORTFOLIO
TABLE 108.NORSK HYDRO ASA: KEY EXECUTIVE
TABLE 109.NORSK HYDRO ASA.: COMPANY SNAPSHOT
TABLE 110.NORSK HYDRO ASA: OPERATING SEGMENTS
TABLE 111.NORSK HYDRO ASA.: PRODUCT PORTFOLIO
TABLE 112.POLYSOLAR LTD: KEY EXECUTIVE
TABLE 113.POLYSOLAR LTD: COMPANY SNAPSHOT
TABLE 114.POLYSOLAR LTD: PRODUCT PORTFOLIO
TABLE 115.SUPER SKY PRODUCTS ENTERPISES LLC: KEY EXECUTIVE
TABLE 116.SUPER SKY PRODUCTS ENTERPISES LLC: COMPANY SNAPSHOT
TABLE 117.SUPER SKY PRODUCTS ENTERPRISES LLC: PRODUCT PORTFOLIO
TABLE 118.WUXI SUNTECH POWER CO LTD: KEY EXECUTIVE
TABLE 119.WUXI SUNTECH POWER CO LTD: COMPANY SNAPSHOT
TABLE 120.WUXI SUNTECH POWER CO LTD: PRODUCT PORTFOLIO
TABLE 121.SOLARIA CORPORATION: KEY EXECUTIVE
TABLE 122.SOLARIA CORPORATION: COMPANY SNAPSHOT
TABLE 123.SOLARIA CORPORATION.: PRODUCT PORTFOLIO
LIST OF FIGURES
FIGURE 01.KEY MARKET SEGMENTS
FIGURE 02.EXECUTIVE SUMMARY
FIGURE 03.TOP INVESTMENT POCKETS
FIGURE 04.TOP WINNING STRATEGIES, BY YEAR, 2018-2021
FIGURE 05.TOP WINNING STRATEGIES, BY DEVELOPMENT, 2018-2021 (%)
FIGURE 06.TOP WINNING STRATEGIES, BY COMPANY, 2018-2021
FIGURE 07.MARKET PLAYER POSITIONING, 2020
FIGURE 08.LOW TO MODERATE BARGAINING POWER OF SUPPLIERS
FIGURE 09.MODERATE TO HIGH BARGAINING POWER OF BUYERS
FIGURE 10.HIGH THREAT OF SUBSTITUTES
FIGURE 11.MODERATE- HIGH THREAT OF NEW ENTRANTS
FIGURE 12.MODERATE-TO- HIGH COMPETITIVE RIVALRY
FIGURE 13.MARKET DYNAMICS
FIGURE 14.GLOBAL BUILDING INTEGRATED PHOTOVOLTAIC SKYLIGHTS MARKET, BY TYPE, 2020–2030 (%)
FIGURE 15.COMPARATIVE SHARE ANALYSIS OF BUILDING INTEGRATED PHOTOVOLTAIC SKYLIGHTS MARKET, FOR CRYSTALLINE PANEL, BY COUNTRY, 2020–2030 (%)
FIGURE 16.COMPARATIVE SHARE ANALYSIS OF BUILDING INTEGRATED PHOTOVOLTAIC SKYLIGHTS MARKET, FOR THIN-FILM PANEL, BY COUNTRY, 2020–2030 (%)
FIGURE 17.GLOBAL BUILDING INTEGRATED PHOTOVOLTAIC SKYLIGHTS MARKET, BY APPLICATION, 2020–2030 (%)
FIGURE 18.COMPARATIVE SHARE ANALYSIS OF BUILDING INTEGRATED PHOTOVOLTAIC SKYLIGHTS MARKET, FOR RESIDENTIAL, BY COUNTRY, 2020–2030 (%)
FIGURE 19.COMPARATIVE SHARE ANALYSIS OF BUILDING INTEGRATED PHOTOVOLTAIC SKYLIGHTS MARKET, FOR COMMERCIAL, BY COUNTRY, 2020–2030 (%)
FIGURE 20.COMPARATIVE SHARE ANALYSIS OF BUILDING INTEGRATED PHOTOVOLTAIC SKYLIGHTS MARKET, FOR INDUSTRIAL, BY COUNTRY, 2020–2030 (%)
FIGURE 21.GLOBAL BUILDING INTEGRATED PHOTOVOLTAIC SKYLIGHTS MARKET, BY CONSTRUCTION TYPE, 2020–2030 (%)
FIGURE 22.COMPARATIVE SHARE ANALYSIS OF BUILDING INTEGRATED PHOTOVOLTAIC SKYLIGHTS MARKET REVENUE, FOR NEW CONSTRUCTION, BY COUNTRY, 2020–2030 (%)
FIGURE 23.COMPARATIVE SHARE ANALYSIS OF BUILDING INTEGRATED PHOTOVOLTAIC SKYLIGHTS MARKET REVENUE FOR RENOVATION, BY COUNTRY, 2020–2030 (%)
FIGURE 24.BUILDING INTEGRATED PHOTOVOLTAIC SKYLIGHTS MARKET, BY REGION, 2020–2030 (%)
FIGURE 25.U.S. BUILDING INTEGRATED PHOTOVOLTAIC SKYLIGHTS MARKET REVENUE, 2020–2030 ($MILLION)
FIGURE 26.CANADA BUILDING INTEGRATED PHOTOVOLTAIC SKYLIGHTS MARKET REVENUE, 2020–2030 ($MILLION)
FIGURE 27.MEXICO BUILDING INTEGRATED PHOTOVOLTAIC SKYLIGHTS MARKET REVENUE, 2020–2030 ($MILLION)
FIGURE 28.GERMANY BUILDING INTEGRATED PHOTOVOLTAIC SKYLIGHTS MARKET REVENUE, 2020–2030 ($MILLION)
FIGURE 29.ITALY BUILDING INTEGRATED PHOTOVOLTAIC SKYLIGHTS MARKET REVENUE, 2020–2030 ($MILLION)
FIGURE 30.UK BUILDING INTEGRATED PHOTOVOLTAIC SKYLIGHTS MARKET REVENUE, 2020–2030 ($MILLION)
FIGURE 31.FRANCE BUILDING INTEGRATED PHOTOVOLTAIC SKYLIGHTS MARKET REVENUE, 2020–2030 ($MILLION)
FIGURE 32.REST OF EUROPE BUILDING INTEGRATED PHOTOVOLTAIC SKYLIGHTS MARKET REVENUE, 2020–2030 ($MILLION)
FIGURE 33.CHINA BUILDING INTEGRATED PHOTOVOLTAIC SKYLIGHTS MARKET REVENUE, 2020–2030 ($MILLION)
FIGURE 34.JAPAN BUILDING INTEGRATED PHOTOVOLTAIC SKYLIGHTS MARKET REVENUE, 2020–2030 ($MILLION)
FIGURE 35.INDIA BUILDING INTEGRATED PHOTOVOLTAIC SKYLIGHTS MARKET REVENUE, 2020–2030 ($MILLION)
FIGURE 36.AUSTRALIA BUILDING INTEGRATED PHOTOVOLTAIC SKYLIGHTS MARKET REVENUE, 2020–2030 ($MILLION)
FIGURE 37.REST OF ASIA-PACIFIC BUILDING INTEGRATED PHOTOVOLTAIC SKYLIGHTS MARKET REVENUE, 2020–2030 ($MILLION)
FIGURE 38.LATIN AMERICA BUILDING INTEGRATED PHOTOVOLTAIC SKYLIGHTS MARKET REVENUE, 2020–2030 ($MILLION)
FIGURE 39.MIDDLE EAST BUILDING INTEGRATED PHOTOVOLTAIC SKYLIGHTS MARKET REVENUE, 2020–2030 ($MILLION)
FIGURE 40.AFRICA BUILDING INTEGRATED PHOTOVOLTAIC SKYLIGHTS MARKET REVENUE, 2020–2030 ($MILLION)
FIGURE 41.CLEARVUE TECHNOLOGIES LIMITED: R&D EXPENDITURE, 2018–2020 ($MILLION)
FIGURE 42.CLEARVUE TECHNOLOGIES LIMITED: REVENUE, 2018–2020 ($MILLION)
FIGURE 43.KANEKA CORPORATION: REVENUE, 2019–2021 ($MILLION)
FIGURE 44.KANEKA CORPORATION: REVENUE SHARE BY SEGMENT, 2021 (%)
FIGURE 45.KANEKA CORPORATION: REVENUE SHARE BY REGION, 2021 (%)
FIGURE 46.NORSK HYDRO ASA: R & D EXPENDITURE, REVENUE, 2018–2020 ($MILLION)
FIGURE 47.NORSK HYDRO ASA: REVENUE, 2018–2020 ($MILLION)
FIGURE 48.NORSK HYDRO ASA: REVENUE SHARE BY SEGMENT, 2020 (%)
The growth in the residential and commercial construction activities and rise in government support for construction and renovation activities, which fuels the global building-integrated photovoltaic skylights market. In addition, rise in spending on commercial and residential construction activities fuels the demand for photovoltaic skylights, thereby driving the growth of the global building integrated photovoltaic skylights market.
Increase in spending on residential and commercial construction industry, which supplements the growth of the global building-integrated photovoltaic skylights market. In addition, tourism in various countries such as India, China, and Brazil, which drives the growth of the global building-integrated photovoltaic skylights market. For instance, in Brazil, according to the Worldbank Group, the government increased its allocation toward tourism sector, which is expected to grow at a rate of 1.48% from 1995 to 2028. China and India are expected to witness increase in new construction activities, which is expected to propel the installation of building-photovoltaic skylights market.
Silicon, gallium arsenide, metal chalcogenides are some of the materials used in the manufacturing of integrated photovoltaic skylights products, which required high cost, thus restraining for the growth of the global integrated-photovoltaic skylights market. Moreover, rise in environment concerns and increase in construction of green buildings are anticipated to provide lucrative opportunities for the growth of the global building integrated photovoltaic skylights market.
A. The global building integrated photovoltaic skylights market size was valued at $1,251.6 million in 2020.
A. Based on type, crystalline panel segment holds the maximum market share of the global building integrated photovoltaic skylights market in 2020.
A. The global building integrated photovoltaic skylights market is projected to reach $5,447.6 million by 2030.
A. The urbanization and growing investment in the road and infrastructure sector are the key trends in the global building integrated photovoltaic skylights market.
A. The product launch is key growth strategy of Global building integrated photovoltaic skylights industry players.
A. The company profile has been selected on factors such as geographical presence, market dominance (in terms of revenue and volume sales), various strategies and recent developments.
A. High fluctuation in raw material cost are the effecting factors for Global building integrated photovoltaic skylights market.
A. The different applications of building integrated photovoltaic skylights system include its installation in commercial, residential, and industrial spaces.
Start reading instantly.
This Report and over 67,404+ more Reports, Available with Avenue Library. T&C*.
Enterprise
License/PDF
Library
Membership
*Taxes/Fees, if applicable will be added during checkout. All prices in USD
To ensure high-level data integrity, accurate analysis, and impeccable forecasts
For complete satisfaction
On-demand customization of scope of the report to exactly meet your needs
Targeted market view to provide pertinent information and save time of readers
Get insights on topics that are crucial for your business. Stay abreast of your interest areas.
Get Industry Data AlertsTo ensure high-level data integrity, accurate analysis, and impeccable forecasts
For complete satisfaction
On-demand customization of scope of the report to exactly meet your needs
Targeted market view to provide pertinent information and save time of readers