
Bulletproof Glass Market Research, 2033
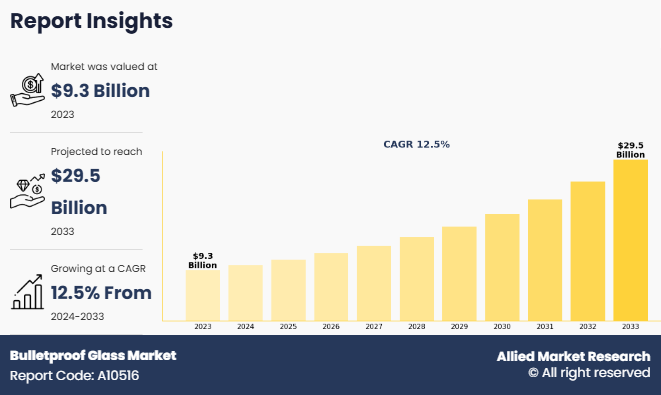
The global bulletproof glass market size was valued at $9.3 billion in 2023, and is projected to reach $29.5 billion by 2033, growing at a CAGR of 12.5% from 2024 to 2033.
Key Takeaways
- On the basis of application, the defense and VIP Vehicles segment held the largest share in the Bulletproof Glass market in 2023.
- By End-user, the automotive segment was the major shareholder in 2023.
- By Security Level, the security level-2 segment dominated the market, in terms of share, in 2023.
- Region wise, North America held the largest market share in 2023.
Bulletproof glass, also known as ballistic-resistant glass, is a specialized transparent material designed to withstand bullets and high-impact forces without shattering. It is typically made by layering polycarbonate, acrylic, or laminated glass with tough interlayers like polyvinyl butyral (PVB) or ethylene-vinyl acetate (EVA). These layers absorb and disperse the energy from projectiles, preventing penetration while minimizing spall (shattered fragments). Bulletproof glass is graded based on its resistance levels, from stopping small-caliber handgun rounds to high-powered rifle bullets. Widely used in security applications, it protects financial institutions, government buildings, armored vehicles, embassies, and military installations.
The demand for bulletproof glass is growing due to increasing security concerns, crime rates, and terrorism threats. Advancements in technology have led to thinner, lighter, and more effective versions that maintain visibility and durability while enhancing safety. It is a crucial component in modern security infrastructure, balancing protection with functionality.
For instance, in October 2024, A business in Victoria has installed bulletproof glass as a proactive measure to combat a rise in break-ins and enhance security. Faced with repeated incidents of vandalism and theft, the company opted for ballistic-resistant glass to protect its premises, deter criminals, and ensure the safety of employees and assets. The reinforced glass provides a strong barrier against forced entry while maintaining visibility and aesthetics. This move reflects a growing trend among businesses of prioritizing security investments amid rising crime concerns.
For instance, in June 2024, Vedanta announced the acquisition of a 46.5% stake in Japan-based glass substrate manufacturer AvanStrate Inc., strengthening its presence in the high-tech glass industry. AvanStrate specializes in advanced glass substrates used in displays and electronics, which share similarities with the materials and processes used in bulletproof glass manufacturing. The acquisition aligns with Vedanta‐™s strategic expansion into specialty glass markets, where technologies like laminated and reinforced glass play a critical role in security applications, including ballistic-resistant glass.
The rise in security concerns worldwide are significantly driving the demand for the bulletproof glass market share. Increasing crime rates, armed robberies, terrorist threats, and violent attacks have led businesses, financial institutions, government buildings, and transportation sectors to invest in ballistic-resistant solutions. The need for enhanced protection in high-risk environments, including banks, embassies, and law enforcement vehicles, is fueling market growth. Growing urbanization and geopolitical tensions are further pushing the adoption of advanced bulletproof glass, ensuring safety while maintaining transparency and durability. Furthermore, surge in Defense & Military Investments and expanding Use in Automotive & Transportation have driven the demand for bulletglass proof glass market.
However, the high production and installation costs of bulletproof glass are significantly hampering demand of bulletproof glass market growth. The complex manufacturing process, involving multiple layers of polycarbonate, acrylic, and specialized coatings, increases production expenses. The heavy weight and thickness of bulletproof glass make installation costly and challenging, requiring reinforced structures. Small businesses and emerging markets often struggle to afford these solutions, limiting adoption. The high upfront investment, combined with maintenance costs, remains a key barrier to market expansion despite growing security concerns. Moreover, weight & thickness Limitations are major factors that hamper the growth of the bulletproof glass market demand.
On the contrary, Advancements in lightweight and flexible bulletproof glass present a lucrative opportunity for market growth. Innovations in nanotechnology, hybrid composites, and advanced polymers are enabling the development of thinner, lighter, and more flexible ballistic-resistant glass without compromising strength. These advancements improve usability in automotive, aerospace, and architectural applications, where weight reduction is crucial. Enhanced transparency and impact resistance make them ideal for modern security needs. As research continues, the adoption of next-generation bulletproof glass is expected to expand across various industries.
Segment Review
The global Bulletproof Glass market is segmented on the basis of application, end users, security level, and region. On the basis of application, the market is divided into bank security level, cash-in-transit, defense and VIP vehicles, government and law enforcement. By End User, the market is segmented into automotive, banking and financing, construction, military, and others. On the basis of security level, the market is segmented into security level-1, security level-2, security level-3, and security level-4 to 8. Region wise, it is analyzed across North America, Europe, Asia-Pacific, and LAMEA

By Application
On the basis of application, the defense and VIP Vehicles segment attained the highest market share in 2023. This is due to increasing security threats, geopolitical tensions, and rising crime rates. Governments and defense agencies worldwide are heavily investing in armored military vehicles, law enforcement fleets, and combat transport to protect personnel in high-risk zones. The growing demand for bulletproof luxury cars for VIPs, politicians, and business executives further boosts this segment. Advancements in lightweight ballistic glass enhance vehicle efficiency without compromising safety. As security concerns rise, the demand for high-performance, impact-resistant glass in defense and VIP transportation continues to grow.

By End User
On the basis of end user, the automotive segment acquired the highest market share in 2023. This is due to their established relationships with automotive manufacturers and their ability to supply high-quality, custom-designed parts that meet specific vehicle requirements. OEMs ensure precise fitment, durability, and performance, making their products the preferred choice for vehicle manufacturers. The growing demand for advanced automotive components and the need for compliance with stringent environmental and noise regulations have further solidified the dominance of OEMs in this market, as they lead in innovation and offer reliable, cost-effective solutions

By Region
Region-wise, North America attained the highest market share in 2023 and emerged as the leading region in the Bulletproof Glass market. This is due to high demand from the defense, law enforcement, banking, and automotive sectors. The region‐™s stringent security regulations and increasing concerns about crime and terrorism drive the adoption of bullet-resistant solutions. The U.S., in particular, sees strong investments in armored vehicles, government buildings, and financial institutions, further boosting market growth. Technological advancements and the presence of leading manufacturers such as PPG Industries and Armortex also contribute to market expansion. The rising use of bulletproof glass in luxury vehicles and commercial buildings enhances demand. Government initiatives to strengthen homeland security and increase defense budgets further solidify North America's dominant position in the global bulletproof glass market.
However, Asia-Pacific is projected to grow at the fastest rate during the forecast period. This due to rising security concerns, increased defense spending, and rapid urbanization. Countries such as China, India, and Japan are heavily investing in military modernization, armored vehicles, and secure infrastructure, driving demand for bullet-resistant glass. The expansion of financial institutions, luxury automotive markets, and commercial buildings with high-security requirements further accelerates growth. The rising threat of geopolitical tensions and crime has led governments and private organizations to adopt advanced security solutions. The presence of local manufacturers and increasing foreign investments in the region also contribute to market expansion. With technological advancements and growing awareness of security, Asia-Pacific continues to lead in market growth for bulletproof glass.
The report focuses on growth prospects, restraints, and trends of the Bulletproof Glass market analysis. The study provides Porter‐™s five forces analysis to understand the impact of numerous factors, such as bargaining power of suppliers, competitive intensity of competitors, threat of new entrants, threat of substitutes, and bargaining power of buyers, on the Bulletproof Glass industry.
Competitive Analysis
The report analyzes the profiles of key players operating in the Bulletproof Glass market such as Apogee Enterprises, Inc., Armass Glass, China Specialty Glass Co. Ltd., Consolidated Glass Holdings Inc., Binswanger Glass, Guardian Industries, AGC Inc, Nippon Sheet Glass Co. Ltd., Saint Gobain S.A., and SCHOTT AG. These players have adopted various strategies to increase their market penetration and strengthen their position in the Bulletproof Glass market.
Rise in Security Concerns
The growing demand for bulletproof glass is primarily driven by rising security concerns across various sectors, including defense, banking, automotive, and commercial infrastructure. For instance, in June 2024, Allegion plc acquired Unicel Architectural Corp., strengthening its ability to address rising security concerns across defense, banking, automotive, and commercial infrastructure. With Unicel‐™s expertise in advanced glass and aluminum products, Allegion offered enhanced security solutions for high-risk environments, including bullet-resistant glass for financial institutions, armored vehicles, and government buildings. This acquisition supported the growing demand for durable, high-performance materials to safeguard against threats such as break-ins, attacks, and forced entry across multiple sectors.
Moreover, increase in crime rates, terrorist threats, and geopolitical tensions have led governments and private entities to invest in advanced security solutions. Financial institutions, embassies, and government buildings are increasingly incorporating bulletproof glass to protect against armed attacks and break-ins. The automotive industry is also witnessing higher demand, with luxury car manufacturers and law enforcement agencies integrating bullet-resistant glass in vehicles for enhanced protection. In addition, military modernization programs worldwide are fueling the need for bulletproof materials in armored vehicles and defense structures. The surge in mass shootings, riots, and civil unrest has further emphasized the importance of high-security infrastructure, prompting businesses and institutions to adopt bulletproof glass as a critical safety measure. As security threats evolve, the demand for advanced, durable, and lightweight bulletproof solutions continues to grow.
Surge in Investment in Defense and Military
The increase in investments in defense and military modernization are significantly driving the demand for the bulletproof glass market. Governments worldwide are focusing on strengthening their security infrastructure due to rising geopolitical tensions, cross-border conflicts, and terrorism threats. Military forces are upgrading armored vehicles, combat helicopters, and secure military bases with advanced bullet-resistant glass to enhance protection for personnel and equipment. For instance, June 2024, Jeet Glass partnered with the Ministry of Defence, Government of India, to support defense production and research initiatives in transparent and opaque armor. Jeet Glass partners with various defense production and R&D units to develop advanced security solutions, including bullet-resistant glass for armored vehicles and structural protection. Its expertise in transparent armor enhances the safety of military personnel, while its contributions to up-armored vehicle development strengthen defense capabilities.
In addition, the growing use of bulletproof glass in bunkers, watchtowers, and naval vessels reflects the need for enhanced security measures in high-risk zones. Countries with rising defense budgets, such as the U.S., China, and India, are actively procuring advanced protective materials for military applications. Technological advancements in lightweight and highly durable bulletproof glass are also increasing its adoption in modern warfare strategies. As nations prioritize national security and troop safety, the demand for high-performance bullet-resistant solutions continues to rise, further driving the growth of the bulletproof glass market globally.
High Production and Installation Costs.
The high production and installation costs of bulletproof glass are major factors hampering its demand in various sectors. Manufacturing bullet-resistant glass involves advanced materials, multiple layers of glass and polycarbonate, and specialized production techniques, making it significantly more expensive than standard glass. Additionally, the complex installation process, which requires reinforced vehicle frames or structural modifications in buildings, further increases costs. These high expenses limit adoption, particularly among small businesses, budget-conscious consumers, and emerging markets with lower defense and security budgets. Furthermore, maintenance and replacement costs add to the long-term financial burden, making some organizations hesitant to invest in bulletproof solutions. While technological advancements are gradually improving cost efficiency, the current high price remains a barrier to widespread adoption. As a result, despite increasing security concerns, the bulletproof glass market faces challenges in expanding its reach across cost-sensitive industries and regions with limited financial resources.
Advancements in Lightweight and Flexible Bulletproof Glass.
Advancements in lightweight and flexible bulletproof glass present a lucrative opportunity for the bulletproof glass market. Traditional bullet-resistant glass is often heavy and thick, limiting its application in automotive, defense, and architectural sectors. However, new technologies are enabling the development of thinner, lighter, and more flexible ballistic glass without compromising strength and durability. These innovations improve vehicle fuel efficiency, reduce structural stress on buildings, and enhance aesthetic appeal, making bulletproof glass more adaptable for a wider range of applications. In addition, the growing demand for high-security solutions in luxury vehicles, smart infrastructure, and military applications is driving investment in advanced materials such as nanotechnology and reinforced polymers. With increasing security concerns worldwide, the adoption of lightweight and flexible bulletproof glass is expected to grow, offering manufacturers a competitive edge and expanding market opportunities in both developed and emerging economies.
Key Benefits for Stakeholders
- This report provides a quantitative analysis of the market segments, current trends, estimations, and dynamics of the Bulletproof Glass market analysis from 2023 to 2032 to identify the prevailing Bulletproof Glass market opportunities.
- Market research is offered along with information related to key drivers, restraints, and opportunities.
- Porter's five forces analysis highlights the potency of buyers and suppliers to enable stakeholders to make profit-oriented business decisions and strengthen their supplier-buyer network.
- In-depth analysis of the Bulletproof Glass market segmentation assists to determine the prevailing market opportunities.
- Major countries in each region are mapped according to their revenue contribution to the global market.
- Market player positioning facilitates benchmarking and provides a clear understanding of the present position of the market players.
- The report includes the analysis of the regional as well as global Bulletproof Glass market trends, key players, market segments, application areas, and market growth strategies.
Bulletproof Glass Market Report Highlights
| Aspects | Details |
| Market Size By 2033 | USD 29.5 billion |
| Growth Rate | CAGR of 12.5% |
| Forecast period | 2023 - 2033 |
| Report Pages | 394 |
| By Security Level |
|
| By Application |
|
| By End Users |
|
| By Region |
|
| Key Market Players | binswanger glass, China Specialty Glass Co. Ltd., Apogee Enterprises, Inc., Saint Gobain S.A., Nippon Sheet Glass Co. Ltd., Schott AG., Consolidated Glass Holdings Inc., Total Security Solutions, Inc., Armass Glass, AGC Inc. |
Upcoming trends in the global bulletproof glass market include advancements in lightweight and flexible bulletproof glass, increased adoption in smart cities and high-security infrastructure, integration of nanotechnology for enhanced durability, rising demand in electric and autonomous vehicles, and growing use in commercial and residential applications for enhanced safety.
Defense and VIP Vehicles is the leading application of Bulletproof Glass Market.
North America is the largest regional market for Bulletproof Glass.
$29541.5 million is the estimated industry size of Bulletproof Glass.
Apogee Enterprises, Inc., Armass Glass, China Specialty Glass Co. Ltd., Consolidated Glass Holdings Inc., Binswanger Glass, Guardian Industries, AGC Inc, Nippon Sheet Glass Co. Ltd., Saint Gobain S.A., and SCHOTT AG.
Loading Table Of Content...
Loading Research Methodology...

