0
2022
Business Income Insurance Market

Business Income Insurance Market

by Type (Standard Business Income Insurance, Extended Business Income Insurance), by Coverage (Profits/Lost Revenue, Taxes and Loan Payments, Mortgage and Rent Payments, Employee’s Wages and Payroll, Relocation Costs, Others), by Loss Type (Fire, Theft, Wind, Lightning, Others), by Distribution Channel (Agents & Brokers, Direct Response, Others  ), by Industry Vertical (Manufacturing, Retail, Construction, IT & Telecom, Healthcare, Energy & Utilities, Transportation & Logistics, Others): Global Opportunity Analysis and Industry Forecast, 2021-2031

Report Code: A17147
Jul 2022 | Pages: 492
Tables: 264
Charts: 84
  • Formats*:

  • pdf

    Single User License, Five User
    License & Enterprise User License

  • xls

    Data Pack Excel License

  • ppt

    It comes with the additional cost
    of $2500.00 contact sales.


Business Income Insurance Market Research, 2031

The global business income insurance market was valued at $14.93 billion in 2021, and is projected to reach $33.54 billion by 2031, growing at a CAGR of 8.8% from 2022 to 2031.

With disruption caused by the pandemic across value chains for several businesses, the demand for business income insurance is expected to increase, owing to rise in awareness among enterprises.

Financial loss an organization experiences when its activities are interfered is referred to as business income coverage risk. This loss consists of both visible components such as decreased sales and increased labor costs, and invisible components such as loss of possible future income streams, owing to reputational risk. Insurance for business revenue and insurance for commercial property are complementary. For instance, if a wind event significantly destroys roof of business, it is forced to be closes for over a month. A business property insurance coverage pays for the roof repair. An insurance policy for company income could provide coverage for income lost during a shutdown.

Availability of several business income insurance providers and rise in need for insurance policies among businesses to protect them against various situations are the main drivers of the business income insurance market growth. The business income insurance market, however, is constrained in its expansion by expensive insurance premiums for business income coverage and lack of knowledge among small enterprises about the sector. On the other hand, it is anticipated that in the years to come, the market will see tremendous growth, wing to spike usage of telematics devices in retail, construction, and healthcare sectors as well as adoption of advance technologies in commercial insurance.

The report focuses on growth prospects, restraints, and trends of the business income insurance market analysis. The study provides Porter's five forces analysis to understand the impact of various factors such as bargaining power of suppliers, competitive intensity of competitors, threat of new entrants, threat of substitutes, and bargaining power of buyers on the business income insurance market outlook.

Business Income Insurance Market, Business Income Insurance Industry, Business Income Insurance Market Size, Business Income Insurance Market Share, Business Income Insurance Market Growth, Business Income Insurance Market Trends, Business Income Insurance Market Analysis, Business Income Insurance Market Forecast

The business income insurance market is segmented into Type, Coverage, Loss Type, Distribution Channel and Industry Vertical.

Segment review

The business income insurance market is segmented into type, coverage, loss type, distribution channel, industry vertical, and region. By type, the market is differentiated into standard business income insurance and extended business income insurance. Depending on coverage, it is fragmented into profits/lost revenue, taxes & loan payments, mortgage, rent & lease payments, employee wages & payroll, relocation costs, and others. The loss type covered in the study includes fire, theft, wind, lightning, and others. The distribution channel segment is segregated into agents & brokers, direct response, and others. By industry vertical, it is segmented into manufacturing, retail, construction, IT & telecom, healthcare, energy & utilities, transportation & logistics, and others. The manufacturing segment is further segregated into automotive, consumer electronics, foods & beverages, and others. The foods & beverages segment is further segmented into large enterprises and small & medium sized enterprises. Region wise, the market is analyzed across North America, Europe, Asia-Pacific, and LAMEA.
Business Income Insurance Market

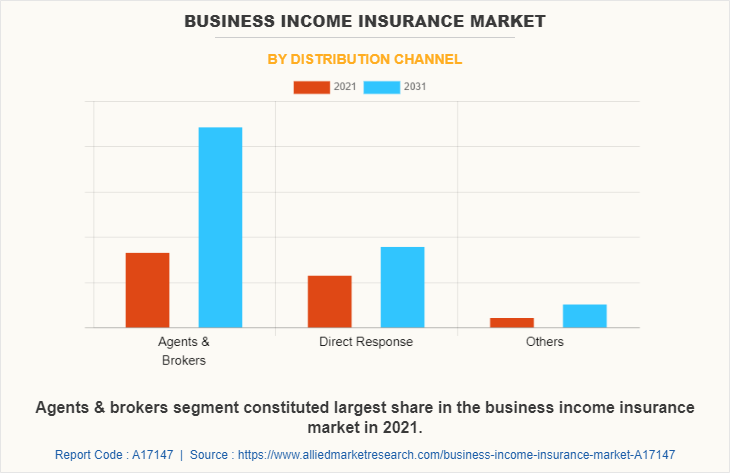
By distribution channel, the agents & brokers segment acquired a major share in the business income insurance market in 2021. This is attributed to the fact that purchasers prefer agents & brokers to acquire business income insurance as consumers have little understanding of appropriate plans to buy for their industry.
Business Income Insurance Market

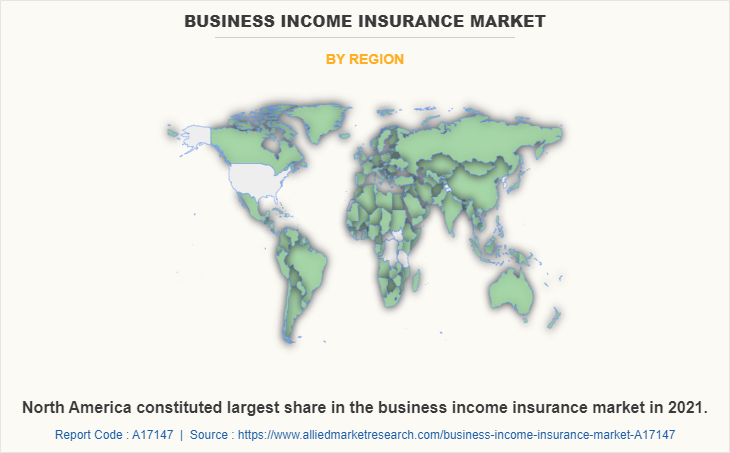
Region wise, North America dominated the business income insurance market in 2021. It is attributed to the fact that collaboration between traditional insurance companies and InsurTech firms has led to rise in newer models and revenue streams, higher profitability, and reduced operational costs in the North America.

Key players operating in the global business income insurance market include American International Group, Inc., Allianz, Allstate Insurance Company, AmTrust Financial, ASSURANT, INC., AXA, Chubb, Employers Mutual Casualty Company, Farmers, Liberty Mutual Insurance Company, Munich RE, Nationwide Mutual Insurance Company, Next Insurance, Inc., State Farm Mutual Automobile Insurance Company, Swiss Re, The Hartford, The Travelers Indemnity Company, and Zurich. These players have adopted various strategies to increase their market penetration and strengthen their position in the business income insurance industry.

COVID-19 Impact Analysis

The COVID-19 outbreak had a negative effect on the market for business income insurance. Business risks are covered by business income insurance plans in all industrial sectors, including manufacturing, communications, logistics, transportation, and oil & gas. Moreover, owing to business interruptions experienced by a number of worldwide industries as a result of the pandemic, business income insurance has suffered. The perception of insurance among consumers has significantly changed as a result of the COVID-19. To protect themselves from danger and cover business losses during the pandemic, company owners opt to get business income insurance plans.

Top Impacting Factors

Increase in need for insurance policies among enterprises

The business is subject to a number of dangers as there are many dangers involved in running a business, however, insurance helps to reduce the responsibilities. Business income insurance can help the firm carry on operations in the case of a tragedy. The danger of a major loss or closure affects both the company and the insurance provider. A business can reduce the risk of doing business by purchasing commercial credit risk insurance, which guards against customer bankruptcy. Moreover, the firm can pay for litigation and claims without experiencing a substantial financial loss owing to the commercial liability insurance coverage which is included in business income insurance. Furthermore, due to the remote working option provided by IT businesses, hackers are also attempting to take advantage of the COVID-19 scenario by compromising accounts, stealing data, and stealing money. For instance, a poll done in June 2020 by nextcaller.com found that the corona virus pandemic has led to a 50% rise in fraud calls to business owners. The market for business income insurance and cyber insurance is expanding as a result of the rise in the number of such incidents among business owners.

Adoption of business income insurance in managing business liabilities

It is never certain that a company will continue to turn a profit each year. The company could at some time experience an unexpected loss. In such situation, insurance can offer financial assistance to reduce the risk. There can be an event that results in catastrophic loss. Such events can be avoided if the company has current business income insurance. A significant financial loss, though, can be hazardous if the company's insurance isn't in place. Moreover, insurance assists in recovering the majority of a business's financial losses in the event of a significant loss. In addition, it also keeps the company from being under financial strain. The business income insurance lowers the risk of financial loss in the event of a crisis by allowing the company to continue functioning without interruption. Additionally, it safeguards against robbery or unnatural money loss while in transit. Thus, the adoption of business income insurance in managing business liabilities in driving the growth of the market.

Availability of large number of insurance providers

Over the years, there has been a noticeable rise in the number of business income insurance coverage carriers, mostly as a result of a development in the number of enterprises and the variety of company coverage. Due to the abundance of insurance carriers, there is fierce rivalry among different companies that offer a variety of coverage for companies of all sizes. Additionally, the presence of several business insurance carriers has helped the market environment because a wide range of insurance products are now accessible for all sizes and types of businesses. Furthermore, business owners are increasingly adopting business income insurance coverage based on the premium charged for the policies, as the premium remains constant throughout the market. This is expected to boost growth of the business insurance market share.

KEY BENEFITS FOR STAKEHOLDERS

  • This report provides a quantitative analysis of the market segments, current trends, estimations, and dynamics of the business income insurance market size and forecast from 2021 to 2031 to identify prevailing business income insurance market opportunities.
  • The market research is offered along with information related to key drivers, restraints, and opportunities.
  • Porter's five forces analysis highlights the potency of buyers and suppliers to enable stakeholders make profit-oriented business decisions and strengthen their supplier-buyer network.
  • In-depth analysis of the business income insurance market trends assists to determine the prevailing market opportunities.
  • Major countries in each region are mapped according to their revenue contribution to the business income insurance market forecast.
  • Market player positioning facilitates benchmarking and provides a clear understanding of the present position of the market players.
  • The report includes the analysis of the regional as well as global business income insurance market share, trends, key players, market segments, application areas, and market growth strategies.

Business Income Insurance Market Report Highlights

Aspects Details
By Type
  • Standard Business Income Insurance
  • Extended Business Income Insurance
By Coverage
  • Profits/Lost Revenue
  • Taxes and Loan Payments
  • Mortgage and Rent Payments
  • Employee’s Wages and Payroll
  • Relocation Costs
  • Others
By Loss Type
  • Fire
  • Theft
  • Wind
  • Lightning
  • Others
By Distribution Channel
  • Agents & Brokers
  • Direct Response
  • Others  
By Industry Vertical
  • Manufacturing
  • Retail
  • Construction
  • IT & Telecom
  • Healthcare
  • Energy & Utilities
  • Transportation & Logistics
  • Others
By Region
  • North America  (U.S., Canada)
  • Europe  (United Kingdom, Germany, France, Italy, Spain, Netherlands, Rest of Europe)
  • Asia-Pacific  (China, Japan, India, Australia, South Korea, Singapore, Rest of Asia-Pacific)
  • LAMEA  (Latin America, Middle East, South Africa)
Key Market Players Zurich, Munich RE, The Hartford, State Farm Mutual Automobile Insurance Company, Farmers, AmTrust Financial, Nationwide Mutual Insurance Company, Next Insurance, Inc., Employers Mutual Casualty Company, ASSURANT, INC., Allianz, Allstate Insurance Company, AXA, Chubb, American International Group, Inc., The Travelers Indemnity Company, Liberty Mutual Insurance Company, Swiss Re
 
  • CHAPTER 1:INTRODUCTION

    • 1.1.Report description

    • 1.2.Key market segments

    • 1.3.Key benefits to the stakeholders

    • 1.4.Research Methodology

      • 1.4.1.Secondary research

      • 1.4.2.Primary research

      • 1.4.3.Analyst tools and models

  • CHAPTER 2:EXECUTIVE SUMMARY

    • 2.1.Key findings of the study

    • 2.2.CXO Perspective

  • CHAPTER 3:MARKET OVERVIEW

    • 3.1.Market definition and scope

    • 3.2.Key findings

      • 3.2.1.Top investment pockets

    • 3.3.Porter’s five forces analysis

    • 3.4.Top player positioning

    • 3.5.Market dynamics

      • 3.5.1.Drivers

      • 3.5.2.Restraints

      • 3.5.3.Opportunities

    • 3.6.COVID-19 Impact Analysis on the market

  • CHAPTER 4: BUSINESS INCOME INSURANCE MARKET, BY TYPE

    • 4.1 Overview

      • 4.1.1 Market size and forecast

    • 4.2 Standard Business Income Insurance

      • 4.2.1 Key market trends, growth factors and opportunities

      • 4.2.2 Market size and forecast, by region

      • 4.2.3 Market analysis by country

    • 4.3 Extended Business Income Insurance

      • 4.3.1 Key market trends, growth factors and opportunities

      • 4.3.2 Market size and forecast, by region

      • 4.3.3 Market analysis by country

  • CHAPTER 5: BUSINESS INCOME INSURANCE MARKET, BY COVERAGE

    • 5.1 Overview

      • 5.1.1 Market size and forecast

    • 5.2 Profits/Lost Revenue

      • 5.2.1 Key market trends, growth factors and opportunities

      • 5.2.2 Market size and forecast, by region

      • 5.2.3 Market analysis by country

    • 5.3 Taxes and Loan Payments

      • 5.3.1 Key market trends, growth factors and opportunities

      • 5.3.2 Market size and forecast, by region

      • 5.3.3 Market analysis by country

    • 5.4 Mortgage and Rent Payments

      • 5.4.1 Key market trends, growth factors and opportunities

      • 5.4.2 Market size and forecast, by region

      • 5.4.3 Market analysis by country

    • 5.5 Employee’s Wages and Payroll

      • 5.5.1 Key market trends, growth factors and opportunities

      • 5.5.2 Market size and forecast, by region

      • 5.5.3 Market analysis by country

    • 5.6 Relocation Costs

      • 5.6.1 Key market trends, growth factors and opportunities

      • 5.6.2 Market size and forecast, by region

      • 5.6.3 Market analysis by country

    • 5.7 Others

      • 5.7.1 Key market trends, growth factors and opportunities

      • 5.7.2 Market size and forecast, by region

      • 5.7.3 Market analysis by country

  • CHAPTER 6: BUSINESS INCOME INSURANCE MARKET, BY LOSS TYPE

    • 6.1 Overview

      • 6.1.1 Market size and forecast

    • 6.2 Fire

      • 6.2.1 Key market trends, growth factors and opportunities

      • 6.2.2 Market size and forecast, by region

      • 6.2.3 Market analysis by country

    • 6.3 Theft

      • 6.3.1 Key market trends, growth factors and opportunities

      • 6.3.2 Market size and forecast, by region

      • 6.3.3 Market analysis by country

    • 6.4 Wind

      • 6.4.1 Key market trends, growth factors and opportunities

      • 6.4.2 Market size and forecast, by region

      • 6.4.3 Market analysis by country

    • 6.5 Lightning

      • 6.5.1 Key market trends, growth factors and opportunities

      • 6.5.2 Market size and forecast, by region

      • 6.5.3 Market analysis by country

    • 6.6 Others

      • 6.6.1 Key market trends, growth factors and opportunities

      • 6.6.2 Market size and forecast, by region

      • 6.6.3 Market analysis by country

  • CHAPTER 7: BUSINESS INCOME INSURANCE MARKET, BY DISTRIBUTION CHANNEL

    • 7.1 Overview

      • 7.1.1 Market size and forecast

    • 7.2 Agents & Brokers

      • 7.2.1 Key market trends, growth factors and opportunities

      • 7.2.2 Market size and forecast, by region

      • 7.2.3 Market analysis by country

    • 7.3 Direct Response

      • 7.3.1 Key market trends, growth factors and opportunities

      • 7.3.2 Market size and forecast, by region

      • 7.3.3 Market analysis by country

    • 7.4 Others  

      • 7.4.1 Key market trends, growth factors and opportunities

      • 7.4.2 Market size and forecast, by region

      • 7.4.3 Market analysis by country

  • CHAPTER 8: BUSINESS INCOME INSURANCE MARKET, BY INDUSTRY VERTICAL

    • 8.1 Overview

      • 8.1.1 Market size and forecast

    • 8.2 Manufacturing

      • 8.2.1 Key market trends, growth factors and opportunities

      • 8.2.2 Market size and forecast, by region

      • 8.2.3 Market analysis by country

    • 8.3 Retail

      • 8.3.1 Key market trends, growth factors and opportunities

      • 8.3.2 Market size and forecast, by region

      • 8.3.3 Market analysis by country

    • 8.4 Construction

      • 8.4.1 Key market trends, growth factors and opportunities

      • 8.4.2 Market size and forecast, by region

      • 8.4.3 Market analysis by country

    • 8.5 IT & Telecom

      • 8.5.1 Key market trends, growth factors and opportunities

      • 8.5.2 Market size and forecast, by region

      • 8.5.3 Market analysis by country

    • 8.6 Healthcare

      • 8.6.1 Key market trends, growth factors and opportunities

      • 8.6.2 Market size and forecast, by region

      • 8.6.3 Market analysis by country

    • 8.7 Energy & Utilities

      • 8.7.1 Key market trends, growth factors and opportunities

      • 8.7.2 Market size and forecast, by region

      • 8.7.3 Market analysis by country

    • 8.8 Transportation & Logistics

      • 8.8.1 Key market trends, growth factors and opportunities

      • 8.8.2 Market size and forecast, by region

      • 8.8.3 Market analysis by country

    • 8.9 Others

      • 8.9.1 Key market trends, growth factors and opportunities

      • 8.9.2 Market size and forecast, by region

      • 8.9.3 Market analysis by country

  • CHAPTER 9: BUSINESS INCOME INSURANCE MARKET, BY REGION

    • 9.1 Overview

      • 9.1.1 Market size and forecast

    • 9.2 North America

      • 9.2.1 Key trends and opportunities

      • 9.2.2 North America Market size and forecast, by Type

      • 9.2.3 North America Market size and forecast, by Coverage

      • 9.2.4 North America Market size and forecast, by Loss Type

      • 9.2.5 North America Market size and forecast, by Distribution Channel

      • 9.2.6 North America Market size and forecast, by Industry Vertical

      • 9.2.7 North America Market size and forecast, by country

        • 9.2.7.1 U.S.
          • 9.2.7.1.1 Market size and forecast, by Type
          • 9.2.7.1.2 Market size and forecast, by Coverage
          • 9.2.7.1.3 Market size and forecast, by Loss Type
          • 9.2.7.1.4 Market size and forecast, by Distribution Channel
          • 9.2.7.1.5 Market size and forecast, by Industry Vertical
        • 9.2.7.2 Canada
          • 9.2.7.2.1 Market size and forecast, by Type
          • 9.2.7.2.2 Market size and forecast, by Coverage
          • 9.2.7.2.3 Market size and forecast, by Loss Type
          • 9.2.7.2.4 Market size and forecast, by Distribution Channel
          • 9.2.7.2.5 Market size and forecast, by Industry Vertical
    • 9.3 Europe

      • 9.3.1 Key trends and opportunities

      • 9.3.2 Europe Market size and forecast, by Type

      • 9.3.3 Europe Market size and forecast, by Coverage

      • 9.3.4 Europe Market size and forecast, by Loss Type

      • 9.3.5 Europe Market size and forecast, by Distribution Channel

      • 9.3.6 Europe Market size and forecast, by Industry Vertical

      • 9.3.7 Europe Market size and forecast, by country

        • 9.3.7.1 United Kingdom
          • 9.3.7.1.1 Market size and forecast, by Type
          • 9.3.7.1.2 Market size and forecast, by Coverage
          • 9.3.7.1.3 Market size and forecast, by Loss Type
          • 9.3.7.1.4 Market size and forecast, by Distribution Channel
          • 9.3.7.1.5 Market size and forecast, by Industry Vertical
        • 9.3.7.2 Germany
          • 9.3.7.2.1 Market size and forecast, by Type
          • 9.3.7.2.2 Market size and forecast, by Coverage
          • 9.3.7.2.3 Market size and forecast, by Loss Type
          • 9.3.7.2.4 Market size and forecast, by Distribution Channel
          • 9.3.7.2.5 Market size and forecast, by Industry Vertical
        • 9.3.7.3 France
          • 9.3.7.3.1 Market size and forecast, by Type
          • 9.3.7.3.2 Market size and forecast, by Coverage
          • 9.3.7.3.3 Market size and forecast, by Loss Type
          • 9.3.7.3.4 Market size and forecast, by Distribution Channel
          • 9.3.7.3.5 Market size and forecast, by Industry Vertical
        • 9.3.7.4 Italy
          • 9.3.7.4.1 Market size and forecast, by Type
          • 9.3.7.4.2 Market size and forecast, by Coverage
          • 9.3.7.4.3 Market size and forecast, by Loss Type
          • 9.3.7.4.4 Market size and forecast, by Distribution Channel
          • 9.3.7.4.5 Market size and forecast, by Industry Vertical
        • 9.3.7.5 Spain
          • 9.3.7.5.1 Market size and forecast, by Type
          • 9.3.7.5.2 Market size and forecast, by Coverage
          • 9.3.7.5.3 Market size and forecast, by Loss Type
          • 9.3.7.5.4 Market size and forecast, by Distribution Channel
          • 9.3.7.5.5 Market size and forecast, by Industry Vertical
        • 9.3.7.6 Netherlands
          • 9.3.7.6.1 Market size and forecast, by Type
          • 9.3.7.6.2 Market size and forecast, by Coverage
          • 9.3.7.6.3 Market size and forecast, by Loss Type
          • 9.3.7.6.4 Market size and forecast, by Distribution Channel
          • 9.3.7.6.5 Market size and forecast, by Industry Vertical
        • 9.3.7.7 Rest of Europe
          • 9.3.7.7.1 Market size and forecast, by Type
          • 9.3.7.7.2 Market size and forecast, by Coverage
          • 9.3.7.7.3 Market size and forecast, by Loss Type
          • 9.3.7.7.4 Market size and forecast, by Distribution Channel
          • 9.3.7.7.5 Market size and forecast, by Industry Vertical
    • 9.4 Asia-Pacific

      • 9.4.1 Key trends and opportunities

      • 9.4.2 Asia-Pacific Market size and forecast, by Type

      • 9.4.3 Asia-Pacific Market size and forecast, by Coverage

      • 9.4.4 Asia-Pacific Market size and forecast, by Loss Type

      • 9.4.5 Asia-Pacific Market size and forecast, by Distribution Channel

      • 9.4.6 Asia-Pacific Market size and forecast, by Industry Vertical

      • 9.4.7 Asia-Pacific Market size and forecast, by country

        • 9.4.7.1 China
          • 9.4.7.1.1 Market size and forecast, by Type
          • 9.4.7.1.2 Market size and forecast, by Coverage
          • 9.4.7.1.3 Market size and forecast, by Loss Type
          • 9.4.7.1.4 Market size and forecast, by Distribution Channel
          • 9.4.7.1.5 Market size and forecast, by Industry Vertical
        • 9.4.7.2 Japan
          • 9.4.7.2.1 Market size and forecast, by Type
          • 9.4.7.2.2 Market size and forecast, by Coverage
          • 9.4.7.2.3 Market size and forecast, by Loss Type
          • 9.4.7.2.4 Market size and forecast, by Distribution Channel
          • 9.4.7.2.5 Market size and forecast, by Industry Vertical
        • 9.4.7.3 India
          • 9.4.7.3.1 Market size and forecast, by Type
          • 9.4.7.3.2 Market size and forecast, by Coverage
          • 9.4.7.3.3 Market size and forecast, by Loss Type
          • 9.4.7.3.4 Market size and forecast, by Distribution Channel
          • 9.4.7.3.5 Market size and forecast, by Industry Vertical
        • 9.4.7.4 Australia
          • 9.4.7.4.1 Market size and forecast, by Type
          • 9.4.7.4.2 Market size and forecast, by Coverage
          • 9.4.7.4.3 Market size and forecast, by Loss Type
          • 9.4.7.4.4 Market size and forecast, by Distribution Channel
          • 9.4.7.4.5 Market size and forecast, by Industry Vertical
        • 9.4.7.5 South Korea
          • 9.4.7.5.1 Market size and forecast, by Type
          • 9.4.7.5.2 Market size and forecast, by Coverage
          • 9.4.7.5.3 Market size and forecast, by Loss Type
          • 9.4.7.5.4 Market size and forecast, by Distribution Channel
          • 9.4.7.5.5 Market size and forecast, by Industry Vertical
        • 9.4.7.6 Singapore
          • 9.4.7.6.1 Market size and forecast, by Type
          • 9.4.7.6.2 Market size and forecast, by Coverage
          • 9.4.7.6.3 Market size and forecast, by Loss Type
          • 9.4.7.6.4 Market size and forecast, by Distribution Channel
          • 9.4.7.6.5 Market size and forecast, by Industry Vertical
        • 9.4.7.7 Rest of Asia-Pacific
          • 9.4.7.7.1 Market size and forecast, by Type
          • 9.4.7.7.2 Market size and forecast, by Coverage
          • 9.4.7.7.3 Market size and forecast, by Loss Type
          • 9.4.7.7.4 Market size and forecast, by Distribution Channel
          • 9.4.7.7.5 Market size and forecast, by Industry Vertical
    • 9.5 LAMEA

      • 9.5.1 Key trends and opportunities

      • 9.5.2 LAMEA Market size and forecast, by Type

      • 9.5.3 LAMEA Market size and forecast, by Coverage

      • 9.5.4 LAMEA Market size and forecast, by Loss Type

      • 9.5.5 LAMEA Market size and forecast, by Distribution Channel

      • 9.5.6 LAMEA Market size and forecast, by Industry Vertical

      • 9.5.7 LAMEA Market size and forecast, by country

        • 9.5.7.1 Latin America
          • 9.5.7.1.1 Market size and forecast, by Type
          • 9.5.7.1.2 Market size and forecast, by Coverage
          • 9.5.7.1.3 Market size and forecast, by Loss Type
          • 9.5.7.1.4 Market size and forecast, by Distribution Channel
          • 9.5.7.1.5 Market size and forecast, by Industry Vertical
        • 9.5.7.2 Middle East
          • 9.5.7.2.1 Market size and forecast, by Type
          • 9.5.7.2.2 Market size and forecast, by Coverage
          • 9.5.7.2.3 Market size and forecast, by Loss Type
          • 9.5.7.2.4 Market size and forecast, by Distribution Channel
          • 9.5.7.2.5 Market size and forecast, by Industry Vertical
        • 9.5.7.3 South Africa
          • 9.5.7.3.1 Market size and forecast, by Type
          • 9.5.7.3.2 Market size and forecast, by Coverage
          • 9.5.7.3.3 Market size and forecast, by Loss Type
          • 9.5.7.3.4 Market size and forecast, by Distribution Channel
          • 9.5.7.3.5 Market size and forecast, by Industry Vertical
  • CHAPTER 10: COMPANY LANDSCAPE

    • 10.1. Introduction

    • 10.2. Top winning strategies

    • 10.3. Product Mapping of Top 10 Player

    • 10.4. Competitive Dashboard

    • 10.5. Competitive Heatmap

    • 10.6. Key developments

  • CHAPTER 11: COMPANY PROFILES

    • 11.1 American International Group, Inc.

      • 11.1.1 Company overview

      • 11.1.2 Company snapshot

      • 11.1.3 Operating business segments

      • 11.1.4 Product portfolio

      • 11.1.5 Business performance

      • 11.1.6 Key strategic moves and developments

    • 11.2 Allianz

      • 11.2.1 Company overview

      • 11.2.2 Company snapshot

      • 11.2.3 Operating business segments

      • 11.2.4 Product portfolio

      • 11.2.5 Business performance

      • 11.2.6 Key strategic moves and developments

    • 11.3 Allstate Insurance Company

      • 11.3.1 Company overview

      • 11.3.2 Company snapshot

      • 11.3.3 Operating business segments

      • 11.3.4 Product portfolio

      • 11.3.5 Business performance

      • 11.3.6 Key strategic moves and developments

    • 11.4 AmTrust Financial

      • 11.4.1 Company overview

      • 11.4.2 Company snapshot

      • 11.4.3 Operating business segments

      • 11.4.4 Product portfolio

      • 11.4.5 Business performance

      • 11.4.6 Key strategic moves and developments

    • 11.5 ASSURANT, INC.

      • 11.5.1 Company overview

      • 11.5.2 Company snapshot

      • 11.5.3 Operating business segments

      • 11.5.4 Product portfolio

      • 11.5.5 Business performance

      • 11.5.6 Key strategic moves and developments

    • 11.6 AXA

      • 11.6.1 Company overview

      • 11.6.2 Company snapshot

      • 11.6.3 Operating business segments

      • 11.6.4 Product portfolio

      • 11.6.5 Business performance

      • 11.6.6 Key strategic moves and developments

    • 11.7 Chubb

      • 11.7.1 Company overview

      • 11.7.2 Company snapshot

      • 11.7.3 Operating business segments

      • 11.7.4 Product portfolio

      • 11.7.5 Business performance

      • 11.7.6 Key strategic moves and developments

    • 11.8 Employers Mutual Casualty Company

      • 11.8.1 Company overview

      • 11.8.2 Company snapshot

      • 11.8.3 Operating business segments

      • 11.8.4 Product portfolio

      • 11.8.5 Business performance

      • 11.8.6 Key strategic moves and developments

    • 11.9 Farmers

      • 11.9.1 Company overview

      • 11.9.2 Company snapshot

      • 11.9.3 Operating business segments

      • 11.9.4 Product portfolio

      • 11.9.5 Business performance

      • 11.9.6 Key strategic moves and developments

    • 11.10 Liberty Mutual Insurance Company

      • 11.10.1 Company overview

      • 11.10.2 Company snapshot

      • 11.10.3 Operating business segments

      • 11.10.4 Product portfolio

      • 11.10.5 Business performance

      • 11.10.6 Key strategic moves and developments

    • 11.11 Munich RE

      • 11.11.1 Company overview

      • 11.11.2 Company snapshot

      • 11.11.3 Operating business segments

      • 11.11.4 Product portfolio

      • 11.11.5 Business performance

      • 11.11.6 Key strategic moves and developments

    • 11.12 Nationwide Mutual Insurance Company

      • 11.12.1 Company overview

      • 11.12.2 Company snapshot

      • 11.12.3 Operating business segments

      • 11.12.4 Product portfolio

      • 11.12.5 Business performance

      • 11.12.6 Key strategic moves and developments

    • 11.13 Next Insurance, Inc.

      • 11.13.1 Company overview

      • 11.13.2 Company snapshot

      • 11.13.3 Operating business segments

      • 11.13.4 Product portfolio

      • 11.13.5 Business performance

      • 11.13.6 Key strategic moves and developments

    • 11.14 State Farm Mutual Automobile Insurance Company

      • 11.14.1 Company overview

      • 11.14.2 Company snapshot

      • 11.14.3 Operating business segments

      • 11.14.4 Product portfolio

      • 11.14.5 Business performance

      • 11.14.6 Key strategic moves and developments

    • 11.15 Swiss Re

      • 11.15.1 Company overview

      • 11.15.2 Company snapshot

      • 11.15.3 Operating business segments

      • 11.15.4 Product portfolio

      • 11.15.5 Business performance

      • 11.15.6 Key strategic moves and developments

    • 11.16 The Hartford

      • 11.16.1 Company overview

      • 11.16.2 Company snapshot

      • 11.16.3 Operating business segments

      • 11.16.4 Product portfolio

      • 11.16.5 Business performance

      • 11.16.6 Key strategic moves and developments

    • 11.17 The Travelers Indemnity Company

      • 11.17.1 Company overview

      • 11.17.2 Company snapshot

      • 11.17.3 Operating business segments

      • 11.17.4 Product portfolio

      • 11.17.5 Business performance

      • 11.17.6 Key strategic moves and developments

    • 11.18 Zurich

      • 11.18.1 Company overview

      • 11.18.2 Company snapshot

      • 11.18.3 Operating business segments

      • 11.18.4 Product portfolio

      • 11.18.5 Business performance

      • 11.18.6 Key strategic moves and developments

  • LIST OF TABLES

  • TABLE 1. GLOBAL BUSINESS INCOME INSURANCE MARKET, BY TYPE, 2021-2031 ($MILLION)
    TABLE 2. BUSINESS INCOME INSURANCE MARKET SIZE, FOR STANDARD BUSINESS INCOME INSURANCE, BY REGION, 2021-2031 ($MILLION)
    TABLE 3. BUSINESS INCOME INSURANCE MARKET FOR STANDARD BUSINESS INCOME INSURANCE BY COUNTRY, 2021-2031 ($MILLION)
    TABLE 4. BUSINESS INCOME INSURANCE MARKET SIZE, FOR EXTENDED BUSINESS INCOME INSURANCE, BY REGION, 2021-2031 ($MILLION)
    TABLE 5. BUSINESS INCOME INSURANCE MARKET FOR EXTENDED BUSINESS INCOME INSURANCE BY COUNTRY, 2021-2031 ($MILLION)
    TABLE 6. GLOBAL BUSINESS INCOME INSURANCE MARKET, BY COVERAGE, 2021-2031 ($MILLION)
    TABLE 7. BUSINESS INCOME INSURANCE MARKET SIZE, FOR PROFITS/LOST REVENUE, BY REGION, 2021-2031 ($MILLION)
    TABLE 8. BUSINESS INCOME INSURANCE MARKET FOR PROFITS/LOST REVENUE BY COUNTRY, 2021-2031 ($MILLION)
    TABLE 9. BUSINESS INCOME INSURANCE MARKET SIZE, FOR TAXES AND LOAN PAYMENTS, BY REGION, 2021-2031 ($MILLION)
    TABLE 10. BUSINESS INCOME INSURANCE MARKET FOR TAXES AND LOAN PAYMENTS BY COUNTRY, 2021-2031 ($MILLION)
    TABLE 11. BUSINESS INCOME INSURANCE MARKET SIZE, FOR MORTGAGE AND RENT PAYMENTS, BY REGION, 2021-2031 ($MILLION)
    TABLE 12. BUSINESS INCOME INSURANCE MARKET FOR MORTGAGE AND RENT PAYMENTS BY COUNTRY, 2021-2031 ($MILLION)
    TABLE 13. BUSINESS INCOME INSURANCE MARKET SIZE, FOR EMPLOYEE’S WAGES AND PAYROLL, BY REGION, 2021-2031 ($MILLION)
    TABLE 14. BUSINESS INCOME INSURANCE MARKET FOR EMPLOYEE’S WAGES AND PAYROLL BY COUNTRY, 2021-2031 ($MILLION)
    TABLE 15. BUSINESS INCOME INSURANCE MARKET SIZE, FOR RELOCATION COSTS, BY REGION, 2021-2031 ($MILLION)
    TABLE 16. BUSINESS INCOME INSURANCE MARKET FOR RELOCATION COSTS BY COUNTRY, 2021-2031 ($MILLION)
    TABLE 17. BUSINESS INCOME INSURANCE MARKET SIZE, FOR OTHERS, BY REGION, 2021-2031 ($MILLION)
    TABLE 18. BUSINESS INCOME INSURANCE MARKET FOR OTHERS BY COUNTRY, 2021-2031 ($MILLION)
    TABLE 19. GLOBAL BUSINESS INCOME INSURANCE MARKET, BY LOSS TYPE, 2021-2031 ($MILLION)
    TABLE 20. BUSINESS INCOME INSURANCE MARKET SIZE, FOR FIRE, BY REGION, 2021-2031 ($MILLION)
    TABLE 21. BUSINESS INCOME INSURANCE MARKET FOR FIRE BY COUNTRY, 2021-2031 ($MILLION)
    TABLE 22. BUSINESS INCOME INSURANCE MARKET SIZE, FOR THEFT, BY REGION, 2021-2031 ($MILLION)
    TABLE 23. BUSINESS INCOME INSURANCE MARKET FOR THEFT BY COUNTRY, 2021-2031 ($MILLION)
    TABLE 24. BUSINESS INCOME INSURANCE MARKET SIZE, FOR WIND, BY REGION, 2021-2031 ($MILLION)
    TABLE 25. BUSINESS INCOME INSURANCE MARKET FOR WIND BY COUNTRY, 2021-2031 ($MILLION)
    TABLE 26. BUSINESS INCOME INSURANCE MARKET SIZE, FOR LIGHTNING, BY REGION, 2021-2031 ($MILLION)
    TABLE 27. BUSINESS INCOME INSURANCE MARKET FOR LIGHTNING BY COUNTRY, 2021-2031 ($MILLION)
    TABLE 28. BUSINESS INCOME INSURANCE MARKET SIZE, FOR OTHERS, BY REGION, 2021-2031 ($MILLION)
    TABLE 29. BUSINESS INCOME INSURANCE MARKET FOR OTHERS BY COUNTRY, 2021-2031 ($MILLION)
    TABLE 30. GLOBAL BUSINESS INCOME INSURANCE MARKET, BY DISTRIBUTION CHANNEL, 2021-2031 ($MILLION)
    TABLE 31. BUSINESS INCOME INSURANCE MARKET SIZE, FOR AGENTS & BROKERS, BY REGION, 2021-2031 ($MILLION)
    TABLE 32. BUSINESS INCOME INSURANCE MARKET FOR AGENTS & BROKERS BY COUNTRY, 2021-2031 ($MILLION)
    TABLE 33. BUSINESS INCOME INSURANCE MARKET SIZE, FOR DIRECT RESPONSE, BY REGION, 2021-2031 ($MILLION)
    TABLE 34. BUSINESS INCOME INSURANCE MARKET FOR DIRECT RESPONSE BY COUNTRY, 2021-2031 ($MILLION)
    TABLE 35. BUSINESS INCOME INSURANCE MARKET SIZE, FOR OTHERS  , BY REGION, 2021-2031 ($MILLION)
    TABLE 36. BUSINESS INCOME INSURANCE MARKET FOR OTHERS   BY COUNTRY, 2021-2031 ($MILLION)
    TABLE 37. GLOBAL BUSINESS INCOME INSURANCE MARKET, BY INDUSTRY VERTICAL, 2021-2031 ($MILLION)
    TABLE 38. BUSINESS INCOME INSURANCE MARKET SIZE, FOR MANUFACTURING, BY REGION, 2021-2031 ($MILLION)
    TABLE 39. BUSINESS INCOME INSURANCE MARKET FOR MANUFACTURING BY COUNTRY, 2021-2031 ($MILLION)
    TABLE 40. BUSINESS INCOME INSURANCE MARKET SIZE, FOR RETAIL, BY REGION, 2021-2031 ($MILLION)
    TABLE 41. BUSINESS INCOME INSURANCE MARKET FOR RETAIL BY COUNTRY, 2021-2031 ($MILLION)
    TABLE 42. BUSINESS INCOME INSURANCE MARKET SIZE, FOR CONSTRUCTION, BY REGION, 2021-2031 ($MILLION)
    TABLE 43. BUSINESS INCOME INSURANCE MARKET FOR CONSTRUCTION BY COUNTRY, 2021-2031 ($MILLION)
    TABLE 44. BUSINESS INCOME INSURANCE MARKET SIZE, FOR IT & TELECOM, BY REGION, 2021-2031 ($MILLION)
    TABLE 45. BUSINESS INCOME INSURANCE MARKET FOR IT & TELECOM BY COUNTRY, 2021-2031 ($MILLION)
    TABLE 46. BUSINESS INCOME INSURANCE MARKET SIZE, FOR HEALTHCARE, BY REGION, 2021-2031 ($MILLION)
    TABLE 47. BUSINESS INCOME INSURANCE MARKET FOR HEALTHCARE BY COUNTRY, 2021-2031 ($MILLION)
    TABLE 48. BUSINESS INCOME INSURANCE MARKET SIZE, FOR ENERGY & UTILITIES, BY REGION, 2021-2031 ($MILLION)
    TABLE 49. BUSINESS INCOME INSURANCE MARKET FOR ENERGY & UTILITIES BY COUNTRY, 2021-2031 ($MILLION)
    TABLE 50. BUSINESS INCOME INSURANCE MARKET SIZE, FOR TRANSPORTATION & LOGISTICS, BY REGION, 2021-2031 ($MILLION)
    TABLE 51. BUSINESS INCOME INSURANCE MARKET FOR TRANSPORTATION & LOGISTICS BY COUNTRY, 2021-2031 ($MILLION)
    TABLE 52. BUSINESS INCOME INSURANCE MARKET SIZE, FOR OTHERS, BY REGION, 2021-2031 ($MILLION)
    TABLE 53. BUSINESS INCOME INSURANCE MARKET FOR OTHERS BY COUNTRY, 2021-2031 ($MILLION)
    TABLE 54. BUSINESS INCOME INSURANCE MARKET, BY REGION, 2021-2031 ($MILLION)
    TABLE 55. NORTH AMERICA BUSINESS INCOME INSURANCE MARKET, BY TYPE, 2021-2031 ($MILLION)
    TABLE 56. NORTH AMERICA BUSINESS INCOME INSURANCE MARKET, BY COVERAGE, 2021-2031 ($MILLION)
    TABLE 57. NORTH AMERICA BUSINESS INCOME INSURANCE MARKET, BY LOSS TYPE, 2021-2031 ($MILLION)
    TABLE 58. NORTH AMERICA BUSINESS INCOME INSURANCE MARKET, BY DISTRIBUTION CHANNEL, 2021-2031 ($MILLION)
    TABLE 59. NORTH AMERICA BUSINESS INCOME INSURANCE MARKET, BY INDUSTRY VERTICAL, 2021-2031 ($MILLION)
    TABLE 60. NORTH AMERICA BUSINESS INCOME INSURANCE MARKET, BY COUNTRY, 2021-2031 ($MILLION)
    TABLE 61. U.S. BUSINESS INCOME INSURANCE MARKET, BY TYPE, 2021-2031 ($MILLION)
    TABLE 62. U.S. BUSINESS INCOME INSURANCE MARKET, BY COVERAGE, 2021-2031 ($MILLION)
    TABLE 63. U.S. BUSINESS INCOME INSURANCE MARKET, BY LOSS TYPE, 2021-2031 ($MILLION)
    TABLE 64. U.S. BUSINESS INCOME INSURANCE MARKET, BY DISTRIBUTION CHANNEL, 2021-2031 ($MILLION)
    TABLE 65. U.S. BUSINESS INCOME INSURANCE MARKET, BY INDUSTRY VERTICAL, 2021-2031 ($MILLION)
    TABLE 66. CANADA BUSINESS INCOME INSURANCE MARKET, BY TYPE, 2021-2031 ($MILLION)
    TABLE 67. CANADA BUSINESS INCOME INSURANCE MARKET, BY COVERAGE, 2021-2031 ($MILLION)
    TABLE 68. CANADA BUSINESS INCOME INSURANCE MARKET, BY LOSS TYPE, 2021-2031 ($MILLION)
    TABLE 69. CANADA BUSINESS INCOME INSURANCE MARKET, BY DISTRIBUTION CHANNEL, 2021-2031 ($MILLION)
    TABLE 70. CANADA BUSINESS INCOME INSURANCE MARKET, BY INDUSTRY VERTICAL, 2021-2031 ($MILLION)
    TABLE 71. EUROPE BUSINESS INCOME INSURANCE MARKET, BY TYPE, 2021-2031 ($MILLION)
    TABLE 72. EUROPE BUSINESS INCOME INSURANCE MARKET, BY COVERAGE, 2021-2031 ($MILLION)
    TABLE 73. EUROPE BUSINESS INCOME INSURANCE MARKET, BY LOSS TYPE, 2021-2031 ($MILLION)
    TABLE 74. EUROPE BUSINESS INCOME INSURANCE MARKET, BY DISTRIBUTION CHANNEL, 2021-2031 ($MILLION)
    TABLE 75. EUROPE BUSINESS INCOME INSURANCE MARKET, BY INDUSTRY VERTICAL, 2021-2031 ($MILLION)
    TABLE 76. EUROPE BUSINESS INCOME INSURANCE MARKET, BY COUNTRY, 2021-2031 ($MILLION)
    TABLE 77. UNITED KINGDOM BUSINESS INCOME INSURANCE MARKET, BY TYPE, 2021-2031 ($MILLION)
    TABLE 78. UNITED KINGDOM BUSINESS INCOME INSURANCE MARKET, BY COVERAGE, 2021-2031 ($MILLION)
    TABLE 79. UNITED KINGDOM BUSINESS INCOME INSURANCE MARKET, BY LOSS TYPE, 2021-2031 ($MILLION)
    TABLE 80. UNITED KINGDOM BUSINESS INCOME INSURANCE MARKET, BY DISTRIBUTION CHANNEL, 2021-2031 ($MILLION)
    TABLE 81. UNITED KINGDOM BUSINESS INCOME INSURANCE MARKET, BY INDUSTRY VERTICAL, 2021-2031 ($MILLION)
    TABLE 82. GERMANY BUSINESS INCOME INSURANCE MARKET, BY TYPE, 2021-2031 ($MILLION)
    TABLE 83. GERMANY BUSINESS INCOME INSURANCE MARKET, BY COVERAGE, 2021-2031 ($MILLION)
    TABLE 84. GERMANY BUSINESS INCOME INSURANCE MARKET, BY LOSS TYPE, 2021-2031 ($MILLION)
    TABLE 85. GERMANY BUSINESS INCOME INSURANCE MARKET, BY DISTRIBUTION CHANNEL, 2021-2031 ($MILLION)
    TABLE 86. GERMANY BUSINESS INCOME INSURANCE MARKET, BY INDUSTRY VERTICAL, 2021-2031 ($MILLION)
    TABLE 87. FRANCE BUSINESS INCOME INSURANCE MARKET, BY TYPE, 2021-2031 ($MILLION)
    TABLE 88. FRANCE BUSINESS INCOME INSURANCE MARKET, BY COVERAGE, 2021-2031 ($MILLION)
    TABLE 89. FRANCE BUSINESS INCOME INSURANCE MARKET, BY LOSS TYPE, 2021-2031 ($MILLION)
    TABLE 90. FRANCE BUSINESS INCOME INSURANCE MARKET, BY DISTRIBUTION CHANNEL, 2021-2031 ($MILLION)
    TABLE 91. FRANCE BUSINESS INCOME INSURANCE MARKET, BY INDUSTRY VERTICAL, 2021-2031 ($MILLION)
    TABLE 92. ITALY BUSINESS INCOME INSURANCE MARKET, BY TYPE, 2021-2031 ($MILLION)
    TABLE 93. ITALY BUSINESS INCOME INSURANCE MARKET, BY COVERAGE, 2021-2031 ($MILLION)
    TABLE 94. ITALY BUSINESS INCOME INSURANCE MARKET, BY LOSS TYPE, 2021-2031 ($MILLION)
    TABLE 95. ITALY BUSINESS INCOME INSURANCE MARKET, BY DISTRIBUTION CHANNEL, 2021-2031 ($MILLION)
    TABLE 96. ITALY BUSINESS INCOME INSURANCE MARKET, BY INDUSTRY VERTICAL, 2021-2031 ($MILLION)
    TABLE 97. SPAIN BUSINESS INCOME INSURANCE MARKET, BY TYPE, 2021-2031 ($MILLION)
    TABLE 98. SPAIN BUSINESS INCOME INSURANCE MARKET, BY COVERAGE, 2021-2031 ($MILLION)
    TABLE 99. SPAIN BUSINESS INCOME INSURANCE MARKET, BY LOSS TYPE, 2021-2031 ($MILLION)
    TABLE 100. SPAIN BUSINESS INCOME INSURANCE MARKET, BY DISTRIBUTION CHANNEL, 2021-2031 ($MILLION)
    TABLE 101. SPAIN BUSINESS INCOME INSURANCE MARKET, BY INDUSTRY VERTICAL, 2021-2031 ($MILLION)
    TABLE 102. NETHERLANDS BUSINESS INCOME INSURANCE MARKET, BY TYPE, 2021-2031 ($MILLION)
    TABLE 103. NETHERLANDS BUSINESS INCOME INSURANCE MARKET, BY COVERAGE, 2021-2031 ($MILLION)
    TABLE 104. NETHERLANDS BUSINESS INCOME INSURANCE MARKET, BY LOSS TYPE, 2021-2031 ($MILLION)
    TABLE 105. NETHERLANDS BUSINESS INCOME INSURANCE MARKET, BY DISTRIBUTION CHANNEL, 2021-2031 ($MILLION)
    TABLE 106. NETHERLANDS BUSINESS INCOME INSURANCE MARKET, BY INDUSTRY VERTICAL, 2021-2031 ($MILLION)
    TABLE 107. REST OF EUROPE BUSINESS INCOME INSURANCE MARKET, BY TYPE, 2021-2031 ($MILLION)
    TABLE 108. REST OF EUROPE BUSINESS INCOME INSURANCE MARKET, BY COVERAGE, 2021-2031 ($MILLION)
    TABLE 109. REST OF EUROPE BUSINESS INCOME INSURANCE MARKET, BY LOSS TYPE, 2021-2031 ($MILLION)
    TABLE 110. REST OF EUROPE BUSINESS INCOME INSURANCE MARKET, BY DISTRIBUTION CHANNEL, 2021-2031 ($MILLION)
    TABLE 111. REST OF EUROPE BUSINESS INCOME INSURANCE MARKET, BY INDUSTRY VERTICAL, 2021-2031 ($MILLION)
    TABLE 112. ASIA-PACIFIC BUSINESS INCOME INSURANCE MARKET, BY TYPE, 2021-2031 ($MILLION)
    TABLE 113. ASIA-PACIFIC BUSINESS INCOME INSURANCE MARKET, BY COVERAGE, 2021-2031 ($MILLION)
    TABLE 114. ASIA-PACIFIC BUSINESS INCOME INSURANCE MARKET, BY LOSS TYPE, 2021-2031 ($MILLION)
    TABLE 115. ASIA-PACIFIC BUSINESS INCOME INSURANCE MARKET, BY DISTRIBUTION CHANNEL, 2021-2031 ($MILLION)
    TABLE 116. ASIA-PACIFIC BUSINESS INCOME INSURANCE MARKET, BY INDUSTRY VERTICAL, 2021-2031 ($MILLION)
    TABLE 117. ASIA-PACIFIC BUSINESS INCOME INSURANCE MARKET, BY COUNTRY, 2021-2031 ($MILLION)
    TABLE 118. CHINA BUSINESS INCOME INSURANCE MARKET, BY TYPE, 2021-2031 ($MILLION)
    TABLE 119. CHINA BUSINESS INCOME INSURANCE MARKET, BY COVERAGE, 2021-2031 ($MILLION)
    TABLE 120. CHINA BUSINESS INCOME INSURANCE MARKET, BY LOSS TYPE, 2021-2031 ($MILLION)
    TABLE 121. CHINA BUSINESS INCOME INSURANCE MARKET, BY DISTRIBUTION CHANNEL, 2021-2031 ($MILLION)
    TABLE 122. CHINA BUSINESS INCOME INSURANCE MARKET, BY INDUSTRY VERTICAL, 2021-2031 ($MILLION)
    TABLE 123. JAPAN BUSINESS INCOME INSURANCE MARKET, BY TYPE, 2021-2031 ($MILLION)
    TABLE 124. JAPAN BUSINESS INCOME INSURANCE MARKET, BY COVERAGE, 2021-2031 ($MILLION)
    TABLE 125. JAPAN BUSINESS INCOME INSURANCE MARKET, BY LOSS TYPE, 2021-2031 ($MILLION)
    TABLE 126. JAPAN BUSINESS INCOME INSURANCE MARKET, BY DISTRIBUTION CHANNEL, 2021-2031 ($MILLION)
    TABLE 127. JAPAN BUSINESS INCOME INSURANCE MARKET, BY INDUSTRY VERTICAL, 2021-2031 ($MILLION)
    TABLE 128. INDIA BUSINESS INCOME INSURANCE MARKET, BY TYPE, 2021-2031 ($MILLION)
    TABLE 129. INDIA BUSINESS INCOME INSURANCE MARKET, BY COVERAGE, 2021-2031 ($MILLION)
    TABLE 130. INDIA BUSINESS INCOME INSURANCE MARKET, BY LOSS TYPE, 2021-2031 ($MILLION)
    TABLE 131. INDIA BUSINESS INCOME INSURANCE MARKET, BY DISTRIBUTION CHANNEL, 2021-2031 ($MILLION)
    TABLE 132. INDIA BUSINESS INCOME INSURANCE MARKET, BY INDUSTRY VERTICAL, 2021-2031 ($MILLION)
    TABLE 133. AUSTRALIA BUSINESS INCOME INSURANCE MARKET, BY TYPE, 2021-2031 ($MILLION)
    TABLE 134. AUSTRALIA BUSINESS INCOME INSURANCE MARKET, BY COVERAGE, 2021-2031 ($MILLION)
    TABLE 135. AUSTRALIA BUSINESS INCOME INSURANCE MARKET, BY LOSS TYPE, 2021-2031 ($MILLION)
    TABLE 136. AUSTRALIA BUSINESS INCOME INSURANCE MARKET, BY DISTRIBUTION CHANNEL, 2021-2031 ($MILLION)
    TABLE 137. AUSTRALIA BUSINESS INCOME INSURANCE MARKET, BY INDUSTRY VERTICAL, 2021-2031 ($MILLION)
    TABLE 138. SOUTH KOREA BUSINESS INCOME INSURANCE MARKET, BY TYPE, 2021-2031 ($MILLION)
    TABLE 139. SOUTH KOREA BUSINESS INCOME INSURANCE MARKET, BY COVERAGE, 2021-2031 ($MILLION)
    TABLE 140. SOUTH KOREA BUSINESS INCOME INSURANCE MARKET, BY LOSS TYPE, 2021-2031 ($MILLION)
    TABLE 141. SOUTH KOREA BUSINESS INCOME INSURANCE MARKET, BY DISTRIBUTION CHANNEL, 2021-2031 ($MILLION)
    TABLE 142. SOUTH KOREA BUSINESS INCOME INSURANCE MARKET, BY INDUSTRY VERTICAL, 2021-2031 ($MILLION)
    TABLE 143. SINGAPORE BUSINESS INCOME INSURANCE MARKET, BY TYPE, 2021-2031 ($MILLION)
    TABLE 144. SINGAPORE BUSINESS INCOME INSURANCE MARKET, BY COVERAGE, 2021-2031 ($MILLION)
    TABLE 145. SINGAPORE BUSINESS INCOME INSURANCE MARKET, BY LOSS TYPE, 2021-2031 ($MILLION)
    TABLE 146. SINGAPORE BUSINESS INCOME INSURANCE MARKET, BY DISTRIBUTION CHANNEL, 2021-2031 ($MILLION)
    TABLE 147. SINGAPORE BUSINESS INCOME INSURANCE MARKET, BY INDUSTRY VERTICAL, 2021-2031 ($MILLION)
    TABLE 148. REST OF ASIA-PACIFIC BUSINESS INCOME INSURANCE MARKET, BY TYPE, 2021-2031 ($MILLION)
    TABLE 149. REST OF ASIA-PACIFIC BUSINESS INCOME INSURANCE MARKET, BY COVERAGE, 2021-2031 ($MILLION)
    TABLE 150. REST OF ASIA-PACIFIC BUSINESS INCOME INSURANCE MARKET, BY LOSS TYPE, 2021-2031 ($MILLION)
    TABLE 151. REST OF ASIA-PACIFIC BUSINESS INCOME INSURANCE MARKET, BY DISTRIBUTION CHANNEL, 2021-2031 ($MILLION)
    TABLE 152. REST OF ASIA-PACIFIC BUSINESS INCOME INSURANCE MARKET, BY INDUSTRY VERTICAL, 2021-2031 ($MILLION)
    TABLE 153. LAMEA BUSINESS INCOME INSURANCE MARKET, BY TYPE, 2021-2031 ($MILLION)
    TABLE 154. LAMEA BUSINESS INCOME INSURANCE MARKET, BY COVERAGE, 2021-2031 ($MILLION)
    TABLE 155. LAMEA BUSINESS INCOME INSURANCE MARKET, BY LOSS TYPE, 2021-2031 ($MILLION)
    TABLE 156. LAMEA BUSINESS INCOME INSURANCE MARKET, BY DISTRIBUTION CHANNEL, 2021-2031 ($MILLION)
    TABLE 157. LAMEA BUSINESS INCOME INSURANCE MARKET, BY INDUSTRY VERTICAL, 2021-2031 ($MILLION)
    TABLE 158. LAMEA BUSINESS INCOME INSURANCE MARKET, BY COUNTRY, 2021-2031 ($MILLION)
    TABLE 159. LATIN AMERICA BUSINESS INCOME INSURANCE MARKET, BY TYPE, 2021-2031 ($MILLION)
    TABLE 160. LATIN AMERICA BUSINESS INCOME INSURANCE MARKET, BY COVERAGE, 2021-2031 ($MILLION)
    TABLE 161. LATIN AMERICA BUSINESS INCOME INSURANCE MARKET, BY LOSS TYPE, 2021-2031 ($MILLION)
    TABLE 162. LATIN AMERICA BUSINESS INCOME INSURANCE MARKET, BY DISTRIBUTION CHANNEL, 2021-2031 ($MILLION)
    TABLE 163. LATIN AMERICA BUSINESS INCOME INSURANCE MARKET, BY INDUSTRY VERTICAL, 2021-2031 ($MILLION)
    TABLE 164. MIDDLE EAST BUSINESS INCOME INSURANCE MARKET, BY TYPE, 2021-2031 ($MILLION)
    TABLE 165. MIDDLE EAST BUSINESS INCOME INSURANCE MARKET, BY COVERAGE, 2021-2031 ($MILLION)
    TABLE 166. MIDDLE EAST BUSINESS INCOME INSURANCE MARKET, BY LOSS TYPE, 2021-2031 ($MILLION)
    TABLE 167. MIDDLE EAST BUSINESS INCOME INSURANCE MARKET, BY DISTRIBUTION CHANNEL, 2021-2031 ($MILLION)
    TABLE 168. MIDDLE EAST BUSINESS INCOME INSURANCE MARKET, BY INDUSTRY VERTICAL, 2021-2031 ($MILLION)
    TABLE 169. SOUTH AFRICA BUSINESS INCOME INSURANCE MARKET, BY TYPE, 2021-2031 ($MILLION)
    TABLE 170. SOUTH AFRICA BUSINESS INCOME INSURANCE MARKET, BY COVERAGE, 2021-2031 ($MILLION)
    TABLE 171. SOUTH AFRICA BUSINESS INCOME INSURANCE MARKET, BY LOSS TYPE, 2021-2031 ($MILLION)
    TABLE 172. SOUTH AFRICA BUSINESS INCOME INSURANCE MARKET, BY DISTRIBUTION CHANNEL, 2021-2031 ($MILLION)
    TABLE 173. SOUTH AFRICA BUSINESS INCOME INSURANCE MARKET, BY INDUSTRY VERTICAL, 2021-2031 ($MILLION)
    TABLE 174.AMERICAN INTERNATIONAL GROUP, INC.: COMPANY SNAPSHOT
    TABLE 175.AMERICAN INTERNATIONAL GROUP, INC.: OPERATING SEGMENTS
    TABLE 176.AMERICAN INTERNATIONAL GROUP, INC.: PRODUCT PORTFOLIO
    TABLE 177.AMERICAN INTERNATIONAL GROUP, INC.: NET SALES,
    TABLE 178.AMERICAN INTERNATIONAL GROUP, INC.: KEY STRATERGIES
    TABLE 179.ALLIANZ: COMPANY SNAPSHOT
    TABLE 180.ALLIANZ: OPERATING SEGMENTS
    TABLE 181.ALLIANZ: PRODUCT PORTFOLIO
    TABLE 182.ALLIANZ: NET SALES,
    TABLE 183.ALLIANZ: KEY STRATERGIES
    TABLE 184.ALLSTATE INSURANCE COMPANY: COMPANY SNAPSHOT
    TABLE 185.ALLSTATE INSURANCE COMPANY: OPERATING SEGMENTS
    TABLE 186.ALLSTATE INSURANCE COMPANY: PRODUCT PORTFOLIO
    TABLE 187.ALLSTATE INSURANCE COMPANY: NET SALES,
    TABLE 188.ALLSTATE INSURANCE COMPANY: KEY STRATERGIES
    TABLE 189.AMTRUST FINANCIAL: COMPANY SNAPSHOT
    TABLE 190.AMTRUST FINANCIAL: OPERATING SEGMENTS
    TABLE 191.AMTRUST FINANCIAL: PRODUCT PORTFOLIO
    TABLE 192.AMTRUST FINANCIAL: NET SALES,
    TABLE 193.AMTRUST FINANCIAL: KEY STRATERGIES
    TABLE 194.ASSURANT, INC.: COMPANY SNAPSHOT
    TABLE 195.ASSURANT, INC.: OPERATING SEGMENTS
    TABLE 196.ASSURANT, INC.: PRODUCT PORTFOLIO
    TABLE 197.ASSURANT, INC.: NET SALES,
    TABLE 198.ASSURANT, INC.: KEY STRATERGIES
    TABLE 199.AXA: COMPANY SNAPSHOT
    TABLE 200.AXA: OPERATING SEGMENTS
    TABLE 201.AXA: PRODUCT PORTFOLIO
    TABLE 202.AXA: NET SALES,
    TABLE 203.AXA: KEY STRATERGIES
    TABLE 204.CHUBB: COMPANY SNAPSHOT
    TABLE 205.CHUBB: OPERATING SEGMENTS
    TABLE 206.CHUBB: PRODUCT PORTFOLIO
    TABLE 207.CHUBB: NET SALES,
    TABLE 208.CHUBB: KEY STRATERGIES
    TABLE 209.EMPLOYERS MUTUAL CASUALTY COMPANY: COMPANY SNAPSHOT
    TABLE 210.EMPLOYERS MUTUAL CASUALTY COMPANY: OPERATING SEGMENTS
    TABLE 211.EMPLOYERS MUTUAL CASUALTY COMPANY: PRODUCT PORTFOLIO
    TABLE 212.EMPLOYERS MUTUAL CASUALTY COMPANY: NET SALES,
    TABLE 213.EMPLOYERS MUTUAL CASUALTY COMPANY: KEY STRATERGIES
    TABLE 214.FARMERS: COMPANY SNAPSHOT
    TABLE 215.FARMERS: OPERATING SEGMENTS
    TABLE 216.FARMERS: PRODUCT PORTFOLIO
    TABLE 217.FARMERS: NET SALES,
    TABLE 218.FARMERS: KEY STRATERGIES
    TABLE 219.LIBERTY MUTUAL INSURANCE COMPANY: COMPANY SNAPSHOT
    TABLE 220.LIBERTY MUTUAL INSURANCE COMPANY: OPERATING SEGMENTS
    TABLE 221.LIBERTY MUTUAL INSURANCE COMPANY: PRODUCT PORTFOLIO
    TABLE 222.LIBERTY MUTUAL INSURANCE COMPANY: NET SALES,
    TABLE 223.LIBERTY MUTUAL INSURANCE COMPANY: KEY STRATERGIES
    TABLE 224.MUNICH RE: COMPANY SNAPSHOT
    TABLE 225.MUNICH RE: OPERATING SEGMENTS
    TABLE 226.MUNICH RE: PRODUCT PORTFOLIO
    TABLE 227.MUNICH RE: NET SALES,
    TABLE 228.MUNICH RE: KEY STRATERGIES
    TABLE 229.NATIONWIDE MUTUAL INSURANCE COMPANY: COMPANY SNAPSHOT
    TABLE 230.NATIONWIDE MUTUAL INSURANCE COMPANY: OPERATING SEGMENTS
    TABLE 231.NATIONWIDE MUTUAL INSURANCE COMPANY: PRODUCT PORTFOLIO
    TABLE 232.NATIONWIDE MUTUAL INSURANCE COMPANY: NET SALES,
    TABLE 233.NATIONWIDE MUTUAL INSURANCE COMPANY: KEY STRATERGIES
    TABLE 234.NEXT INSURANCE, INC.: COMPANY SNAPSHOT
    TABLE 235.NEXT INSURANCE, INC.: OPERATING SEGMENTS
    TABLE 236.NEXT INSURANCE, INC.: PRODUCT PORTFOLIO
    TABLE 237.NEXT INSURANCE, INC.: NET SALES,
    TABLE 238.NEXT INSURANCE, INC.: KEY STRATERGIES
    TABLE 239.STATE FARM MUTUAL AUTOMOBILE INSURANCE COMPANY: COMPANY SNAPSHOT
    TABLE 240.STATE FARM MUTUAL AUTOMOBILE INSURANCE COMPANY: OPERATING SEGMENTS
    TABLE 241.STATE FARM MUTUAL AUTOMOBILE INSURANCE COMPANY: PRODUCT PORTFOLIO
    TABLE 242.STATE FARM MUTUAL AUTOMOBILE INSURANCE COMPANY: NET SALES,
    TABLE 243.STATE FARM MUTUAL AUTOMOBILE INSURANCE COMPANY: KEY STRATERGIES
    TABLE 244.SWISS RE: COMPANY SNAPSHOT
    TABLE 245.SWISS RE: OPERATING SEGMENTS
    TABLE 246.SWISS RE: PRODUCT PORTFOLIO
    TABLE 247.SWISS RE: NET SALES,
    TABLE 248.SWISS RE: KEY STRATERGIES
    TABLE 249.THE HARTFORD: COMPANY SNAPSHOT
    TABLE 250.THE HARTFORD: OPERATING SEGMENTS
    TABLE 251.THE HARTFORD: PRODUCT PORTFOLIO
    TABLE 252.THE HARTFORD: NET SALES,
    TABLE 253.THE HARTFORD: KEY STRATERGIES
    TABLE 254.THE TRAVELERS INDEMNITY COMPANY: COMPANY SNAPSHOT
    TABLE 255.THE TRAVELERS INDEMNITY COMPANY: OPERATING SEGMENTS
    TABLE 256.THE TRAVELERS INDEMNITY COMPANY: PRODUCT PORTFOLIO
    TABLE 257.THE TRAVELERS INDEMNITY COMPANY: NET SALES,
    TABLE 258.THE TRAVELERS INDEMNITY COMPANY: KEY STRATERGIES
    TABLE 259.ZURICH: COMPANY SNAPSHOT
    TABLE 260.ZURICH: OPERATING SEGMENTS
    TABLE 261.ZURICH: PRODUCT PORTFOLIO
    TABLE 262.ZURICH: NET SALES,
    TABLE 263.ZURICH: KEY STRATERGIES
  • LIST OF FIGURES

  • FIGURE 1.BUSINESS INCOME INSURANCE MARKET SEGMENTATION
    FIGURE 2.BUSINESS INCOME INSURANCE MARKET,2021-2031
    FIGURE 3.BUSINESS INCOME INSURANCE MARKET,2021-2031
    FIGURE 4. TOP INVESTMENT POCKETS, BY REGION
    FIGURE 5.PORTER FIVE-1
    FIGURE 6.PORTER FIVE-2
    FIGURE 7.PORTER FIVE-3
    FIGURE 8.PORTER FIVE-4
    FIGURE 9.PORTER FIVE-5
    FIGURE 10.TOP PLAYER POSITIONING
    FIGURE 11.BUSINESS INCOME INSURANCE MARKET:DRIVERS, RESTRAINTS AND OPPORTUNITIES
    FIGURE 12.BUSINESS INCOME INSURANCE MARKET,BY TYPE,2021(%)
    FIGURE 13.COMPARATIVE SHARE ANALYSIS OF STANDARD BUSINESS INCOME INSURANCE BUSINESS INCOME INSURANCE MARKET,2021-2031(%)
    FIGURE 14.COMPARATIVE SHARE ANALYSIS OF EXTENDED BUSINESS INCOME INSURANCE BUSINESS INCOME INSURANCE MARKET,2021-2031(%)
    FIGURE 15.BUSINESS INCOME INSURANCE MARKET,BY COVERAGE,2021(%)
    FIGURE 16.COMPARATIVE SHARE ANALYSIS OF PROFITS/LOST REVENUE BUSINESS INCOME INSURANCE MARKET,2021-2031(%)
    FIGURE 17.COMPARATIVE SHARE ANALYSIS OF TAXES AND LOAN PAYMENTS BUSINESS INCOME INSURANCE MARKET,2021-2031(%)
    FIGURE 18.COMPARATIVE SHARE ANALYSIS OF MORTGAGE AND RENT PAYMENTS BUSINESS INCOME INSURANCE MARKET,2021-2031(%)
    FIGURE 19.COMPARATIVE SHARE ANALYSIS OF EMPLOYEE’S WAGES AND PAYROLL BUSINESS INCOME INSURANCE MARKET,2021-2031(%)
    FIGURE 20.COMPARATIVE SHARE ANALYSIS OF RELOCATION COSTS BUSINESS INCOME INSURANCE MARKET,2021-2031(%)
    FIGURE 21.COMPARATIVE SHARE ANALYSIS OF OTHERS BUSINESS INCOME INSURANCE MARKET,2021-2031(%)
    FIGURE 22.BUSINESS INCOME INSURANCE MARKET,BY LOSS TYPE,2021(%)
    FIGURE 23.COMPARATIVE SHARE ANALYSIS OF FIRE BUSINESS INCOME INSURANCE MARKET,2021-2031(%)
    FIGURE 24.COMPARATIVE SHARE ANALYSIS OF THEFT BUSINESS INCOME INSURANCE MARKET,2021-2031(%)
    FIGURE 25.COMPARATIVE SHARE ANALYSIS OF WIND BUSINESS INCOME INSURANCE MARKET,2021-2031(%)
    FIGURE 26.COMPARATIVE SHARE ANALYSIS OF LIGHTNING BUSINESS INCOME INSURANCE MARKET,2021-2031(%)
    FIGURE 27.COMPARATIVE SHARE ANALYSIS OF OTHERS BUSINESS INCOME INSURANCE MARKET,2021-2031(%)
    FIGURE 28.BUSINESS INCOME INSURANCE MARKET,BY DISTRIBUTION CHANNEL,2021(%)
    FIGURE 29.COMPARATIVE SHARE ANALYSIS OF AGENTS & BROKERS BUSINESS INCOME INSURANCE MARKET,2021-2031(%)
    FIGURE 30.COMPARATIVE SHARE ANALYSIS OF DIRECT RESPONSE BUSINESS INCOME INSURANCE MARKET,2021-2031(%)
    FIGURE 31.COMPARATIVE SHARE ANALYSIS OF OTHERS   BUSINESS INCOME INSURANCE MARKET,2021-2031(%)
    FIGURE 32.BUSINESS INCOME INSURANCE MARKET,BY INDUSTRY VERTICAL,2021(%)
    FIGURE 33.COMPARATIVE SHARE ANALYSIS OF MANUFACTURING BUSINESS INCOME INSURANCE MARKET,2021-2031(%)
    FIGURE 34.COMPARATIVE SHARE ANALYSIS OF RETAIL BUSINESS INCOME INSURANCE MARKET,2021-2031(%)
    FIGURE 35.COMPARATIVE SHARE ANALYSIS OF CONSTRUCTION BUSINESS INCOME INSURANCE MARKET,2021-2031(%)
    FIGURE 36.COMPARATIVE SHARE ANALYSIS OF IT & TELECOM BUSINESS INCOME INSURANCE MARKET,2021-2031(%)
    FIGURE 37.COMPARATIVE SHARE ANALYSIS OF HEALTHCARE BUSINESS INCOME INSURANCE MARKET,2021-2031(%)
    FIGURE 38.COMPARATIVE SHARE ANALYSIS OF ENERGY & UTILITIES BUSINESS INCOME INSURANCE MARKET,2021-2031(%)
    FIGURE 39.COMPARATIVE SHARE ANALYSIS OF TRANSPORTATION & LOGISTICS BUSINESS INCOME INSURANCE MARKET,2021-2031(%)
    FIGURE 40.COMPARATIVE SHARE ANALYSIS OF OTHERS BUSINESS INCOME INSURANCE MARKET,2021-2031(%)
    FIGURE 41.BUSINESS INCOME INSURANCE MARKET BY REGION,2021
    FIGURE 42.U.S. BUSINESS INCOME INSURANCE MARKET,2021-2031($MILLION)
    FIGURE 43.CANADA BUSINESS INCOME INSURANCE MARKET,2021-2031($MILLION)
    FIGURE 44.UNITED KINGDOM BUSINESS INCOME INSURANCE MARKET,2021-2031($MILLION)
    FIGURE 45.GERMANY BUSINESS INCOME INSURANCE MARKET,2021-2031($MILLION)
    FIGURE 46.FRANCE BUSINESS INCOME INSURANCE MARKET,2021-2031($MILLION)
    FIGURE 47.ITALY BUSINESS INCOME INSURANCE MARKET,2021-2031($MILLION)
    FIGURE 48.SPAIN BUSINESS INCOME INSURANCE MARKET,2021-2031($MILLION)
    FIGURE 49.NETHERLANDS BUSINESS INCOME INSURANCE MARKET,2021-2031($MILLION)
    FIGURE 50.REST OF EUROPE BUSINESS INCOME INSURANCE MARKET,2021-2031($MILLION)
    FIGURE 51.CHINA BUSINESS INCOME INSURANCE MARKET,2021-2031($MILLION)
    FIGURE 52.JAPAN BUSINESS INCOME INSURANCE MARKET,2021-2031($MILLION)
    FIGURE 53.INDIA BUSINESS INCOME INSURANCE MARKET,2021-2031($MILLION)
    FIGURE 54.AUSTRALIA BUSINESS INCOME INSURANCE MARKET,2021-2031($MILLION)
    FIGURE 55.SOUTH KOREA BUSINESS INCOME INSURANCE MARKET,2021-2031($MILLION)
    FIGURE 56.SINGAPORE BUSINESS INCOME INSURANCE MARKET,2021-2031($MILLION)
    FIGURE 57.REST OF ASIA-PACIFIC BUSINESS INCOME INSURANCE MARKET,2021-2031($MILLION)
    FIGURE 58.LATIN AMERICA BUSINESS INCOME INSURANCE MARKET,2021-2031($MILLION)
    FIGURE 59.MIDDLE EAST BUSINESS INCOME INSURANCE MARKET,2021-2031($MILLION)
    FIGURE 60.SOUTH AFRICA BUSINESS INCOME INSURANCE MARKET,2021-2031($MILLION)
    FIGURE 61. TOP WINNING STRATEGIES, BY YEAR
    FIGURE 62. TOP WINNING STRATEGIES, BY DEVELOPMENT
    FIGURE 63. TOP WINNING STRATEGIES, BY COMPANY
    FIGURE 64.PRODUCT MAPPING OF TOP 10 PLAYERS
    FIGURE 65.COMPETITIVE DASHBOARD
    FIGURE 66.COMPETITIVE HEATMAP OF TOP 10 KEY PLAYERS
    FIGURE 67.AMERICAN INTERNATIONAL GROUP, INC..: NET SALES ,($MILLION)
    FIGURE 68.ALLIANZ.: NET SALES ,($MILLION)
    FIGURE 69.ALLSTATE INSURANCE COMPANY.: NET SALES ,($MILLION)
    FIGURE 70.AMTRUST FINANCIAL.: NET SALES ,($MILLION)
    FIGURE 71.ASSURANT, INC..: NET SALES ,($MILLION)
    FIGURE 72.AXA.: NET SALES ,($MILLION)
    FIGURE 73.CHUBB.: NET SALES ,($MILLION)
    FIGURE 74.EMPLOYERS MUTUAL CASUALTY COMPANY.: NET SALES ,($MILLION)
    FIGURE 75.FARMERS.: NET SALES ,($MILLION)
    FIGURE 76.LIBERTY MUTUAL INSURANCE COMPANY.: NET SALES ,($MILLION)
    FIGURE 77.MUNICH RE.: NET SALES ,($MILLION)
    FIGURE 78.NATIONWIDE MUTUAL INSURANCE COMPANY.: NET SALES ,($MILLION)
    FIGURE 79.NEXT INSURANCE, INC..: NET SALES ,($MILLION)
    FIGURE 80.STATE FARM MUTUAL AUTOMOBILE INSURANCE COMPANY.: NET SALES ,($MILLION)
    FIGURE 81.SWISS RE.: NET SALES ,($MILLION)
    FIGURE 82.THE HARTFORD.: NET SALES ,($MILLION)
    FIGURE 83.THE TRAVELERS INDEMNITY COMPANY.: NET SALES ,($MILLION)
    FIGURE 84.ZURICH.: NET SALES ,($MILLION)


Predictive analysis, artificial intelligence, and other advance technologies are being quickly adopted by the business income insurance industry to assure improved claim management and adequate risk mitigation. In addition, commercial insurance carriers now have a greater understanding and ability to forecast behavior of business owners, owing to the use of artificial intelligence and predictive analysis. This has caused significant patterns to emerge in the industry.

The market expansion for business income insurance, however, has been significantly hampered by the propagation of COVID-19 virus. This has led to increase in geopolitical risk, a shift in consumer preference for local insurers, and closure of several business verticals internationally. The COVID-19 outbreak had a significant impact on the business income insurance market as businesses among all verticals were disrupted across the globe. However, during this global health crisis, there was an increase in demand for business income insurance, owing to rise in awareness among businesses. This, as a result promoted demand for business income insurance, thereby leading to rise in opportunities to grow in upcoming years.

The business income insurance market is fragmented with the presence of regional vendors such as American International Group, Inc., Allianz, Allstate Insurance Company, AmTrust Financial, ASSURANT, INC., AXA, Chubb, Employers Mutual Casualty Company, Farmers, Liberty Mutual Insurance Company, Munich RE, Nationwide Mutual Insurance Company, Next Insurance, Inc., State Farm Mutual Automobile Insurance Company, Swiss Re, The Hartford, The Travelers Indemnity Company, and Zurich. Major players operating in this market have witnessed significant adoption of strategies that include business expansion and partnership to reduce supply and demand gap. With increase in awareness & demand for business income insurance across the globe, major players are collaborating their product portfolio to provide differentiated and innovative products.

PURCHASE OPTIONS

Call or Email us

U.S.-Canada Toll-free: +1-800-792-5285
Int'l : +1-503-894-6022
Europe : +44-845-528-1300
Email : help@alliedmarketresearch.com
 
FREQUENTLY ASKED QUESTIONS?

A. The Business Income Insurance Market is estimated to grow at a CAGR of 8.8% from 2022 to 2031.

A. The Business Income Insurance Market is projected to reach $33.5 billion by 2031.

A. Rise in adoption of business income insurance to prevent uncertain disasters promotes growth of the business income insurance market. In addition, rise in awareness among businesses about business income insurance since the pandemic drives the market growth.

A. The key players operating in the Business income insurance market analysis include American International Group, Inc., Allianz, Allstate Insurance Company, AmTrust Financial, ASSURANT, INC., AXA, Chubb, Employers Mutual Casualty Company, Farmers, Liberty Mutual Insurance Company, Munich RE, Nationwide Mutual Insurance Company, Next Insurance, Inc., State Farm Mutual Automobile Insurance Company, Swiss Re, The Hartford, The Travelers Indemnity Company, and Zurich.

A. The key growth strategies of Business Income Insurance Market players include product portfolio expansion, mergers & acquisitions, agreements, geographical expansion, and collaborations.

Looking for Customization?

 Customization Request

Have a Question?

 Speak with Analyst

Any Confusion?

 Inquire Before Buying

Have a glance of the Report

  Request Sample
RELATED TAGS

Purchase Full Report of
Business Income Insurance Market

Start reading instantly.
This Report and over 66,905+ more Reports, Available with Avenue Library. T&C*.

  • Online Only
  • $3,456
  • Online cloud access only
  • Restricted print, copy, paste & download
  • Read only
  • Free industry update
    (Within 180 days)
  • Free report update in next update cycle
    (Jul 2023 - Jul 2024)
  • Data Pack
  • $3,840
  • Restricted to one authorized user
  • One print only
  • Available in
    Excel
  • Free industry update
    (Within 180 days)
  •   Free report update in next update cycle
    (Jul 2023 - Jul 2024)
  • Single User
  • $5,769
  • Restricted to one authorized user
  • One print only
  • Available in
    PDF
  • Free industry update
    (Within 180 days)
  •   Free report update in next update cycle
    (Jul 2023 - Jul 2024)
  • Five Users
  • $6,450
  • Limited to five authorized users
  • Print upto five copies
  • Available in
    PDF
  • Free industry update
    (Within 180 days)
  •   Free report update in next update cycle
    (Jul 2023 - Jul 2024)
  • Enterprise
    License/PDF

  • $10,995
  • Unlimited
    within
    company/enterprise
  • Available in Excel & PDF
  • Free industry update
    (Within 180 days)
  •   Free report update in next update cycle
    (Jul 2023 - Jul 2024)
  • Library
    Membership

  • $999 $ 1,175
    Per User/ Per month/ Billed annually
  • Published Content
    E-access
  • Company Profiles
    E-access
  • Newly Added Content Access
  • 10 PDF
    Downloads
  • 5 Excel Data
    Pack Downloads
  • 250 Company Profiles PDF Downloads
  • Buy Now

*Taxes/Fees, if applicable will be added during checkout. All prices in USD

RELATED REPORTS
 

Why Allied Market Research?


Infallible Methodology

To ensure high-level data integrity, accurate analysis, and impeccable forecasts

Analyst Support

For complete satisfaction

Customization

On-demand customization of scope of the report to exactly meet your needs

TARGETED MARKET VIEW

Targeted market view to provide pertinent information and save time of readers

Get fresh content delivered

Get insights on topics that are crucial for your business. Stay abreast of your interest areas.

Get Industry Data Alerts

Why Allied Market Research?

Infallible Methodology

To ensure high-level data integrity, accurate analysis, and impeccable forecasts

Analyst Support

For complete satisfaction

Customization

On-demand customization of scope of the report to exactly meet your needs

TARGETED MARKET VIEW

Targeted market view to provide pertinent information and save time of readers