Report Code: A04917 | May 2019 | Pages: 270 | ||
Tables: 127 | Charts: 98 |
|
Pandemic disrupted the entire world and affected many industries.
Get detailed COVID-19 impact analysis on the Butterfly Valves Market
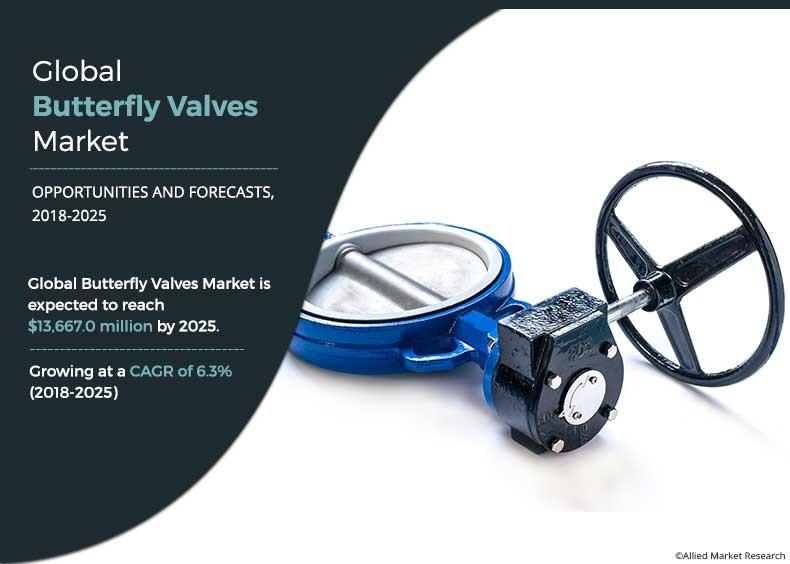
Request Now !The global butterfly valves market size is expected to reach $13,667.0 million by 2025 from $8,282.61 million in 2017, growing at a CAGR of 6.3% from 2018 to 2025. Butterfly valve is a shut-off valve used to isolate and control the flow of fluid and gases in various industrial applications. It is also known as quarter turn valve. The simple structure of butterfly valve includes a disk placed in middle of a pipe and swivels sideways or on uprights which starts and stops the fluid flow. Butterfly valve can be operated as a quarter turn valve and rotary motion valve. In quarter turn, the valve can be in fully open to fully closed position, which enables it for quick opening and closure.
The butterfly valves market growth is majorly driven by increase in demand from oil & gas industry, as oil & gas industry is experiences an increase in requirement of stainless steel butterfly valves. Moreover, there is an increase in the demand for butterfly valves in the developing regions—parts of Asia, the Africa/Middle East region, Central & Latin America, and Eastern Europe, owing to rapid industrialization, and this is anticipated to outpace demand for butterfly valves in some developed nations. Furthermore, butterfly valves find their application from the extraction of crude oil & gas till it reaches the end customers through refinery and oil terminals and depots, wherein increase in investment in the oil & gas industry in emerging economies is expected to provide lucrative opportunities to the valve manufacturers in these regions. Nonetheless, butterfly valves increase the operational efficiencies of the industrial production process and also enhance safety measures in process industries. Thus, growth in automation for industrial process is also expected to boost the growth of the butterfly valves industry. However, increase in competition from domestic butterfly valve manufacturers and high possibility of cavitation & chock in valve system is expected to hinder the growth of the butterfly valves market.
The global butterfly valves market analysis comprises of various segments including type, mechanism, function, end users, and region. Based on type, the market is divided into high performance butterfly valves and lined butterfly valves. The mechanism segment is further classified into centric butterfly valves and eccentric butterfly valves, wherein centric butterfly valves comprise of zero offset valves and eccentric includes double offset and triple offset valves. The triple offset valves segment is expected to secure the leading position during the forecast period.Â
By function, the butterfly valves market is categorized into on/off valves and control valves, where information related to revenue generated from new installations and replacements is also provided for both types. In 2017, the on/off valves segment is expected to secure the highest market share. The end user segment is bifurcated into oil & gas, electric power, water & wastewater, chemical, and other industries. The global butterfly valves market share is dominated by oil & gas segment, owing to increase in demand for butterfly valves in oil & gas downstream applications.
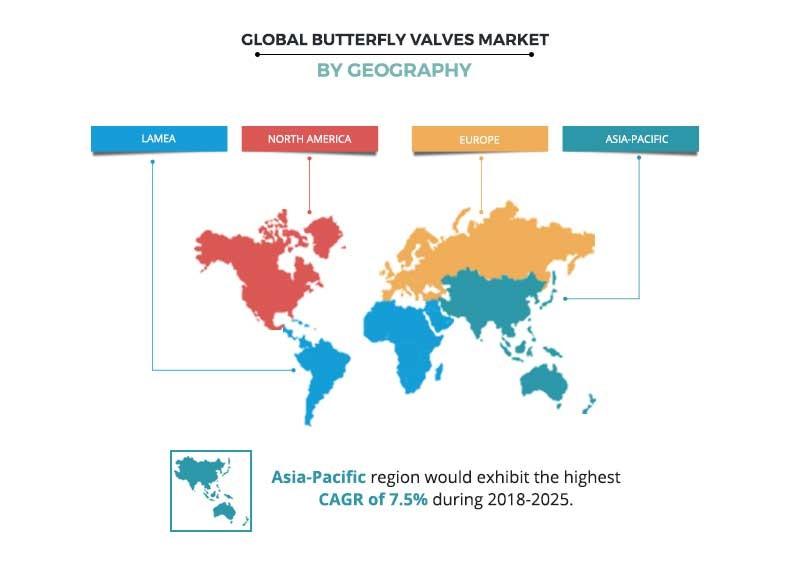
Based on region, the global butterfly valves market is analyzed across North America (U.S., Canada, and Mexico), Europe (UK, Germany, Russia, France, and others), Asia-Pacific (China, India, Japan, Korea, and others), and LAMEA (Latin America, Middle East, and Africa). Various countries covered under each region are studied and analyzed to identify the butterfly valves market trends demonstrated by these respective regions. Asia-Pacific dominated the butterfly valves market in 2017, followed by Europe.
Top Impacting Factors
The top impacting factors for global butterfly valves market are increase in demand from oil & gas industry, growth in a number of industrial infrastructure and surge in usage of power in industrial processes, gradual increase in demand for automation in industrial processes, and rise in investment in oil & gas industry. However, increase in competition from domestic manufacturers, high threat of cavitation & choke, and limited throttling is expected to hinder the growth of the butterfly valve industry. Some of the major factors impacting the growth of the global butterfly valve market are given below:
 
Increase in demand from the oil & gas industry:
Oil & gas industry is currently creating the highest demand for stainless steel butterfly valves. Electric stainless-steel butterfly valves are more efficient and enable greater level of controls as compared to the other type of valves. In addition, increase in use of shale gas as an energy source is anticipated to lead to rise in demand for butterfly valves.
Rise in number of industrial infrastructure and surge in usage of power in industrial processes
China is expanding its industrial infrastructure rapidly to meet growth in demand from increase in consumption. Large chemical & petrochemical plants, grass-root oil & gas refineries, and new power plants fuel the market growth in China. Furthermore, the capital spending for power generation has grown significantly in the developing countries, especially in China and India. These factors are expected to boost the demand for butterfly valves.
Competition from domestic manufacturers
Global players such as Flowserve, Emerson, and others have established facilities for manufacturing, engineering, sourcing, and marketing of butterfly valves in India and other developing economies, with the rise in demand for butterfly valves.
Competition Analysis
Competitive analysis and profiles of the major butterfly valves market players, such as Emerson Electric Co., Flowserve Corporation, Cameron, Alfa-Laval Corporate AB, AVK Group, Crane Co., Weir Group, Curtiss-Wright Corporation, KSB Group, and Velan Inc. are provided in this report.Â
Butterfly Valves Market Report Highlights
Aspects | Details |
---|---|
By Type |
|
By Mechanism |
|
By Function |
|
By End-User |
|
By Region |
|
Key Market Players | Flowserve Corporation, Curtiss-Wright Corporation, Schlumberger Ltd. (Cameron Corporation), Alfa Laval Corporate AB, Velan inc., Emerson Electric Co., The Weir Group PLC, KSB SE & Co. KGaA, AVK Holding A/S, CRANE CO. |
Chapter 1:Â Â Â Introduction
1.1.   Report description
1.2.   Key benefits for stakeholders
1.3.   Key market segments
1.4.   Research methodology
1.4.1.   Primary research
1.4.2.   Secondary research
1.4.3.   Analyst tools and models
Chapter 2:Â Â Â Executive summary
2.1.   CXO perspective
Chapter 3:Â Â Â MARKET OVERVIEW
3.1.   Market definition and scope
3.2.   Parent/Peer analysis
3.3.   Porter’s five forces analysis
3.4.   Patent Analysis
3.4.1.   By Region (2012-2017)
3.4.2.   By Players
3.5.   Market dynamics
3.5.1.   Drivers
3.5.1.1.   Increasing demand from the oil & gas  industry
3.5.1.2.   Rising number of industrial infrastructure and surge in usage of power in industrial processes
3.5.1.3.   Gradual increase in the need for automation in the process industries
3.5.2.   Restraints
3.5.2.1.   Competition from domestic manufacturers
3.5.2.2.   High possibility of cavitation & choke and limited throttling in case of low pressure
3.5.3.   Opportunities
3.5.3.1.   Emerging economies are boosting their investment in Oil & Gas industry, a major market for butterfly valves
3.6.   Key findings
3.6.1.   Top impacting factors
3.6.2.   Top investment pockets
Chapter 4:Â Â Â Butterfly Valve Market, BY type
4.1.   Overview
4.2.   High-performance butterfly valve
4.2.1.   Key market trends, growth factors, and opportunities
4.2.2.   Market size and forecast, by region
4.2.3.   Market analysis, by country
4.3.   Lined butterfly valve
4.3.1.   Key market trends, growth factors, and opportunities
4.3.2.   Market size and forecast, by region
4.3.3.   Market analysis, by country
Chapter 5:Â Â Â Butterfly Valve Market, BY Mechanism
5.1.   Overview
5.2.   Centric butterfly valve (Zero-offset)
5.2.1.   Key market trends, growth factors, and opportunities
5.2.2.   Market size and forecast, by region
5.2.3.   Market analysis, by country
5.3.   Eccentric butterfly valve
5.3.1.   Key market trends, growth factors, and opportunities
5.3.2.   Market size and forecast, by region
5.3.3.   Market size and forecast, by type
5.3.4.   Market analysis, by country
Chapter 6:Â Â Â Butterfly Valve Market, BY Function
6.1.   Overview
6.2.   On/Off butterfly valve
6.2.1.   Key market trends, growth factors, and opportunities
6.2.2.   Market size and forecast, by region
6.2.3.   Market size and forecast, by sales channel
6.2.4.   Market analysis, by country
6.3.   Control butterfly valve
6.3.1.   Key market trends, growth factors, and opportunities
6.3.2.   Market size and forecast, by region
6.3.3.   Market size and forecast, by sales channel
6.3.4.   Market analysis, by country
Chapter 7:Â Â Â Butterfly Valve Market, BY End-User
7.1.   Overview
7.2.   Oil & Gas
7.2.1.   Key market trends, growth factors, and opportunities
7.2.2.   Market size and forecast, by region
7.2.3.   Market size and forecast, by activity
7.2.4.   Market analysis, by country
7.3.   Electric power
7.3.1.   Key market trends, growth factors, and opportunities
7.3.2.   Market size and forecast, by region
7.3.3.   Market analysis, by country
7.4.   Chemical
7.4.1.   Key market trends, growth factors, and opportunities
7.4.2.   Market size and forecast, by region
7.4.3.   Market analysis, by country
7.5.   Water & Waste Water
7.5.1.   Key market trends, growth factors, and opportunities
7.5.2.   Market size and forecast, by region
7.5.3.   Market analysis, by country
7.6.   Others
7.6.1.   Key market trends, growth factors, and opportunities
7.6.2.   Market size and forecast, by region
7.6.3.   Market analysis, by country
Chapter 8:Â Â Â Butterfly Valve Market, BY Region
8.1.   Overview
8.2.   North America
8.2.1.   Key market trends, growth factors, and opportunities
8.2.2.   Market size and forecast, by type
8.2.3.   Market size and forecast, by mechanism
8.2.4.   Market size and forecast, by function
8.2.5.   Market size and forecast, by end-user
8.2.6.   Market analysis by country
8.2.6.1.   U.S.
8.2.6.1.1.   Market size and forecast, by type
8.2.6.1.2.   Market size and forecast, by mechanism
8.2.6.1.3.   Market size and forecast, by function
8.2.6.1.4.   Market size and forecast, by end-user
8.2.6.2.   Canada
8.2.6.2.1.   Market size and forecast, by type
8.2.6.2.2.   Market size and forecast, by mechanism
8.2.6.2.3.   Market size and forecast, by function
8.2.6.2.4.   Market size and forecast, by end-user
8.2.6.3.   Mexico
8.2.6.3.1.   Market size and forecast, by type
8.2.6.3.2.   Market size and forecast, by mechanism
8.2.6.3.3.   Market size and forecast, by function
8.2.6.3.4.   Market size and forecast, by end-user
8.3.   Europe
8.3.1.   Key market trends, growth factors, and opportunities
8.3.2.   Market size and forecast, by type
8.3.3.   Market size and forecast, by mechanism
8.3.4.   Market size and forecast, by function
8.3.5.   Market size and forecast, by end-user
8.3.6.   Market analysis by country
8.3.6.1.   Germany
8.3.6.1.1.   Market size and forecast, by type
8.3.6.1.2.   Market size and forecast, by mechanism
8.3.6.1.3.   Market size and forecast, by function
8.3.6.1.4.   Market size and forecast, by end-user
8.3.6.2.   France
8.3.6.2.1.   Market size and forecast, by type
8.3.6.2.2.   Market size and forecast, by mechanism
8.3.6.2.3.   Market size and forecast, by function
8.3.6.2.4.   Market size and forecast, by end-user
8.3.6.3.   UK
8.3.6.3.1.   Market size and forecast, by type
8.3.6.3.2.   Market size and forecast, by mechanism
8.3.6.3.3.   Market size and forecast, by function
8.3.6.3.4.   Market size and forecast, by end-user
8.3.6.4.   Russia
8.3.6.4.1.   Market size and forecast, by type
8.3.6.4.2.   Market size and forecast, by mechanism
8.3.6.4.3.   Market size and forecast, by function
8.3.6.4.4.   Market size and forecast, by end-user
8.3.6.5.   Rest of Europe
8.3.6.5.1.   Market size and forecast, by type
8.3.6.5.2.   Market size and forecast, by mechanism
8.3.6.5.3.   Market size and forecast, by function
8.3.6.5.4.   Market size and forecast, by end-user
8.4.   Asia-Pacific
8.4.1.   Key market trends, growth factors, and opportunities
8.4.2.   Market size and forecast, by type
8.4.3.   Market size and forecast, by mechanism
8.4.4.   Market size and forecast, by function
8.4.5.   Market size and forecast, by end-user
8.4.6.   Market analysis by country
8.4.6.1.   Japan
8.4.6.1.1.   Market size and forecast, by type
8.4.6.1.2.   Market size and forecast, by mechanism
8.4.6.1.3.   Market size and forecast, by function
8.4.6.1.4.   Market size and forecast, by end-user
8.4.6.2.   China
8.4.6.2.1.   Market size and forecast, by type
8.4.6.2.2.   Market size and forecast, by mechanism
8.4.6.2.3.   Market size and forecast, by function
8.4.6.2.4.   Market size and forecast, by end-user
8.4.6.3.   India
8.4.6.3.1.   Market size and forecast, by type
8.4.6.3.2.   Market size and forecast, by mechanism
8.4.6.3.3.   Market size and forecast, by function
8.4.6.3.4.   Market size and forecast, by end-user
8.4.6.4.   South Korea
8.4.6.4.1.   Market size and forecast, by type
8.4.6.4.2.   Market size and forecast, by mechanism
8.4.6.4.3.   Market size and forecast, by function
8.4.6.4.4.   Market size and forecast, by end-user
8.4.6.5.   Rest of Asia-Pacific
8.4.6.5.1.   Market size and forecast, by type
8.4.6.5.2.   Market size and forecast, by mechanism
8.4.6.5.3.   Market size and forecast, by function
8.4.6.5.4.   Market size and forecast, by end-user
8.5.   LAMEA
8.5.1.   Key market trends, growth factors, and opportunities
8.5.2.   Market size and forecast, by type
8.5.3.   Market size and forecast, by mechanism
8.5.4.   Market size and forecast, by function
8.5.5.   Market size and forecast, by end-user
8.5.6.   Market analysis by country
8.5.6.1.   Latin America
8.5.6.1.1.   Market size and forecast, by type
8.5.6.1.2.   Market size and forecast, by mechanism
8.5.6.1.3.   Market size and forecast, by function
8.5.6.1.4.   Market size and forecast, by end-user
8.5.6.2.   Middle East
8.5.6.2.1.   Market size and forecast, by type
8.5.6.2.2.   Market size and forecast, by mechanism
8.5.6.2.3.   Market size and forecast, by function
8.5.6.2.4.   Market size and forecast, by end-user
8.5.6.3.   Africa
8.5.6.3.1.   Market size and forecast, by type
8.5.6.3.2.   Market size and forecast, by mechanism
8.5.6.3.3.   Market size and forecast, by function
8.5.6.3.4.   Market size and forecast, by end-user
Chapter 9:Â Â Â Company profiles
9.1.   Alfa Laval Corporate AB
9.1.1.   Company overview
9.1.2.   Key Executives
9.1.3.   Company snapshot
9.1.4.   Operating business segments
9.1.5.   Product portfolio
9.1.6.   R&D Expenditure
9.1.7.   Business performance
9.2.   Curtiss-Wright Corporation
9.2.1.   Company overview
9.2.2.   Key Executives
9.2.3.   Company snapshot
9.2.4.   Operating business segments
9.2.5.   Product portfolio
9.2.6.   R&D Expenditure
9.2.7.   Business performance
9.3.   Emerson Electric Co.
9.3.1.   Company overview
9.3.2.   Key Executives
9.3.3.   Company snapshot
9.3.4.   Operating business segments
9.3.5.   Product portfolio
9.3.6.   R&D Expenditure
9.3.7.   Business performance
9.3.8.   Key strategic moves and developments
9.4.   Flowserve Corporation
9.4.1.   Company overview
9.4.2.   Key Executives
9.4.3.   Company snapshot
9.4.4.   Operating business segments
9.4.5.   Product portfolio
9.4.6.   R&D Expenditure
9.4.7.   Business performance
9.4.8.   Key strategic moves and developments
9.5.   AVK Holding A/S
9.5.1.   Company overview
9.5.2.   Key Executives
9.5.3.   Company snapshot
9.5.4.   Operating business segments
9.5.5.   Product portfolio
9.5.6.   Business performance
9.5.7.   Key strategic moves and developments
9.6.   CRANE CO.
9.6.1.   Company overview
9.6.2.   Key Executives
9.6.3.   Company snapshot
9.6.4.   Operating business segments
9.6.5.   Product portfolio
9.6.6.   R&D Expenditure
9.6.7.   Business performance
9.7.   KSB SE & Co. KGaA
9.7.1.   Company overview
9.7.2.   Key Executives
9.7.3.   Company snapshot
9.7.4.   Operating business segments
9.7.5.   Product portfolio
9.7.6.   R&D Expenditure
9.7.7.   Business performance
9.7.8.   Key strategic moves and developments
9.8.   Schlumberger Ltd. (Cameron Corporation)
9.8.1.   Company overview
9.8.2.   Key Executives
9.8.3.   Company snapshot
9.8.4.   Operating business segments
9.8.5.   Product portfolio
9.8.6.   R&D Expenditure
9.8.7.   Business performance
9.9.   Velan inc.
9.9.1.   Company overview
9.9.2.   Key Executives
9.9.3.   Company snapshot
9.9.4.   Operating business segments
9.9.5.   Product portfolio
9.9.6.   R&D Expenditure
9.9.7.   Business performance
9.10.   The Weir Group PLC
9.10.1.   Company overview
9.10.2.   Key Executives
9.10.3.   Company snapshot
9.10.4.   Operating business segments
9.10.5.   Product portfolio
9.10.6.   R&D Expenditure
9.10.7.   Business performance
9.10.8.   Key strategic moves and developments
LIST OF TABLES
TABLE 01.   GLOBAL BUTTERFLY VALVE MARKET REVENUE, BY TYPE, 2017-2025($MILLION)
TABLE 02.   HIGH-PERFORMANCE BUTTERFLY VALVE MARKET REVENUE, BY REGION, 2017–2025 ($MILLION)
TABLE 03.   LINED BUTTERFLY VALVE MARKET REVENUE, BY REGION, 2017–2025 ($MILLION)
TABLE 04.   GLOBAL BUTTERFLY VALVE MARKET REVENUE, BY MECHANISM, 2017-2025($MILLION)
TABLE 05.   CENTRIC BUTTERFLY VALVE MARKET REVENUE, BY REGION, 2017–2025 ($MILLION)
TABLE 06.   ECCENTRIC BUTTERFLY VALVE MARKET REVENUE, BY REGION, 2017–2025 ($MILLION)
TABLE 07.   ECCENTRIC BUTTERFLY VALVE MARKET REVENUE, BY TYPE, 2017–2025 ($MILLION)
TABLE 08.   GLOBAL BUTTERFLY VALVE MARKET REVENUE, BY FUNCTION, 2017-2025($MILLION)
TABLE 09.   ON/OFF BUTTERFLY VALVE MARKET REVENUE, BY REGION, 2017–2025 ($MILLION)
TABLE 10.   ON/OFF BUTTERFLY VALVE MARKET REVENUE, BY SALES CHANNEL, 2017–2025 ($MILLION)
TABLE 11.   CONTROL BUTTERFLY VALVE MARKET REVENUE, BY REGION, 2017–2025 ($MILLION)
TABLE 12.   CONTROL BUTTERFLY VALVE MARKET REVENUE, BY SALES CHANNEL, 2017–2025 ($MILLION)
TABLE 13.   GLOBAL BUTTERFLY VALVE MARKET REVENUE, BY END-USER, 2017-2025($MILLION)
TABLE 14.   BUTTERFLY VALVE MARKET REVENUE FOR OIL & GAS INDUSTRY, BY REGION, 2017–2025 ($MILLION)
TABLE 15.   BUTTERFLY VALVE MARKET REVENUE FOR OIL & GAS INDUSTRY, BY ACTIVITY, 2017–2025 ($MILLION)
TABLE 16.   BUTTERFLY VALVE MARKET REVENUE FOR ELECTRIC POWER INDUSTRY, BY REGION, 2017–2025 ($MILLION)
TABLE 17.   BUTTERFLY VALVE MARKET REVENUE FOR CHEMICAL INDUSTRY, BY REGION, 2017–2025 ($MILLION)
TABLE 18.   BUTTERFLY VALVE MARKET REVENUE FOR WATER & WASTE WATER INDUSTRY, BY REGION, 2017–2025 ($MILLION)
TABLE 19.   BUTTERFLY VALVE MARKET REVENUE FOR OTHERS INDUSTRY, BY REGION, 2017–2025 ($MILLION)
TABLE 20.   NORTH AMERICA BUTTERFLY VALVE MARKET, BY TYPE, 2017–2025 ($MILLION)
TABLE 21.   NORTH AMERICA BUTTERFLY VALVE MARKET, BY MECHANISM, 2017–2025 ($MILLION)
TABLE 22.   NORTH AMERICA BUTTERFLY VALVE MARKET, BY FUNCTION, 2017–2025 ($MILLION)
TABLE 23.   NORTH AMERICA BUTTERFLY VALVE MARKET, BY END-USER, 2017–2025 ($MILLION)
TABLE 24.   U.S. BUTTERFLY VALVE MARKET, BY TYPE, 2017–2025 ($MILLION)
TABLE 25.   U.S. BUTTERFLY VALVE MARKET, BY MECHANISM, 2017–2025 ($MILLION)
TABLE 26.   U.S. BUTTERFLY VALVE MARKET, BY FUNCTION, 2017–2025 ($MILLION)
TABLE 27.   U.S. BUTTERFLY VALVE MARKET, BY END-USER, 2017–2025 ($MILLION)
TABLE 28.   CANADA BUTTERFLY VALVE MARKET, BY TYPE, 2017–2025 ($MILLION)
TABLE 29.   CANADA BUTTERFLY VALVE MARKET, BY MECHANISM, 2017–2025 ($MILLION)
TABLE 30.   CANADA BUTTERFLY VALVE MARKET, BY FUNCTION, 2017–2025 ($MILLION)
TABLE 31.   CANADA BUTTERFLY VALVE MARKET, BY END-USER, 2017–2025 ($MILLION)
TABLE 32.   MEXICO BUTTERFLY VALVE MARKET, BY TYPE, 2017–2025 ($MILLION)
TABLE 33.   MEXICO BUTTERFLY VALVE MARKET, BY MECHANISM, 2017–2025 ($MILLION)
TABLE 34.   MEXICO BUTTERFLY VALVE MARKET, BY FUNCTION, 2017–2025 ($MILLION)
TABLE 35.   MEXICO BUTTERFLY VALVE MARKET, BY END-USER, 2017–2025 ($MILLION)
TABLE 36.   EUROPE BUTTERFLY VALVE MARKET, BY TYPE, 2017–2025 ($MILLION)
TABLE 37.   EUROPE BUTTERFLY VALVE MARKET, BY MECHANISM, 2017–2025 ($MILLION)
TABLE 38.   EUROPE BUTTERFLY VALVE MARKET, BY FUNCTION, 2017–2025 ($MILLION)
TABLE 39.   EUROPE BUTTERFLY VALVE MARKET, BY END-USER, 2017–2025 ($MILLION)
TABLE 40.   GERMANY BUTTERFLY VALVE MARKET, BY TYPE, 2017–2025 ($MILLION)
TABLE 41.   GERMANY BUTTERFLY VALVE MARKET, BY MECHANISM, 2017–2025 ($MILLION)
TABLE 42.   GERMANY BUTTERFLY VALVE MARKET, BY FUNCTION, 2017–2025 ($MILLION)
TABLE 43.   GERMANY BUTTERFLY VALVE MARKET, BY END-USER, 2017–2025 ($MILLION)
TABLE 44.   FRANCE BUTTERFLY VALVE MARKET, BY TYPE, 2017–2025 ($MILLION)
TABLE 45.   FRANCE BUTTERFLY VALVE MARKET, BY MECHANISM, 2017–2025 ($MILLION)
TABLE 46.   FRANCE BUTTERFLY VALVE MARKET, BY FUNCTION, 2017–2025 ($MILLION)
TABLE 47.   FRANCE BUTTERFLY VALVE MARKET, BY END-USER, 2017–2025 ($MILLION)
TABLE 48.   UK BUTTERFLY VALVE MARKET, BY TYPE, 2017–2025 ($MILLION)
TABLE 49.   UK BUTTERFLY VALVE MARKET, BY MECHANISM, 2017–2025 ($MILLION)
TABLE 50.   UK BUTTERFLY VALVE MARKET, BY FUNCTION, 2017–2025 ($MILLION)
TABLE 51.   UK BUTTERFLY VALVE MARKET, BY END-USER, 2017–2025 ($MILLION)
TABLE 52.   RUSSIA BUTTERFLY VALVE MARKET, BY TYPE, 2017–2025 ($MILLION)
TABLE 53.   RUSSIA BUTTERFLY VALVE MARKET, BY MECHANISM, 2017–2025 ($MILLION)
TABLE 54.   RUSSIA BUTTERFLY VALVE MARKET, BY FUNCTION, 2017–2025 ($MILLION)
TABLE 55.   RUSSIA BUTTERFLY VALVE MARKET, BY END-USER, 2017–2025 ($MILLION)
TABLE 56.   REST OF EUROPE BUTTERFLY VALVE MARKET, BY TYPE, 2017–2025 ($MILLION)
TABLE 57.   REST OF EUROPE BUTTERFLY VALVE MARKET, BY MECHANISM, 2017–2025 ($MILLION)
TABLE 58.   REST OF EUROPE BUTTERFLY VALVE MARKET, BY FUNCTION, 2017–2025 ($MILLION)
TABLE 59.   REST OF EUROPE BUTTERFLY VALVE MARKET, BY END-USER, 2017–2025 ($MILLION)
TABLE 60.   ASIA-PACIFIC BUTTERFLY VALVE MARKET, BY TYPE, 2017–2025 ($MILLION)
TABLE 61.   ASIA-PACIFIC BUTTERFLY VALVE MARKET, BY MECHANISM, 2017–2025 ($MILLION)
TABLE 62.   ASIA-PACIFIC BUTTERFLY VALVE MARKET, BY FUNCTION, 2017–2025 ($MILLION)
TABLE 63.   ASIA-PACIFIC BUTTERFLY VALVE MARKET, BY END-USER, 2017–2025 ($MILLION)
TABLE 64.   JAPAN BUTTERFLY VALVE MARKET, BY TYPE, 2017–2025 ($MILLION)
TABLE 65.   JAPAN BUTTERFLY VALVE MARKET, BY MECHANISM, 2017–2025 ($MILLION)
TABLE 66.   JAPAN BUTTERFLY VALVE MARKET, BY FUNCTION, 2017–2025 ($MILLION)
TABLE 67.   JAPAN BUTTERFLY VALVE MARKET, BY END-USER, 2017–2025 ($MILLION)
TABLE 68.   CHINA BUTTERFLY VALVE MARKET, BY TYPE, 2017–2025 ($MILLION)
TABLE 69.   CHINA BUTTERFLY VALVE MARKET, BY MECHANISM, 2017–2025 ($MILLION)
TABLE 70.   CHINA BUTTERFLY VALVE MARKET, BY FUNCTION, 2017–2025 ($MILLION)
TABLE 71.   CHINA BUTTERFLY VALVE MARKET, BY END-USER, 2017–2025 ($MILLION)
TABLE 72.   INDIA BUTTERFLY VALVE MARKET, BY TYPE, 2017–2025 ($MILLION)
TABLE 73.   INDIA BUTTERFLY VALVE MARKET, BY MECHANISM, 2017–2025 ($MILLION)
TABLE 74.   INDIA BUTTERFLY VALVE MARKET, BY FUNCTION, 2017–2025 ($MILLION)
TABLE 75.   INDIA BUTTERFLY VALVE MARKET, BY END-USER, 2017–2025 ($MILLION)
TABLE 76.   SOUTH KOREA BUTTERFLY VALVE MARKET, BY TYPE, 2017–2025 ($MILLION)
TABLE 77.   SOUTH KOREA BUTTERFLY VALVE MARKET, BY MECHANISM, 2017–2025 ($MILLION)
TABLE 78.   SOUTH KOREA BUTTERFLY VALVE MARKET, BY FUNCTION, 2017–2025 ($MILLION)
TABLE 79.   SOUTH KOREA BUTTERFLY VALVE MARKET, BY END-USER, 2017–2025 ($MILLION)
TABLE 80.   REST OF ASIA-PACIFIC BUTTERFLY VALVE MARKET, BY TYPE, 2017–2025 ($MILLION)
TABLE 81.   REST OF ASIA-PACIFIC BUTTERFLY VALVE MARKET, BY MECHANISM, 2017–2025 ($MILLION)
TABLE 82.   REST OF ASIA-PACIFIC BUTTERFLY VALVE MARKET, BY FUNCTION, 2017–2025 ($MILLION)
TABLE 83.   REST OF ASIA-PACIFIC BUTTERFLY VALVE MARKET, BY END-USER, 2017–2025 ($MILLION)
TABLE 84.   LAMEA BUTTERFLY VALVE MARKET, BY TYPE, 2017–2025 ($MILLION)
TABLE 85.   LAMEA BUTTERFLY VALVE MARKET, BY MECHANISM, 2017–2025 ($MILLION)
TABLE 86.   LAMEA BUTTERFLY VALVE MARKET, BY FUNCTION, 2017–2025 ($MILLION)
TABLE 87.   LAMEA BUTTERFLY VALVE MARKET, BY END-USER, 2017–2025 ($MILLION)
TABLE 88.   LATIN AMERICA BUTTERFLY VALVE MARKET, BY TYPE, 2017–2025 ($MILLION)
TABLE 89.   LATIN AMERICA BUTTERFLY VALVE MARKET, BY MECHANISM, 2017–2025 ($MILLION)
TABLE 90.   LATIN AMERICA BUTTERFLY VALVE MARKET, BY FUNCTION, 2017–2025 ($MILLION)
TABLE 91.   LATIN AMERICA BUTTERFLY VALVE MARKET, BY END-USER, 2017–2025 ($MILLION)
TABLE 92.   MIDDLE EAST BUTTERFLY VALVE MARKET, BY TYPE, 2017–2025 ($MILLION)
TABLE 93.   MIDDLE EAST BUTTERFLY VALVE MARKET, BY MECHANISM, 2017–2025 ($MILLION)
TABLE 94.   MIDDLE EAST BUTTERFLY VALVE MARKET, BY FUNCTION, 2017–2025 ($MILLION)
TABLE 95.   MIDDLE EAST BUTTERFLY VALVE MARKET, BY END-USER, 2017–2025 ($MILLION)
TABLE 96.   AFRICA BUTTERFLY VALVE MARKET, BY MECHANISM, 2017–2025 ($MILLION)
TABLE 97.   AFRICA BUTTERFLY VALVE MARKET, BY FUNCTION, 2017–2025 ($MILLION)
TABLE 98.   AFRICA BUTTERFLY VALVE MARKET, BY END-USER, 2017–2025 ($MILLION)
TABLE 99.   ALFA LAVAL CORPORATE AB: COMPANY SNAPSHOT
TABLE 100.   ALFA LAVAL CORPORATE AB: OPERATING SEGMENTS
TABLE 101.   ALFA LAVAL CORPORATE AB: PRODUCT PORTFOLIO
TABLE 102.   CURTISS-WRIGHT CORPORATION: COMPANY SNAPSHOT
TABLE 103.   CURTISS-WRIGHT CORPORATION: OPERATING SEGMENTS
TABLE 104.   CURTISS-WRIGHT CORPORATION: PRODUCT PORTFOLIO
TABLE 105.   EMERSON ELECTRIC CO.: COMPANY SNAPSHOT
TABLE 106.   EMERSON ELECTRIC CO.: OPERATING SEGMENTS
TABLE 107.   EMERSON ELECTRIC CO.: PRODUCT PORTFOLIO
TABLE 108.   FLOWSERVE CORPORATION: COMPANY SNAPSHOT
TABLE 109.   FLOWSERVE CORPORATION: OPERATING SEGMENTS
TABLE 110.   FLOWSERVE CORPORATION: PRODUCT PORTFOLIO
TABLE 111.   AVK HOLDING A/S: COMPANY SNAPSHOT
TABLE 112.   AVK HOLDING A/S: OPERATING SEGMENTS
TABLE 113.   AVK HOLDING A/S: PRODUCT PORTFOLIO
TABLE 114.   CRANE CO.: COMPANY SNAPSHOT
TABLE 115.   CRANE CO.: OPERATING SEGMENTS
TABLE 116.   CRANE CO.: PRODUCT PORTFOLIO
TABLE 117.   KSB SE & CO. KGAA: COMPANY SNAPSHOT
TABLE 118.   KSB SE & CO. KGAA: OPERATING SEGMENTS
TABLE 119.   KSB SE & CO. KGAA: PRODUCT PORTFOLIO
TABLE 120.   SCHLUMBERGER LTD.: COMPANY SNAPSHOT
TABLE 121.   SCHLUMBERGER LTD.: OPERATING SEGMENTS
TABLE 122.   SCHLUMBERGER LTD.: PRODUCT PORTFOLIO
TABLE 123.   VELAN INC.: COMPANY SNAPSHOT
TABLE 124.   VELAN INC.: PRODUCT PORTFOLIO
TABLE 125.   THE WEIR GROUP PLC: COMPANY SNAPSHOT
TABLE 126.   THE WEIR GROUP PLC: OPERATING SEGMENTS
TABLE 127.   THE WEIR GROUP PLC: PRODUCT PORTFOLIO
LIST OF FIGURES
FIGURE 01.   GLOBAL BUTTERFLY VALVE MARKET: EXECUTIVE SUMMARY
FIGURE 02.   GLOBAL BUTTERFLY VALVE MARKET: KEY PLAYERS
FIGURE 03.   LOW-TO-MODERATE BARGAINING POWER OF SUPPLIERS
FIGURE 04.   MODERATE THREAT OF NEW ENTRANTS
FIGURE 05.   MODERATE THREAT OF SUBSTITUTES
FIGURE 06.   MODERATE-TO-HIGH INTENSITY OF RIVALRY
FIGURE 07.   MODERATE BARGAINING POWER OF BUYERS
FIGURE 08.   PATENT ANALYSIS, BY COUNTRY
FIGURE 09.   PATENT ANALYSIS, BY PLAYERS
FIGURE 10.   POWER DEMAND GROWTH RATE FORECAST (2012-2040)
FIGURE 11.   TOP IMPACTING FACTORS
FIGURE 12.   TOP INVESTMENT POCKETS
FIGURE 13.   GLOBAL BUTTERFLY VALVE MARKET, BY TYPE, 2017–2025
FIGURE 14.   COMPARATIVE SHARE ANALYSIS OF HIGH-PERFORMANCE BUTTERFLY VALVE MARKET, BY COUNTRY, 2017 & 2025 (%)
FIGURE 15.   COMPARATIVE SHARE ANALYSIS OF LINED BUTTERFLY VALVE MARKET, BY COUNTRY, 2017 & 2025 (%)
FIGURE 16.   GLOBAL BUTTERFLY VALVE MARKET, BY MECHANISM, 2017–2025
FIGURE 17.   COMPARATIVE SHARE ANALYSIS OF CENTRIC BUTTERFLY VALVE MARKET, BY COUNTRY, 2017 & 2025 (%)
FIGURE 18.   COMPARATIVE SHARE ANALYSIS OF LINED BUTTERFLY VALVE MARKET, BY COUNTRY, 2017 & 2025 (%)
FIGURE 19.   GLOBAL BUTTERFLY VALVE MARKET, BY FUNCTION, 2017–2025
FIGURE 20.   COMPARATIVE SHARE ANALYSIS OF ON/OFF BUTTERFLY VALVE MARKET, BY COUNTRY, 2017 & 2025 (%)
FIGURE 21.   COMPARATIVE SHARE ANALYSIS OF LINED BUTTERFLY VALVE MARKET, BY COUNTRY, 2017 & 2025 (%)
FIGURE 22.   GLOBAL BUTTERFLY VALVE MARKET, BY END-USER, 2017–2025
FIGURE 23.   COMPARATIVE SHARE ANALYSIS OF BUTTERFLY VALVE MARKET FOR OIL & GAS INDUSTRY, BY COUNTRY, 2017 & 2025 (%)
FIGURE 24.   COMPARATIVE SHARE ANALYSIS OF BUTTERFLY VALVE MARKET REVENUE FOR ELECTRIC POWER INDUSTRY, BY COUNTRY, 2017 & 2025 (%)
FIGURE 25.   COMPARATIVE SHARE ANALYSIS OF BUTTERFLY VALVE MARKET REVENUE FOR CHEMICAL INDUSTRY, BY COUNTRY, 2017 & 2025 (%)
FIGURE 26.   COMPARATIVE SHARE ANALYSIS OF BUTTERFLY VALVE MARKET REVENUE FOR WATER & WASTE WATER INDUSTRY, BY COUNTRY, 2017 & 2025 (%)
FIGURE 27.   COMPARATIVE SHARE ANALYSIS OF BUTTERFLY VALVE MARKET REVENUE FOR OTHERS INDUSTRY, BY COUNTRY, 2017 & 2025 (%)
FIGURE 28.   COMPARATIVE SHARE ANALYSIS OF NORTH AMERICA BUTTERFLY VALVE MARKET, BY COUNTRY, 2017–2025 (%)
FIGURE 29.   U. S. BUTTERFLY VALVE MARKET, 2017–2025 ($MILLION)
FIGURE 30.   CANADA BUTTERFLY VALVE MARKET, 2017–2025 ($MILLION)
FIGURE 31.   MEXICO BUTTERFLY VALVE MARKET, 2017–2025 ($MILLION)
FIGURE 32.   COMPARATIVE SHARE ANALYSIS OF EUROPE BUTTERFLY VALVE MARKET, BY COUNTRY, 2017–2025 (%)
FIGURE 33.   GERMANY BUTTERFLY VALVE MARKET, 2017–2025 ($MILLION)
FIGURE 34.   FRANCE BUTTERFLY VALVE MARKET, 2017–2025 ($MILLION)
FIGURE 35.   UK BUTTERFLY VALVE MARKET, 2017–2025 ($MILLION)
FIGURE 36.   RUSSIA BUTTERFLY VALVE MARKET, 2017–2025 ($MILLION)
FIGURE 37.   REST OF EUROPE BUTTERFLY VALVE MARKET, 2017–2025 ($MILLION)
FIGURE 38.   COMPARATIVE SHARE ANALYSIS OF ASIA-PACIFIC BUTTERFLY VALVE MARKET, BY COUNTRY, 2017–2025 (%)
FIGURE 39.   JAPAN BUTTERFLY VALVE MARKET, 2017–2025 ($MILLION)
FIGURE 40.   CHINA BUTTERFLY VALVE MARKET, 2017–2025 ($MILLION)
FIGURE 41.   INDIA BUTTERFLY VALVE MARKET, 2017–2025 ($MILLION)
FIGURE 42.   SOUTH KOREA BUTTERFLY VALVE MARKET, 2017–2025 ($MILLION)
FIGURE 43.   REST OF ASIA-PACIFIC BUTTERFLY VALVE MARKET, 2017–2025 ($MILLION)
FIGURE 44.   COMPARATIVE SHARE ANALYSIS OF LAMEA BUTTERFLY VALVE MARKET, BY COUNTRY, 2017–2025 (%)
FIGURE 45.   LATIN AMERICA BUTTERFLY VALVE MARKET, 2017–2025 ($MILLION)
FIGURE 46.   MIDDLE EAST BUTTERFLY VALVE MARKET, 2017–2025 ($MILLION)
FIGURE 47.   AFRICA BUTTERFLY VALVE MARKET, 2017–2025 ($MILLION)
FIGURE 48.   AFRICA BUTTERFLY VALVE MARKET, BY TYPE, 2017–2025 ($MILLION)
FIGURE 49.   KEY EXECUTIVES
FIGURE 50.   R&D EXPENDITURE, 2016–2018 ($MILLION)
FIGURE 51.   ALFA LAVAL CORPORATE AB: REVENUE, 2016–2018 ($MILLION)
FIGURE 52.   ALFA LAVAL CORPORATE AB: REVENUE SHARE BY SEGMENT, 2018 (%)
FIGURE 53.   ALFA LAVAL CORPORATE AB: REVENUE BY PRODUCT, 2016-2018 ($MILLION)
FIGURE 54.   ALFA LAVAL CORPORATE AB: REVENUE SHARE BY REGION, 2018 (%)
FIGURE 55.   KEY EXECUTIVES
FIGURE 56.   R&D EXPENDITURE, 2016–2018 ($MILLION)
FIGURE 57.   CURTISS-WRIGHT CORPORATION: REVENUE, 2016–2018 ($MILLION)
FIGURE 58.   CURTISS-WRIGHT CORPORATION: REVENUE SHARE BY SEGMENT, 2018 (%)
FIGURE 59.   CURTISS-WRIGHT CORPORATION: REVENUE BY PRODUCT, 2016-2018 ($MILLION)
FIGURE 60.   CURTISS-WRIGHT CORPORATION: REVENUE SHARE BY REGION, 2018 (%)
FIGURE 61.   KEY EXECUTIVES
FIGURE 62.   R&D EXPENDITURE, 2016–2018 ($MILLION)
FIGURE 63.   EMERSON ELECTRIC CO.: REVENUE, 2016–2018 ($MILLION)
FIGURE 64.   EMERSON ELECTRIC CO.: REVENUE SHARE BY SEGMENT, 2018 (%)
FIGURE 65.   EMERSON ELECTRIC CO.: REVENUE BY PRODUCT, 2016-2018 ($MILLION)
FIGURE 66.   EMERSON ELECTRIC CO.: REVENUE SHARE BY REGION, 2018 (%)
FIGURE 67.   KEY EXECUTIVES
FIGURE 68.   R&D EXPENDITURE, 2016–2018 ($MILLION)
FIGURE 69.   FLOWSERVE CORPORATION: REVENUE, 2016–2018 ($MILLION)
FIGURE 70.   FLOWSERVE CORPORATION: REVENUE SHARE BY SEGMENT, 2018 (%)
FIGURE 71.   FLOWSERVE CORPORATION: REVENUE BY CUSTOMERS, 2016-2018 ($MILLION)
FIGURE 72.   FLOWSERVE CORPORATION: REVENUE SHARE BY REGION, 2018 (%)
FIGURE 73.   KEY EXECUTIVES
FIGURE 74.   AVK HOLDING A/S: REVENUE, 2016–2018 ($MILLION)
FIGURE 75.   KEY EXECUTIVES
FIGURE 76.   R&D EXPENDITURE, 2016–2018 ($MILLION)
FIGURE 77.   CRANE CO.: REVENUE, 2016–2018 ($MILLION)
FIGURE 78.   CRANE CO.: REVENUE SHARE BY SEGMENT, 2018 (%)
FIGURE 79.   CRANE CO.: REVENUE SHARE BY REGION, 2018 (%)
FIGURE 80.   KEY EXECUTIVES
FIGURE 81.   R&D EXPENDITURE, 2016–2018 ($MILLION)
FIGURE 82.   KSB SE & CO. KGAA: REVENUE, 2016–2018 ($MILLION)
FIGURE 83.   KSB SE & CO. KGAA: REVENUE SHARE BY SEGMENT, 2018 (%)
FIGURE 84.   KEY EXECUTIVES
FIGURE 85.   R&D EXPENDITURE, 2016–2018 ($MILLION)
FIGURE 86.   SCHLUMBERGER LTD.: REVENUE, 2016–2018 ($MILLION)
FIGURE 87.   SCHLUMBERGER LTD.: REVENUE SHARE BY SEGMENT, 2018 (%)
FIGURE 88.   SCHLUMBERGER LTD.: REVENUE SHARE BY GEOGRAPHY, 2018 (%)
FIGURE 89.   KEY EXECUTIVES
FIGURE 90.   R&D EXPENDITURE, 2017–2018 ($MILLION)
FIGURE 91.   VELAN INC.: REVENUE, 2016–2018 ($MILLION)
FIGURE 92.   VELAN INC.: REVENUE SHARE BY SEGMENT, 2018 (%)
FIGURE 93.   VELAN INC.: REVENUE SHARE BY REGION, 2018 (%)
FIGURE 94.   KEY EXECUTIVES
FIGURE 95.   R&D EXPENDITURE, 2017–2018 ($MILLION)
FIGURE 96.   THE WEIR GROUP PLC: REVENUE, 2016–2018 ($MILLION)
FIGURE 97.   THE WEIR GROUP PLC: REVENUE SHARE BY SEGMENT, 2018 (%)
FIGURE 98.   THE WEIR GROUP PLC: REVENUE SHARE BY REGION, 2018 (%)
The butterfly valves market is projected to depict a prominent growth during the forecast period, owing to various factors, such as increase in demand from the oil & gas industry, rise in number of industrial infrastructures, surge in usage of power in industrial processes, and growth in requirement of automation in the process industries.
Butterfly valves are widely used in various industries, which include water supply, wastewater treatment, fire protection and gas supply, in the chemical and oil industries, in fuel handling systems, and power generation. Oil & gas industry is currently creating the highest demand for stainless steel butterfly valves. Electric stainless-steel butterfly valves are more efficient and enable greater level of controls as compared to the other type of valves. Moreover, increase in investment in the oil & gas industry is also expected to boost the demand for butterfly valves in various processes in the developing economies such as China and India.
Various leading manufacturers such as Emerson Electric Co., Flowserve Corporation, Cameron, Alfa-Laval Corporate AB, AVK Group, Crane Co., Weir Group, Curtiss-Wright Corporation, KSB Group, and Velan Inc. occupy a prominent revenue share in the butterfly valve market.
Â
A. The butterfly valves market size was valued at $8,282.6 million in 2017, and is projected to reach at $13,667.0 million by 2025, growing at a CAGR of 6.3% from 2018 to 2025.
A. Increase in demand from oil & gas industry majorly drives the growth of the butterfly valves market owing to the requirement of stainless steel butterfly valves from the oil & gas industry.
A. The report sample for butterfly valves market report can be obtained on demand from the website.
A. There is an increase in the demand for high performance butterfly valves in the oil & gas industry, owing to straight-through flow path, high capacity, and ability to pass solid & viscous media.
A. The statistical data of the top market players of butterfly valves market can be obtained from the company profile section mentioned in the report. This section includes analysis of top ten player’s operating in the butterfly valves industry.
A. The growth strategies of butterfly valves market players are acquisition and product launch.
A. Asia-Pacific region is expected to provide more business opportunities for butterfly valves market in coming years.
A. The key players operating in the market include Emerson Electric Co., Flowserve Corporation, Cameron, Alfa-Laval Corporate AB, AVK Group, Crane Co., Weir Group, Curtiss-Wright Corporation, KSB Group, and Velan Inc.
A. The global butterfly valves market analysis comprises of various segments including type, mechanism, function, end users, and region.
A. The oil & gas, electric power, water & wastewater, chemical, and other industries are the potential customers of butterfly valves industry.
Start reading instantly.
This Report and over 66,905+ more Reports, Available with Avenue Library. T&C*.
Enterprise
License/PDF
Library
Membership
*Taxes/Fees, if applicable will be added during checkout. All prices in USD
To ensure high-level data integrity, accurate analysis, and impeccable forecasts
For complete satisfaction
On-demand customization of scope of the report to exactly meet your needs
Targeted market view to provide pertinent information and save time of readers
Get insights on topics that are crucial for your business. Stay abreast of your interest areas.
Get Industry Data AlertsTo ensure high-level data integrity, accurate analysis, and impeccable forecasts
For complete satisfaction
On-demand customization of scope of the report to exactly meet your needs
Targeted market view to provide pertinent information and save time of readers