0
2021
California Industrial Degreasing Solvents Market

California Industrial Degreasing Solvents Market

by Product (Oxygenated Solvents, Halogenated Solvents, Hydrocarbon Solvents, and Green Solvents) and End-Use Industry (Paint, Coating, and Adhesive Manufacturing; Other Chemical Product and Preparation Manufacturing; Pesticide, Fertilizer, and Other Agricultural Chemical Manufacturing; Pharmaceutical and Medicine Manufacturing; Automotive Repair and Maintenance; Basic Chemical Manufacturing, and Others): Global Opportunity Analysis and Industry Forecast, 2020-2027

Report Code: A11108
Apr 2021 | Pages: 179
Tables: 100
Charts: 42
  • Formats*:

  • pdf

    Single User License, Five User
    License & Enterprise User License

  • xls

    Data Pack Excel License

  • ppt

    It comes with the additional cost
    of $2500.00 contact sales.


COVID-19

Pandemic disrupted the entire world and affected many industries.

Get detailed COVID-19 impact analysis on the California Industrial Degreasing Solvents Market

Request Now !

California Industrial Degreasing Solvents Market Outlook - 2020-2027

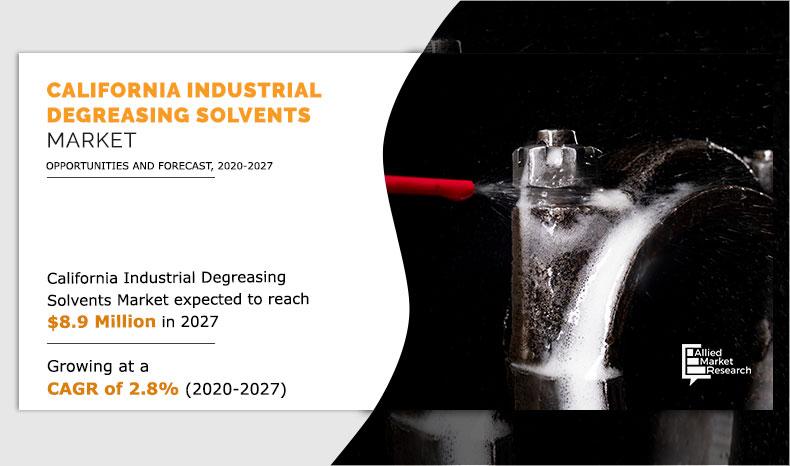
The California industrial degreasing solvents market was valued at $7.1 million in 2019 and is projected to reach $8.9 million by 2027, growing at a CAGR of 2.8% from 2020 to 2027. 

Industrial degreasers are effective cleaning solutions used in industrial and commercial facilities. It comprises grease-cutting solvents. Industrial degreasers have alkaline or acidic characteristics that help remove grease from different industrial surfaces. Degreasing solvents are cleaning products especially developed to remove oils, grease, grime, and others. Some of the degreasing solvents are compatible with various materials such as metals, plastics, and elastomers. It reacts with grease particles chemically and produces a deep cleaning effect. Different types of solvent blends are also used as industrial degreasing solvents. Degreasers offer numerous advantages such as deep cleaning, effortless application, time saving, cost-effective, and others. Some of the equipment used in industries for remove contaminants such as grease are vapor degreaser, pre-saturated hand wipes, aerosol spray, and others. 

California-Industrial-Degreasing-Solvents-Market

The California industrial degreasing solvents market is driven by factors such as increased average age of vehicles, increased demand for water-based degreasers, and others. In addition, the consumer awareness regarding disadvantages of solvent-based degreasers boosts the demand for water-based degreasers. However, rise in environmental and health concerns regarding solvent-based degreasers is one of the factors hindering the California industrial degreasing solvents market growth. In addition, rise in stringent government regulations regarding some of the solvents is one of the main challenges for the players active in the California industrial degreasing solvents market. 

The California industrial degreasing solvents market is segmented on the basis of product and end-use industry. On the basis of product, the market is categorized into oxygenated solvents, halogenated solvents, hydrocarbon solvents, and green solvents. Oxygenated solvents are further bifurcated into alcohol, ester, ketones, and glycols. Halogenated solvent segment is further classified into methylene chloride. Hydrocarbon solvents are further classified into petroleum derivatives and aromatics. Green solvents are further divided into bio-alcohol, bio-glycol, and others. Based on the end-use industry, the California industrial degreasing solvents market is classified into paint, coating, and adhesive manufacturing; other chemical product and preparation manufacturing; pesticide, fertilizer, and other agricultural chemical manufacturing; pharmaceutical and medicine manufacturing; automotive repair and maintenance; basic chemical manufacturing; and others.  The California industrial degreasing solvents market share is analyzed for each and every segments.

The California industrial degreasing solvents market analysis covers in-depth information of the major industry participants. Some of the major players in the California industrial degreasing solvents market include BASF SE, RB Products, Inc., Royal Dutch Shell Plc, Wego Chemical Group, Jayne Products, Keteca Water Works, CRC Industries, Inc., Columbus Chemical Industries, LyondellBasell Industries N.V., Dow Inc., Honeywell International Inc., Arkema, and Eastman Chemical Company.  

California Industrial Degreasing Solvents Market
By Product

Your browser does not support the canvas element.

Oxygenated Degreasing Solvent is projected as the most lucrative segment.

By product, the oxygenated degreasing solvent garnered 40.1% share in 2019, in terms of volume. This is attributed to its benefits such as high solvency power, low toxicity, and others. Moreover, oxygenated solvents such as alcohol-based solvents have relatively low cost and high dissolution power.

On the basis of product, halogenated degreasing solvents garnered 19.6% market share in the California industrial degreasing solvents market in terms of revenue in 2019. As compared to oxygenated and hydrocarbon solvents, the demand for halogenated solvent is less as it contains ozone depletion compounds.

Based on the product, hydrocarbon degreasing solvents garnered 36.1% market share in 2019 in terms of volume.  Hydrocarbon degreasing solvents can be categorized into two types, that is, aromatic and aliphatic. Both play a significant role in degreasing, and some industrial cleaning products comprise both of them. A major benefit of hydrocarbon solvent-based degreasers is that it does not utilize much of water.

Green degreasing solvent garnered 8.6% market share in California industrial degreasing solvents market in terms of volume in 2019. The major growth factor that drives the demand for green solvents in degreasing application is rise in stringent environmental regulations to reduce volatile organic compounds. However, the cost and performance issues are anticipated to hinder the growth for green solvents in California.

California Industrial Degreasing Solvents Market
By End-use Industry

Your browser does not support the canvas element.

Automotive repair and maintenance is projected as the most lucrative segment.

By end-use industry, the automotive repair and maintenance segment garnered 21.0% share in 2019 in terms of volume. This is attributed to presence of established consumer base. According to the California Bureau of Automotive Repair, there are close to 35,000 automotive repair dealers in 2019. Hence, the demand for degreaser solvents in California is expected to grow steadily over the years. Automotive repairers use non-chlorinated hydrocarbon-based aerosol spray degreasers for brake part cleaning applications.

On the basis of end-use industry, other chemical product and preparation manufacturing segment garnered 16.5% share in terms of volume in 2019. This is attributed to increased focus toward reducing occupational hazards. This factor further plays a major role in California, which has a well-established oil & gas industry as well as mining industry.  In oil and gas industry solvents based degreasers are used for cleaning internal pipes.

Key benefits for stakeholders

  • The California industrial degreasing solvents market forecast is studied from 2020 to 2027.
  • The report outlines the trends of the California degreasing solvents market for 2019 to understand the potential investment pockets.
  • Shelf-life analysis for solvents is also covered in the study.
  • The California industrial degreasing solvents market size is provided in terms of volume and revenue.
  • The report provides an in-depth analysis of the market with the current trends and impact of key government regulations on the market.
  • This report highlights the key drivers, opportunities, and restraints of the market along with the impact analysis.
  • Porter’s five forces analysis helps analyze the potential of buyers & suppliers and the competitive scenario of the industry for strategy building.
  • The study provides a comprehensive analysis of the factors that drive and restrain the California industrial degreasing solvents market.

Key market segments

By Product 

  • Oxygenated Solvents
    • Alcohol
    • Ester
    • Ketones
    • Glycols 
  • Halogenated Solvents
    • Methylene Chloride 
    • Hydrocarbon Solvents
    • Petroleum Derivatives
    • Aromatics 
  • Green Solvents
    • Bio-alcohol
    • Bio-glycol
    • Others

By End-Use Industry

  • Paint, Coating, and Adhesive Manufacturing
  • Other Chemical Product and Preparation Manufacturing
  • Pesticide, Fertilizer, and Other Agricultural Chemical Manufacturing
  • Pharmaceutical and Medicine Manufacturing 
  • Automotive Repair and Maintenance
  • Basic Chemical Manufacturing
  • Others

California Industrial Degreasing Solvents Market Report Highlights

Aspects Details
By Product
  • Oxygenated Solvents
    • Alcohol
    • Esters
    • Ketones
    • Glycol
  • Halogenated Solvents
    • Methylene chloride
  • Hydrocarbon solvents
    • Aromatic
      • Xylene
    • Petroleum derivative
      • Kerosene
      • White spirit
      • Hexane
      • Benzene
      • Toluene
      • Others
  • Green Solvents
    • Bio-alcohol solvents
    • Bio-glycol solvents
    • Others
By End-Use Industry
  • Paint, coating, and adhesive manufacturing
  • Other chemical product and preparation manufacturing
  • Pesticide, fertilizer, and other agricultural chemical manufacturing
  • Pharmaceutical and medicine manufacturing
  • Automotive repair and maintenance
  • Basic chemical manufacturing
  • Others
By Region
  • North America  (U.S., Canada, Mexico)
  • Europe  (France, Germany, Italy, Spain, UK, Russia, Rest of Europe)
  • Asia-Pacific  (China, Japan, India, South Korea, Australia, Thailand, Malaysia, Indonesia, Rest of Asia-Pacific)
  • LAMEA  (Brazil, South Africa, Saudi Arabia, UAE, Argentina, Rest of LAMEA)
Key Market Players BASF SE, EASTMAN CHEMICAL COMPANY, JAYNE PRODUCTS, DOW INC., LYONDELLBASELL INDUSTRIES N.V., COLUMBUS CHEMICALS INDUSTRIES, HONEYWELL INTERNATIONAL INC., ROYAL DUTCH SHELL PLC, RB PRODUCTS, INC., ARKEMA, KETECA WATER WORKS, WEGO CHEMICAL GROUP, .CRC INDUSTRIES, INC.
 

CHAPTER 1:INTRODUCTION

1.1.Report description
1.2.Key benefits for stakeholders
1.3.Key market segments
1.4.Research methodology

1.4.1.Primary research
1.4.2.Secondary research
1.4.3.Analyst tools and models

CHAPTER 2:EXECUTIVE SUMMARY

2.1.Key findings of the study
2.2.CXO perspective

CHAPTER 3:MARKET OVERVIEW

3.1.Market definition and scope
3.2.Key forces shaping the California degreasing solvent market

3.2.1.Bargaining power of the supplier
3.2.2.Bargaining power of the buyer
3.2.3.Threat of substitutes
3.2.4.Threat of new entrant
3.2.5.Competitive rivalry

3.3.Market Dynamics

3.3.1.Drivers

3.3.1.1.Increasing average age of vehicles
3.3.1.2.Increased demand for water-based degreasers

3.3.2.Restraint

3.3.2.1.Rise in environmental and health concerns regarding solvent-based degreasers

3.3.3.Opportunity

3.3.3.1.Growth of the electronics sector

3.4.Pricing analysis
3.5.Value chain
3.6.Impact of key regulations on the market
3.7.Criss-cross analysis of degreasing solvents (product Vs end-use industries)
3.8.Shelf-life analysis for solvents
3.9.Degreasing solvent blend
3.10.Degreasing equipment

3.10.1.Vapor degreaser
3.10.2.Presaturated hand wipes
3.10.3.Aerosol spray
3.10.4.Others
3.11.VoC limits

CHAPTER 4:CALIFORNIA DEGREASING SOLVENTS MARKET, BY PRODUCT

4.1.Overview

4.1.1.Market size

4.2.Oxygenated solvents

4.2.1.Key market trends, growth factors, and opportunities
4.2.2.Market size
4.2.3.Alcohol

4.2.3.1.Market size
4.2.3.2.Isopropyl alcohol
4.2.3.3.Propanol
4.2.3.4.n-Butanol
4.2.3.5.Others

4.2.4.Esters

4.2.4.1.Market size
4.2.4.2.Ethyl acetate
4.2.4.3.Butyl acetate
4.2.4.4.Others

4.2.5.Ketones

4.2.5.1.Market size
4.2.5.2.Acetone
4.2.5.3.Methyl ethyl ketone
4.2.5.4.Methyl isobutyl ketone
4.2.5.5.Disobutyl ketone
4.2.5.6.Others

4.2.6.Glycol

4.2.6.1.Market size
4.2.6.2.Propylene glycol
4.2.6.3.Ethylene glycol
4.2.6.4.Others

4.3.Halogenated solvents

4.3.1.Key market trends, growth factors, and opportunities
4.3.2.Market size

4.3.2.1.Methylene chloride

4.4.Hydrocarbon solvents

4.4.1.Key market trends, growth factors, and opportunities
4.4.2.Market size
4.4.3.Aromatic

4.4.3.1.Xylene

4.4.4.Petroleum derivative

4.4.4.1.Market size
4.4.4.2.Kerosene
4.4.4.3.White spirit
4.4.4.4.Hexane
4.4.4.5.Benzene
4.4.4.6.Toluene
4.4.4.7.Others

4.5.Green solvents

4.5.1.Key market trends, growth factors, and opportunities
4.5.2.Market size
4.5.3.Bio-alcohol solvents
4.5.4.Bio-glycol solvents
4.5.5.Others

CHAPTER 5:CALIFORNIA DEGREASING SOLVENT MARKET, BY END-USE INDUSTRY

5.1.Overview

5.1.1.Market size and forecast

5.2.Paint, coating, and adhesive manufacturing

5.2.1.Key market trends, growth factors, and opportunities

5.3.Other chemical product and preparation manufacturing

5.3.1.Key market trends, growth factors, and opportunities

5.4.Pesticide, fertilizer, and other agricultural chemical manufacturing

5.4.1.Key market trends, growth factors, and opportunities

5.5.Pharmaceutical and medicine manufacturing

5.5.1.Key market trends, growth factors, and opportunities

5.6.Automotive repair and maintenance

5.6.1.Key market trends, growth factors, and opportunities

5.7.Basic chemical manufacturing

5.7.1.Key market trends, growth factors, and opportunities

5.8.Others

5.8.1.Key market trends, growth factors, and opportunities

CHAPTER 6:COMPETITIVE LANDSCAPE

6.1.Introduction

6.1.1.Market player positioning, 2019

6.2.Product mapping of key players
6.3.Competitive heatmap

CHAPTER 7:COMPANY PROFILES

7.1.ARKEMA

7.1.1.Company overview
7.1.2.Key executive
7.1.3.Company snapshot
7.1.4.Operating business segments
7.1.5.Product portfolio
7.1.6.R&D expenditure
7.1.7.Business performance

7.2.BASF SE

7.2.1.Company overview
7.2.2.Key executive
7.2.3.Company snapshot
7.2.4.Operating business segments
7.2.5.Product portfolio
7.2.6.R&D expenditure
7.2.7.Business performance

7.3.CRC INDUSTRIES, INC.

7.3.1.Company overview
7.3.2.Key executive
7.3.3.Company snapshot
7.3.4.Product portfolio

7.4.COLUMBUS CHEMICALS INDUSTRIES

7.4.1.Company overview
7.4.2.Key executive
7.4.3.Company snapshot
7.4.4.Product portfolio

7.5.DOW INC.

7.5.1.Company overview
7.5.2.Key executive
7.5.3.Company snapshot
7.5.4.Operating business segments
7.5.5.Product portfolio
7.5.6.R&D expenditure
7.5.7.Business performance

7.6.EASTMAN CHEMICAL COMPANY

7.6.1.Company overview
7.6.2.Key executive
7.6.3.Company snapshot
7.6.4.Operating business segments
7.6.5.Product portfolio
7.6.6.R&D expenditure
7.6.7.Business performance

7.7.HONEYWELL INTERNATIONAL INC.

7.7.1.Company overview
7.7.2.Key executive
7.7.3.Company snapshot
7.7.4.Operating business segments
7.7.5.Product portfolio
7.7.6.R&D expenditure
7.7.7.Business performance

7.8.JAYNE PRODUCTS

7.8.1.Company overview
7.8.2.Key executive
7.8.3.Company snapshot
7.8.4.Operating business segments
7.8.5.Product portfolio

7.9.KETECA WATER WORKS

7.9.1.Company overview
7.9.2.Key executive
7.9.3.Company snapshot
7.9.4.Product portfolio

7.10.LYONDELLBASELL INDUSTRIES N.V.

7.10.1.Company overview
7.10.2.Key executive
7.10.3.Company snapshot
7.10.4.Operating business segments
7.10.5.Product portfolio
7.10.6.R&D expenditure
7.10.7.Business performance

7.11.RB PRODUCTS, INC.

7.11.1.Company overview
7.11.2.Key Executive
7.11.3.Company snapshot
7.11.4.Product portfolio

7.12.ROYAL DUTCH SHELL PLC

7.12.1.Company overview
7.12.2.Key executive
7.12.3.Company snapshot
7.12.4.Operating business segments
7.12.5.Product portfolio
7.12.6.R&D expenditure
7.12.7.Business performance

7.13.WEGO CHEMICAL GROUP

7.13.1.Company overview
7.13.2.Key executive
7.13.3.Company snapshot
7.13.4.Product portfolio

LIST OF TABLES

TABLE 01.PRICING ANALYSIS: BY PRODUCT ($/KG)
TABLE 02.CALIFONIA DEGREASING SOLVENTS MARKET FOR PAINT, COATING, AND ADHESIVE MANUFACTURING, (NAICS CODE – 3255), BY PRODUCT TYPE (TONS)
TABLE 03.CALIFONIA DEGREASING SOLVENTS MARKET FOR PAINT, COATING, AND ADHESIVE MANUFACTURING, (NAICS CODE – 3255), BY PRODUCT TYPE ($MILLION)
TABLE 04.CALIFONIA DEGREASING SOLVENTS MARKET FOR OTHER CHEMICAL PRODUCT AND PREPARATION MANUFACTURING, (NAICS CODE – 3259), BY PRODUCT TYPE (TONS)
TABLE 05.CALIFONIA DEGREASING SOLVENTS MARKET FOR CHEMICAL PRODUCT AND PREPARATION MANUFACTURING , (NAICS CODE – 3259), BY PRODUCT TYPE ($MILLION)
TABLE 06.CALIFONIA DEGREASING SOLVENTS MARKET FOR PESTICIDE, FERTILIZER, AND OTHER AGRICULTURAL CHEMICAL MANUFACTURING, (NAICS CODE-3253), BY PRODUCT TYPE (TONS)
TABLE 07.CALIFONIA DEGREASING SOLVENTS MARKET FOR PESTICIDE, FERTILIZER, AND OTHER AGRICULTURAL CHEMICAL MANUFACTURING, (NAICS CODE-3253), BY PRODUCT TYPE ($MILLION)
TABLE 08.CALIFONIA DEGREASING SOLVENTS MARKET FOR PHARMACEUTICAL AND MEDICINE MANUFACTURING, (NAICS CODE – 3254), BY PRODUCT TYPE (TONS)
TABLE 09.CALIFONIA DEGREASING SOLVENTS MARKET FOR PHARMACEUTICAL AND MEDICINE MANUFACTURING, (NAICS CODE – 3254), BY PRODUCT TYPE ($MILLION)
TABLE 10.CALIFONIA DEGREASING SOLVENTS MARKET FOR AUTOMOTIVE REPAIR AND MAINTENANCE, (NAICS CODE-8111), BY PRODUCT TYPE (TONS)
TABLE 11.CALIFONIA DEGREASING SOLVENTS MARKET FOR AUTOMOTIVE REPAIR AND MAINTENANCE, (NAICS CODE-8111), BY PRODUCT TYPE ($MILLION)
TABLE 12.CALIFONIA DEGREASING SOLVENTS MARKET FOR BASIC CHEMICAL MANUFACTURING, (NAICS CODE- 3251), BY PRODUCT TYPE (TONS)
TABLE 13.CALIFONIA DEGREASING SOLVENTS MARKET FOR BASIC CHEMICAL MANUFACTURING, ((NAICS CODE- 3251), BY PRODUCT TYPE ($MILLION)
TABLE 14.CALIFONIA DEGREASING SOLVENTS MARKET FOR OTHERS, (NAICS CODES – 334, 331, 332, 333), BY PRODUCT TYPE (TONS)
TABLE 15.CALIFONIA DEGREASING SOLVENTS MARKET FOR OTHERS, (NAICS CODES – 334, 331, 332, 333), BY PRODUCT TYPE ($MILLION)
TABLE 16.SOLVENT REQUIREMENTS AS PER CLEANING ACTIVITY
TABLE 17.VOC LIMITS OR VOC CONTENT FOR DEGREASING SOLVENTS
TABLE 18.CALIFORNIA DEGREASING SOLVENTS, BY PRODUCT, 2019-2027 (TONS)
TABLE 19.CALIFORNIA DEGREASING SOLVENTS MARKET, BY PRODUCT, 2019-2027 ($MILLION)
TABLE 20.CALIFORNIA OXYGENATED DEGREASING SOLVENTS MARKET, BY PRODUCT TYPE, 2019-2027 (TONS)
TABLE 21.CALIFORNIA OXYGENATED DEGREASING SOLVENTS MARKET, BY PRODUCT TYPE, 2019-2027 ($MILLION)
TABLE 22.CALIFORNIA OXYGENATED DEGREASING SOLVENTS MARKET, BY ALCOHOL TYPE, 2019-2027 (TONS)
TABLE 23.CALIFORNIA OXYGENATED DEGREASING SOLVENTS MARKET, BY ALCOHOL TYPE, 2019-2027 ($MILLION)
TABLE 24.CALIFORNIA OXYGENATED DEGREASING SOLVENTS MARKET, BY ESTER TYPE, 2019-2027 (TONS)
TABLE 25.CALIFORNIA OXYGENATED DEGREASING SOLVENTS MARKET, BY ESTER TYPE, 2019-2027 ($MILLION)
TABLE 26.CALIFORNIA OXYGENATED DEGREASING SOLVENTS MARKET, BY KETONES TYPE, 2019-2027 (TONS)
TABLE 27.CALIFORNIA OXYGENATED DEGREASING SOLVENTS MARKET, BY KETONES TYPE, 2019-2027 ($MILLION)
TABLE 28.CALIFORNIA OXYGENATED DEGREASING SOLVENTS MARKET, BY GLYCOL TYPE, 2019-2027 (TONS)
TABLE 29.CALIFORNIA OXYGENATED DEGREASING SOLVENTS MARKET, BY GLYCOL TYPE, 2019-2027 ($MILLION)
TABLE 30.CALIFORNIA HALOGENATED DEGREASING SOLVENTS MARKET, BY PRODUCT TYPE, 2019-2027 (TONS)
TABLE 31.CALIFORNIA HALOGENATED DEGREASING SOLVENTS MARKET, BY PRODUCT TYPE, 2019-2027 ($MILLION)
TABLE 32.CALIFORNIA HYDROCARBON DEGREASING SOLVENTS MARKET, BY PRODUCT TYPE, 2019-2027 (TONS)
TABLE 33.CALIFORNIA HYDROCARBON DEGREASING SOLVENTS MARKET, BY PRODUCT TYPE, 2019-2027 ($MILLION)
TABLE 34.CALIFORNIA HYDROCARBON DEGREASING SOLVENTS MARKET, BY PETROLEUM DERIVATIVE TYPE, 2019-2027 (TONS)
TABLE 35.CALIFORNIA HYDROCARBON DEGREASING SOLVENTS MARKET, BY PETROLEUM DERIVATIVE TYPE, 2019-2027 ($MILLION)
TABLE 36.CALIFORNIA GREEN DEGREASING SOLVENTS MARKET, BY PRODUCT TYPE, 2019-2027 (TONS)
TABLE 37.CALIFORNIA GREEN DEGREASING SOLVENTS MARKET, BY PRODUCT TYPE, 2019-2027 ($MILLION)
TABLE 38.CALIFORNIA DEGREASING SOLVENT MARKET, BY END-USE INDUSTRY, 2019-2027 (TONS)
TABLE 39.CALIFORNIA DEGREASING SOLVENT MARKET, BY END-USE INDUSTRY, 2019-2027 ($MILLION)
TABLE 40.ARKEMA: KEY EXECUTIVES
TABLE 41.ARKEMA: COMPANY SNAPSHOT
TABLE 42.ARKEMA: OPERATING SEGMENTS
TABLE 43.ARKEMA: PRODUCT PORTFOLIO
TABLE 44.ARKEMA: R&D EXPENDITURE, 2018–2020 ($MILLION)
TABLE 45.ARKEMA: NET SALES, 2018–2020 ($MILLION)
TABLE 46.BASF SE: KEY EXECUTIVES
TABLE 47.BASF SE: COMPANY SNAPSHOT
TABLE 48.BASF SE: OPERATING SEGMENTS
TABLE 49.BASF SE: PRODUCT PORTFOLIO
TABLE 50.BASF: R&D EXPENDITURE, 2018–2020 ($MILLION)
TABLE 51.BASF SE: NET SALES, 2018–2020($MILLION)
TABLE 52.CRC: KEY EXECUTIVES
TABLE 53.CRC: COMPANY SNAPSHOT
TABLE 54.CRC: PRODUCT PORTFOLIO
TABLE 55.CCI: KEY EXECUTIVES
TABLE 56.CCI: COMPANY SNAPSHOT
TABLE 57.CCI: PRODUCT PORTFOLIO
TABLE 58.DOW: KEY EXECUTIVES
TABLE 59.DOW: COMPANY SNAPSHOT
TABLE 60.DOW: OPERATING SEGMENTS
TABLE 61.DOW: PRODUCT PORTFOLIO
TABLE 62.DOW: R&D EXPENDITURE, 2018–2020 ($MILLION)
TABLE 63.DOW: NET SALES, 2018–2020 ($MILLION)
TABLE 64.EASTMAN CHEMICAL: KEY EXECUTIVES
TABLE 65.EASTMAN CHEMICAL: COMPANY SNAPSHOT
TABLE 66.EASTMAN CHEMICAL: OPERATING SEGMENTS
TABLE 67.EASTMAN CHEMICAL: PRODUCT PORTFOLIO
TABLE 68.EASTMAN CHEMICAL: R&D EXPENDITURE, 2018–2020 ($MILLION)
TABLE 69.EASTMAN CHEMICAL: NET SALES, 2018–2020 ($MILLION)
TABLE 70.HONEYWELL: KEY EXECUTIVES
TABLE 71.HONEYWELL: COMPANY SNAPSHOT
TABLE 72.HONEYWELL: OPERATING SEGMENTS
TABLE 73.HONEYWELL: PRODUCT PORTFOLIO
TABLE 74.HONEYWELL: R&D EXPENDITURE, 2017–2019 ($MILLION)
TABLE 75.HONEYWELL: NET SALES, 2017–2019 ($MILLION)
TABLE 76.JAYNE PRODUCT: KEY EXECUTIVES
TABLE 77.JAYNE PRODUCT: COMPANY SNAPSHOT
TABLE 78.JAYNE PRODUCT: OPERATING SEGMENTS
TABLE 79.JAYNE PRODUCT: PRODUCT PORTFOLIO
TABLE 80.KETECA WATER WORKS: KEY EXECUTIVES
TABLE 81.KETECA WATER WORKS: COMPANY SNAPSHOT
TABLE 82.KETECA WATER WORKS: PRODUCT PORTFOLIO
TABLE 83.LYONDELLBASELL: KEY EXECUTIVES
TABLE 84.LYONDELLBASELL: COMPANY SNAPSHOT
TABLE 85.LYONDELLBASELL: OPERATING SEGMENTS
TABLE 86.LYONDELLBASELL: PRODUCT PORTFOLIO
TABLE 87.LYONDELLBASELL: R&D EXPENDITURE, 2017–2019 ($MILLION)
TABLE 88.LYONDELLBASELL: NET SALES, 2017–2019 ($MILLION)
TABLE 89.RB PRODUCTS: KEY EXECUTIVES
TABLE 90.RB PRODUCTS: COMPANY SNAPSHOT
TABLE 91.RB PRODUCTS: PRODUCT PORTFOLIO
TABLE 92.SHELL: KEY EXECUTIVES
TABLE 93.SHELL: COMPANY SNAPSHOT
TABLE 94.SHELL: OPERATING SEGMENTS
TABLE 95.SHELL: PRODUCT PORTFOLIO
TABLE 96.SHELL: R&D EXPENDITURE, 2018–2020 ($MILLION)
TABLE 97.SHELL: NET SALES, 2018–2020 ($MILLION)
TABLE 98.WEGO CHEMICAL: KEY EXECUTIVES
TABLE 99.WEGO CHEMICAL: COMPANY SNAPSHOT
TABLE 100.WEGO CHEMICAL: PRODUCT PORTFOLIO

LIST OF FIGURES

FIGURE 01.KEY MARKET SEGMENTS
FIGURE 02.HIGH BARGAINING POWER OF SUPPLIERS
FIGURE 03.MODERATE BARGAINING POWER OF BUYERS
FIGURE 04.LOW THREAT OF SUBSTITUTES
FIGURE 05.MODERATE THREAT OF NEW ENTRANTS
FIGURE 06.MODERATE INTENSITY OF RIVALRY
FIGURE 07.CALIFORNIA DEGREASING SOLVENTS MARKET DYNAMICS
FIGURE 08.CALIFORNIA DEGREASING SOLVENTS MARKET: VALUE CHAIN
FIGURE 09.CALIFORNIA INDUSTRIAL DEGREASING SOLVENTS MARKET, BY PRODUCT, 2019–2027 ($MILLION)
FIGURE 10.CALIFORNIA INDUSTRIAL DEGREASING SOLVENTS MARKET, BY END-USE INDUSTRY, 2019–2027($MILLION)
FIGURE 11.MARKET PLAYER POSITIONING, 2019
FIGURE 12.PRODUCT MAPPING OF KEY PLAYERS
FIGURE 13.COMPETITIVE HEATMAP OF KEY PLAYERS
FIGURE 14.ARKEMA: R&D EXPENDITURE, 2018–2020 ($MILLION)
FIGURE 15.ARKEMA: NET SALES, 2018–2020 ($MILLION)
FIGURE 16.ARKEMA: REVENUE SHARE BY SEGMENT, 2020 (%)
FIGURE 17.BASF: R&D EXPENDITURE, 2018–2020 ($MILLION)
FIGURE 18.BASF SE: NET SALES, 2018–2020 ($MILLION)
FIGURE 19.BASF SE: REVENUE SHARE BY SEGMENT, 2020 (%)
FIGURE 20.BASF SE: REVENUE SHARE BY REGION, 2020 (%)
FIGURE 21.DOW: R&D EXPENDITURE, 2018–2020 ($MILLION)
FIGURE 22.DOW: NET SALES, 2018–2020 ($MILLION)
FIGURE 23.DOW: REVENUE SHARE BY SEGMENT, 2020 (%)
FIGURE 24.DOW: REVENUE SHARE BY REGION, 2020 (%)
FIGURE 25.EASTMAN CHEMICAL: R&D EXPENDITURE, 2018–2020 ($MILLION)
FIGURE 26.EASTMAN CHEMICAL: NET SALES, 2018–2020 ($MILLION)
FIGURE 27.EASTMAN CHEMICAL: REVENUE SHARE BY SEGMENT, 2020 (%)
FIGURE 28.EASTMAN CHEMICAL: REVENUE SHARE BY REGION, 2020 (%)
FIGURE 29.EASTMAN CHEMICAL: REVENUE SHARE BY CUSTOMER LOCATION, 2020 (%)
FIGURE 30.HONEYWELL: R&D EXPENDITURE, 2017–2019 ($MILLION)
FIGURE 31.HONEYWELL: NET SALES, 2017–2019 ($MILLION)
FIGURE 32.HONEYWELL: REVENUE SHARE BY SEGMENT, 2019 (%)
FIGURE 33.HONEYWELL: REVENUE SHARE BY REGION, 2019 (%)
FIGURE 34.LYONDELLBASELL: R&D EXPENDITURE, 2017–2019 ($MILLION)
FIGURE 35.LYONDELLBASELL: NET SALES, 2017–2019 ($MILLION)
FIGURE 36.LYONDELLBASELL: REVENUE SHARE BY SEGMENT, 2019 (%)
FIGURE 37.LYONDELLBASELL: REVENUE SHARE BY PRODUCT, 2019 (%)
FIGURE 38.LYONDELLBASELL: REVENUE SHARE BY REGION, 2019 (%)
FIGURE 39.SHELL: R&D EXPENDITURE, 2018–2020 ($MILLION)
FIGURE 40.SHELL: NET SALES, 2018–2020 ($MILLION)
FIGURE 41.SHELL: REVENUE SHARE BY SEGMENT, 2020 (%)
FIGURE 42.SHELL: REVENUE SHARE BY REGION, 2020 (%)*


According to the perspectives of the CXOs of leading companies, the market is highly regulated because of which companies have to produce degreasers as per solvents allowed in the state. The market has stringent government and health regulation, owing to presence of volatile organic compounds (VoCs). Moreover, the stringent regulations have led to consumer awareness regarding disadvantages of solvents-based degreasers and increased the demand for water-based degreasers, which drive the market growth.


PURCHASE OPTIONS

Call or Email us

U.S.-Canada Toll-free: +1-800-792-5285
Int'l : +1-503-894-6022
Europe : +44-845-528-1300
Email : help@alliedmarketresearch.com
 
FREQUENTLY ASKED QUESTIONS?

A. Increased average age of vehicles and increased demand for water-based degreasers are factors boosting the California industrial degreasing solvents market growth.

A. The market value of California Industrial Degreasing Solvents is $7.1 Million in 2019.

A. BASF SE, RB Products, Inc., Royal Dutch Shell Plc, Wego Chemical Group, LyondellBasell Industries N.V., Dow Inc., Arkema, and Eastman Chemical Company.

A. Automotive Repair and Maintenance and Electrons industries are some of the industry projected to increase the demand for Industrial Degreasing Solvents Market in California.

A. Product and end-use industry are the segments cleared in the California industrial degreasing solvents market report.

A. The increased consumer awareness regarding disadvantages of solvents-based degreasers is boosting the demand for water-based degreasers. This is one of the drivers of the California Industrial Degreasing Solvents Market

A. Increasing electronic industry is expected to drive the adoption of industrial degreasers in California

Looking for Customization?

 Customization Request

Have a Question?

 Speak with Analyst

Any Confusion?

 Inquire Before Buying

Have a glance of the Report

  Request Sample
RELATED TAGS

Purchase Full Report of
California Industrial Degreasing Solvents Market

Start reading instantly.
This Report and over 66,804+ more Reports, Available with Avenue Library. T&C*.

  • Online Only
  • $7,722
  • Online cloud access only
  • Restricted print, copy, paste & download
  • Read only
  • Free industry update
    (Within 180 days)
  • Free report update in next update cycle
    (Apr 2022 - Apr 2023)
  • Data Pack
  • $8,580
  • Restricted to one authorized user
  • One print only
  • Available in
    Excel
  • Free industry update
    (Within 180 days)
  •   Free report update in next update cycle
    (Apr 2022 - Apr 2023)
  • Single User
  • $12,000
  • Restricted to one authorized user
  • One print only
  • Available in
    PDF
  • Free industry update
    (Within 180 days)
  •   Free report update in next update cycle
    (Apr 2022 - Apr 2023)
  • Five Users
  • $14,413
  • Limited to five authorized users
  • Print upto five copies
  • Available in
    PDF
  • Free industry update
    (Within 180 days)
  •   Free report update in next update cycle
    (Apr 2022 - Apr 2023)
  • Enterprise
    License/PDF

  • $21,100
  • Unlimited
    within
    company/enterprise
  • Available in Excel & PDF
  • Free industry update
    (Within 180 days)
  •   Free report update in next update cycle
    (Apr 2022 - Apr 2023)
  • Library
    Membership

  • $999 $ 1,175
    Per User/ Per month/ Billed annually
  • Published Content
    E-access
  • Company Profiles
    E-access
  • Newly Added Content Access
  • 10 PDF
    Downloads
  • 5 Excel Data
    Pack Downloads
  • 250 Company Profiles PDF Downloads
  • Buy Now

*Taxes/Fees, if applicable will be added during checkout. All prices in USD

RELATED REPORTS
 

Why Allied Market Research?


Infallible Methodology

To ensure high-level data integrity, accurate analysis, and impeccable forecasts

Analyst Support

For complete satisfaction

Customization

On-demand customization of scope of the report to exactly meet your needs

TARGETED MARKET VIEW

Targeted market view to provide pertinent information and save time of readers

Get fresh content delivered

Get insights on topics that are crucial for your business. Stay abreast of your interest areas.

Get Industry Data Alerts

Why Allied Market Research?

Infallible Methodology

To ensure high-level data integrity, accurate analysis, and impeccable forecasts

Analyst Support

For complete satisfaction

Customization

On-demand customization of scope of the report to exactly meet your needs

TARGETED MARKET VIEW

Targeted market view to provide pertinent information and save time of readers