Cancer Supportive Care Drugs Market Research, 2032
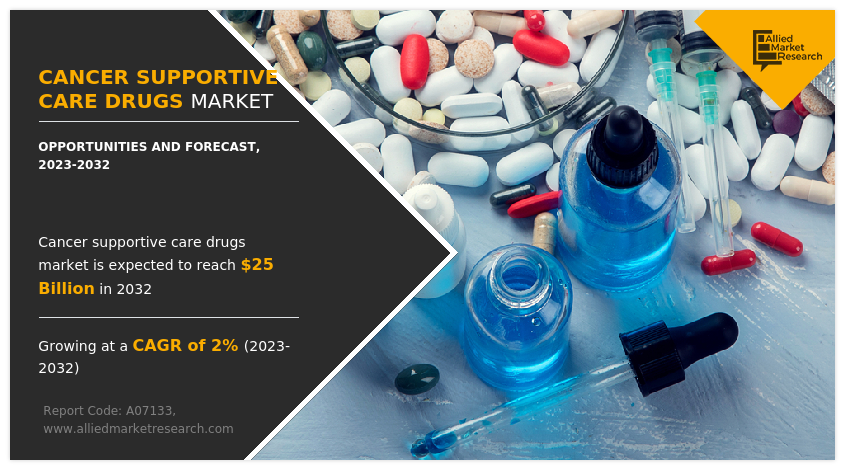
The global cancer supportive care drugs market was valued at $20.4 billion in 2022, and is projected to reach $25 billion by 2032, growing at a CAGR of 2% from 2023 to 2032. The escalating prevalence of cancer necessitates chemotherapy, intensifying its associated adverse effects and propelling the cancer supportive care drugs market. For instance, the American Cancer Society in 2023, stated that 10% of people were living with metastatic colorectal cancer in the U.S., in 2022. Chemotherapy, while targeting fast-growing cells, induces side effects by affecting healthy cells, leading to complications such as anemia and hair loss. Supportive care drugs become pivotal in managing these side effects, facilitating more comfortable cancer treatment. With potential limitations in prescribed treatments due to adverse effects, the demand for supportive drugs addressing issues such as anemia and pain surges, ensures optimal treatment outcomes amid the rising cancer incidence.
Key Takeaways
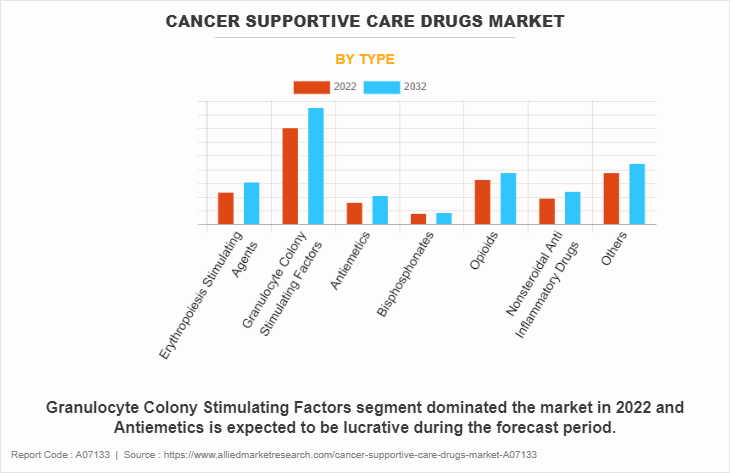
- On the basis of type, the granulocyte colony-stimulating factors (G-CSFs) segment dominated the market in terms of revenue in 2022. However, the antiemetics segment is anticipated to grow at the fastest CAGR during the forecast period.
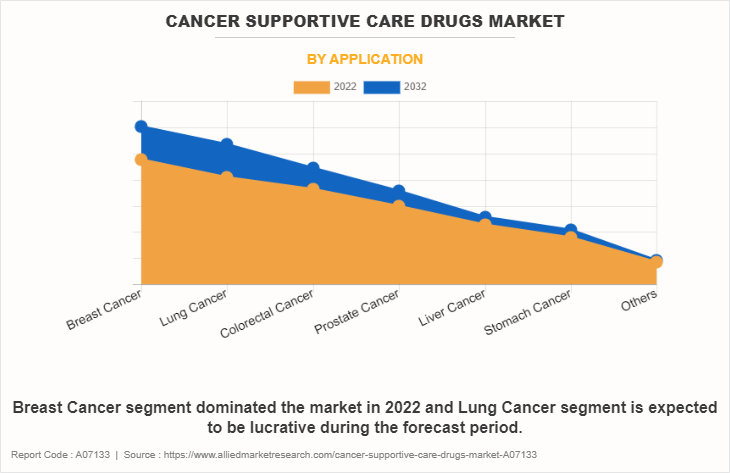
- On the basis of type, the breast cancer segment dominated the market in terms of revenue in 2022. However, the lung cancer segment is anticipated to grow at the fastest CAGR during the forecast period.
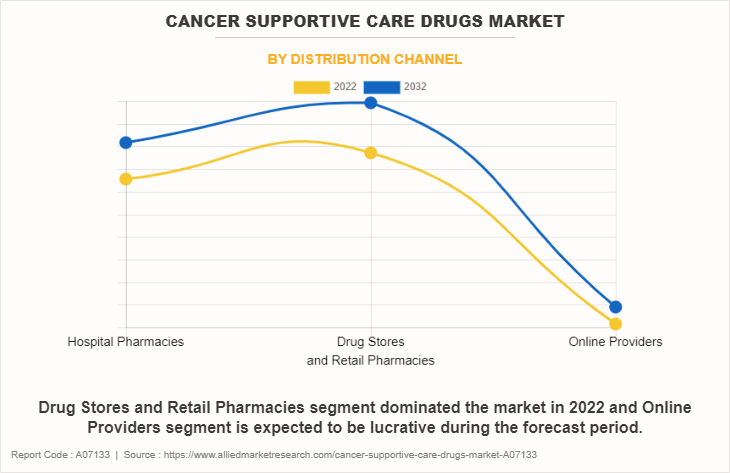
- On the basis of distribution channel, the drug stores and retail pharmacies segment dominated the market in terms of revenue in 2022. However, the online providers segment is anticipated to grow at the fastest CAGR during the forecast period.
- Region wise, North America generated the largest revenue in 2022. However, Asia-Pacific is anticipated to grow at the highest CAGR during the forecast period.
Cancer supportive care drugs are medications designed to manage symptoms and side effects of cancer and its treatments, enhancing patients' quality of life. These drugs address issues such as pain, nausea, fatigue, and infections, offering relief and supporting overall well-being during cancer therapy. They play a crucial role in mitigating treatment-related challenges, allowing individuals to better tolerate and adhere to their cancer treatments while minimizing the impact of adverse effects on their daily lives.
Market Dynamics
The growing geriatric population, coupled with a shift toward patient-centric care, is driving substantial growth in the cancer supportive care drugs market. As the elderly demographic, which is more susceptible to cancer, expands, the demand for cancer supportive care drugs rises. Patient-centric care emphasizes holistic well-being, necessitating effective supportive therapies to enhance the quality of life during cancer treatment. This paradigm shift aligns with the needs of the aging population, fostering increased adoption of supportive care drugs. The market responds by developing targeted solutions, meeting the unique requirements of elderly patients, thus propelling cancer supportive care drugs market growth through the convergence of demographic trends and a patient-centric approach to healthcare.
However, the stringent regulatory frameworks hinder the timely approval and commercialization of new drugs. Stringent regulatory processes often involve rigorous scrutiny, leading to prolonged timelines for drug development, approval, and market entry. Compliance with complex regulatory requirements poses challenges for pharmaceutical companies, impacting their ability to introduce innovative and potentially more effective supportive care drugs swiftly. Delays in regulatory approvals can restrain the market's growth by limiting the availability of advanced therapies, ultimately affecting the timely and improved management of side effects associated with cancer treatments.
Global recession poses a threat to the progress of clinical trials, crucial for advancing cancer drugs, potentially causing delays or cancellations, and hindering market growth. The ongoing economic downturn, affecting pharmaceutical and biotech industries, leads to reduced funding and fluctuating demand for cancer drugs as companies adjust spending. According to the International Monetary Fund, advanced economies are expected to slow in 2023. Despite challenges, the cancer supportive care drugs market can persevere through personalized medicine adoption, cell research advancements, and a rising cancer incidence. Overcoming economic constraints requires collaborative efforts, innovative pricing strategies, and advocacy for increased healthcare budgets. Thus, the impact of the recession on the cancer supportive care drugs market is moderate, with potential for resilience through strategic measures in navigating the complex economic landscape.
Segmental Overview
The cancer supportive care drugs market is segmented on the basis of type, application, distribution channel, and region to provide a detailed assessment of the market. By type, it is segmented into erythropoiesis-stimulating agents (ESA), granulocyte colony-stimulating factors (G-CSFs), antiemetics, bisphosphonates, opioids, NSAIDs (non-steroidal anti-inflammatory drugs), and others. On the basis of application, the market is categorized into breast cancer, lung cancer, colorectal cancer, prostate cancer, liver cancer, stomach cancer, and others. Depending on distribution channel, the market is fragmented into hospital pharmacies, drug stores & retail pharmacies, and online providers. Region-wise, the market is analyzed across North America (U.S., Canada, and Mexico), Europe (Germany, France, the UK, Italy, Spain, and rest of Europe), Asia-Pacific (China, Japan, India, Australia, South Korea, and rest of Asia-Pacific), and LAMEA (Brazil, Saudi Arabia, South Africa, and rest of LAMEA).
By Type
The cancer supportive care drugs market is segmented into erythropoiesis-stimulating agents (ESA), granulocyte colony-stimulating factors (G-CSFs), antiemetics, bisphosphonates, opioids, NSAIDs (non-steroidal anti-inflammatory drugs), and others. The granulocyte colony-stimulating factors (G-CSFs) segment accounted for the largest cancer supportive care drugs market size in terms of revenue in 2022 and is expected to maintain its lead during the forecast period. The Vital function of G-CSFs is supporting cancer patients by stimulating the production of white blood cells, thereby aiding in the prevention of infections during chemotherapy and driving the segment growth.
However, the antiemetics segment is expected to register the fastest CAGR in the forecast period. Antiemetics significantly enhance the quality of life for patients undergoing chemotherapy. The rising demand for effective nausea and vomiting control is expected to drive the rapid growth of the antiemetics segment in the cancer supportive care drugs market.
By Application
The cancer supportive care drugs market is segmented into breast cancer, lung cancer, colorectal cancer, prostate cancer, liver cancer, stomach cancer and others. The breast cancer segment accounted for the largest cancer supportive care drugs market size in terms of revenue in 2022 and is expected to maintain its lead during the forecast period. The surge in breast cancer prevalence and rise in adoption of diverse treatments, often accompanied by side effects, contribute to a rising demand for cancer support care drugs.
However, the lung cancer segment is expected to register the fastest CAGR in the forecast period. The escalating prevalence of lung cancer and the increased adoption of diverse treatments have led to a surge in lung cancer cases, intensifying the demand for supportive care interventions. As awareness about the importance of comprehensive and effective supportive care grows and treatment options expand, there is an imperative need to address the unique challenges associated with lung cancer. This drive is essential for enhancing the overall quality of life for individuals affected by lung cancer, emphasizing the critical role of supportive care in managing the complexities of the disease and its treatments.
By Distribution Channel
The cancer supportive care drugs market is segmented into hospital pharmacies, drug stores & retail pharmacies, and online providers. The drug stores & retail pharmacies segment accounted for the largest cancer supportive care drugs market share in terms of revenue in 2022 and is expected to maintain its lead during the forecast period. This is attributed to various factors, notably the convenience and widespread accessibility offered by these establishments. The ubiquitous presence of drug stores and retail pharmacies enhances patients' convenience, fostering their preference for these outlets.
However, the online providers segment is expected to exhibit the fastest CAGR during the forecast period. This is primarily due to the convenience and accessibility offered by digital platforms, enabling a broader outreach to diverse audiences. The surge in e-commerce and telehealth technologies amplifies the importance of online providers in the cancer supportive care drugs market forecast.
By Region
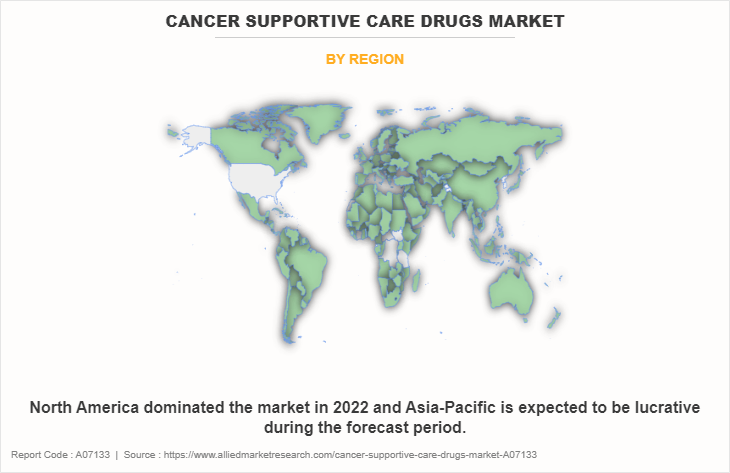
The market is analyzed across North America, Europe, Asia-Pacific, and LAMEA. North America accounted for the largest cancer supportive care drugs market share in terms of revenue in 2022 owing to several key factors including growing access to advanced medical technologies and a well-developed network of healthcare facilities. Additionally, the growth in aging population and high incidence of cancer conditions contribute to the sustained demand for cancer supportive care drugs products. Further, North America is also home to several leading pharmaceutical manufacturers, driving innovation and product availability, making it a pivotal region for cancer supportive care drugs revenue growth.
However, the Asia-Pacific region is projected to exhibit the highest CAGR in the cancer supportive care drugs market during the forecast period. This growth can be attributed to multiple factors, including the rising geriatric population and the increased prevalence of cancer disorders in the region. Furthermore, ongoing enhancements in healthcare infrastructure and a surge in initiatives aimed at raising awareness and facilitating cancer supportive care drugs use are anticipated to drive market expansion in the Asia-Pacific. These factors collectively create a favorable environment for the growth of cancer supportive care drugs market opportunity in the region.
Furthermore, a rise in research activities as well as the well-established presence of domestic companies in the region are expected to provide notable opportunities for market growth. In addition, a rise in contract manufacturing organizations within the region is expected to drive the market growth.
Competition Analysis
Competitive analysis and profiles of the major players in the cancer supportive care drugs market include Novartis AG, Johnson & Johnson, Amgen Inc., Baxter International Inc., F. Hoffmann-La Roche AG, Helsinn Healthcare SA, Heron Therapeutics, Inc., Merck & Co., Inc., Teva Pharmaceutical Industries Ltd., and Pfizer Inc. The key players have adopted strategies such as agreement and product approval to expand their product portfolio.
Recent Developments in the Cancer Supportive Care Drugs Industry
- In January 2023, Helsinn Group, and Immedica Pharma AB, a pharmaceutical company focused on the commercialization of rare and specialty care products, announced that they have entered an exclusive long-term license and distribution agreement for two cancer supportive care products indicated for the prevention of chemotherapy-induced nausea and vomiting (CINV) in core European markets: AKYNZEO (Netupitant-Palonosetron fixed combination) and ALOXI (Palonosetron).
- In December 2020, McKesson and Amgen Inc., one of the world’s leading biotechnology companies, have signed a strategic agreement to help improve cancer care in community oncology settings. This multi-year agreement bridges the power and reach of the two companies and will focus on reducing gaps in care by optimizing access to innovative precision medicine and immuno-oncology in the community setting.
- In November 2020, Pfizer Inc. announced that the European Commission (EC) has approved NYVEPRIA (pegfilgrastim). It is indicated to reduce the duration of neutropenia and the incidence of febrile neutropenia in adult patients treated with cytotoxic chemotherapy for malignancy (except for chronic myeloid leukemia and myelodysplastic syndromes).
Key Benefits for Stakeholders
- This report provides a quantitative analysis of the market segments, current trends, estimations, and dynamics of the cancer supportive care drugs market analysis from 2022 to 2032 to identify the prevailing cancer supportive care drugs market opportunities.
- The market research is offered along with information related to key drivers, restraints, and opportunities.
- Porter's five forces analysis highlights the potency of buyers and suppliers to enable stakeholders make profit-oriented business decisions and strengthen their supplier-buyer network.
- In-depth analysis of the cancer supportive care drugs industry segmentation assists to determine the prevailing market opportunities.
- Major countries in each region are mapped according to their revenue contribution to the global market.
- Market player positioning facilitates benchmarking and provides a clear understanding of the present position of the market players.
- The report includes the analysis of the regional as well as global cancer supportive care drugs market trends, key players, market segments, application areas, and market growth strategies.
Cancer Supportive Care Drugs Market Report Highlights
| Aspects | Details |
| Market Size By 2032 | USD 25 billion |
| Growth Rate | CAGR of 2% |
| Forecast period | 2022 - 2032 |
| Report Pages | 338 |
| By Type |
|
| By Application |
|
| By Distribution Channel |
|
| By Region |
|
| Key Market Players | Baxter International Inc., Teva Pharmaceutical Industries Ltd., Novartis AG, Heron Therapeutics, Inc., F. Hoffmann-La Roche AG, Amgen Inc., Helsinn Healthcare SA, Johnson & Johnson, Pfizer Inc., Merck & Co., Inc. |
Analyst Review
This section provides various opinions of top-level CXOs in the global cancer supportive care drugs market.
According to the insights of CXOs, upsurge in the number of patients suffering from cancer conditions and the
rise in adoption of cancer supportive care drugs are expected to offer profitable opportunities for the expansion
of the market.
CXOs further added that the presence of key players and the growth in adoption of various strategies and focus
on research and development are further anticipated to drive the market growth. In addition, the technological
advancements in enhancing delivery, and effectiveness of supportive care interventions are further contributing
to the market growth.
North America had the highest market share in 2022 and is expected to maintain its lead during the forecast
period, owing to the availability of improved facilities and rise in adoption of cancer supportive care drugs in
treatment. However, Asia-Pacific is expected to exhibit the fastest growth during the forecast period, owing to
high population base, rise in cancer cases, and the surge in healthcare expenditure.
Cancer supportive care drugs are medications designed to manage the side effects of cancer treatments, such as chemotherapy or radiation therapy. These drugs aim to alleviate symptoms such as nausea, pain, anemia, and immune suppression, enhancing patients' well-being and improving their overall quality of life during and after cancer treatment.
The major factor that fuels the growth of the cancer supportive care drugs market are rise in prevalence of cancer and adverse effects associated with use of cancer drugs, increase in adoption of cancer supportive care drugs and growth in geriatric population drive the growth of the global cancer supportive care drugs market .
The granulocyte colony-stimulating factors (G-CSFs) segment is the most influencing segment in cancer supportive care drugs market .This is attributed to the widespread use and diverse applications of human serum cancer supportive care drugs in various medical interventions. As a critical component of blood plasma, human serum cancer supportive care drugs finds extensive utilization in therapeutic treatments, including fluid resuscitation, wound healing, and the management of hypocancer supportive care drugsemia.
Top companies such as Amgen Inc, Pfizer Inc., Novartis AG, and Teva Pharmaceutical Industries Ltd. held a high market position in 2022. These key players held a high market postion owing to the strong geographical foothold in North America, Europe, Asia-Pacific, and LAMEA.
The base year is 2022 in cancer supportive care drugs market .
The market value of cancer supportive care drugs market in 2032 is $24,979.20 million
The forecast period for cancer supportive care drugs market is 2023 to 2032
The total market value of cancer supportive care drugs market is $20,389.69 million in 2022.
Loading Table Of Content...
Loading Research Methodology...


