 Market")
Carbon Capture, Utilization, and Storage Market Overview
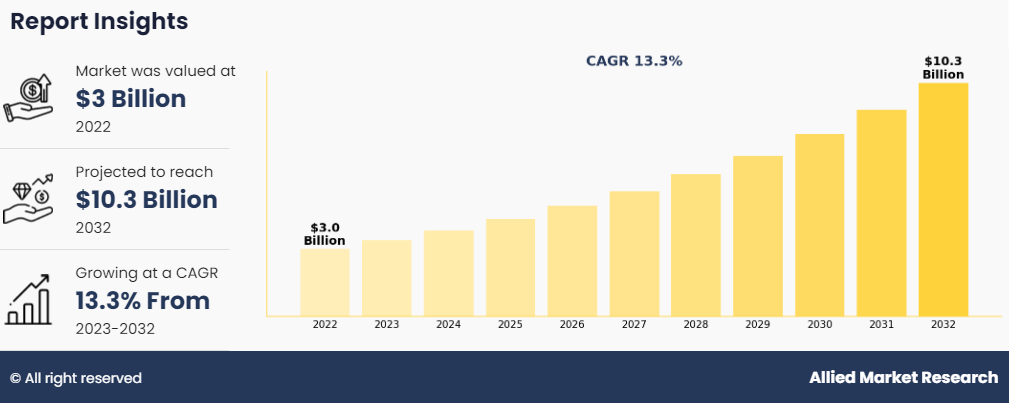
The global carbon capture, utilization, and storage (CCUS) market was valued at USD 3 billion in 2022, and is projected to reach USD 10.3 billion by 2032, growing at a CAGR of 13.3% from 2023 to 2032.
The carbon capture, utilization, and storage market is expanding due to global efforts to reduce CO2 emissions, government initiatives, and increasing demand for CO2-EOR techniques. Technological advancements are also driving offshore oil and gas exploration, promoting gas injection enhanced oil recovery (EOR) techniques, which use carbon dioxide for crude oil extraction. However, the high cost of carbon capture and storage and decreasing crude oil prices may hinder market growth. However, upcoming projects in Asia-Pacific and Europe and ongoing investments in innovative technologies are expected to provide growth opportunities for market expansion.
What is the role of CCUS in reducing carbon emissions
Carbon capture, utilization, and storage (CCUS) is the process of capturing carbon dioxide from fuel combustion or industrial processes, the transport of this CO2 via ship or pipeline, and either its use as a resource to create valuable products or services or its permanent storage deep underground in geological formations. CCUS technologies provide the foundation for carbon removal or "negative emissions" when the CO2 comes from bio-based processes or directly from the atmosphere.
Key Takeaways
- The carbon capture, utilization, and storage (CCUS) market is highly fragmented, with several players including Royal Dutch Shell PLC, Fluor Corporation, Mitsubishi Heavy Industries, Ltd., Linde Plc, Exxon Mobil Corporation, JGC Holdings Corporation, Schlumberger Limited, Aker Solutions, Honeywell International Inc., and Halliburton.
- More than 6,765 product literatures, carbon capture, utilization, and storage (CCUS) industry releases, annual reports, and other such documents of major industry participants along with authentic industry journals, trade associations' releases, and government websites have been reviewed for generating high-value CCUS industry insights.
- The study also analyse the patent related to carbon, capture, utlization, and storage technology with respect to each country.
- The study covers more than 20 countries in terms of value during the forecast period 2022-2032 is covered in the carbon capture, utilization, and storage (CCUS) market report.
Market Dynamics
The growth of the carbon capture, utilization, and storage (CCUS) market is primarily driven by a growing focus on reducing CO2 emissions, supporting government initiatives toward reducing CO2 emissions, and increasing demand for CO2-EOR techniques. In addition, rapid industrialization across the globe has led to surge in the emission of CO2. To reduce carbon footprint, governments of various developed and developing countries such as the U.S., the Netherlands, the UK, China, and India are setting up large numbers of CO2 capture and storage plants, which is expected to drive the growth of the market during the carbon capture, utilization, and storage (CCUS) market forecast period.
In addition, with technological advancements, offshore oil & gas exploration & production activities are increasing, which, in turn, is surging the adoption of gas injection enhanced oil recovery (EOR) techniques. This includes the use of carbon dioxide for crude oil extraction. Maturing and depleting oil reserves are expected to fuel the adoption of gas injection EOR techniques for both onshore and offshore wells. Hence, this growing demand for CO2 for EOR activities from the oil & gas industry is expected to drive the growth of the carbon capture, utilization, and storage (CCUS) market during the forecast period.
However, inflated cost of carbon capture and storage and decreasing crude oil prices are expected to hamper the carbon capture, utilization, and storage (CCUS) market growth. On the contrary, a large number of upcoming projects in Asia-Pacific and Europe and continuous investments in developing innovative capturing technologies enabling economic operations are expected to provide growth opportunities for the expansion of the market during the forecast period.
CCUS Market Segment Review:
The global carbon capture, utilization, and storage market is segmented into service, technology, application, and region. By service, the market is segregated into capture, transportation, utilization, and storage. Depending on technology, it is categorized into pre-combustion capture, oxy-fuel combustion capture, and post-combustion capture. On the basis of application, it is divided into oil & gas, power generation, iron & steel, chemical & petrochemical, cement, and others. Region wise, it is studied across North America, Europe, Asia-Pacific, and LAMEA.
Global CCUS Market By Technology
The post-combustion capture segment was the major share contributor in 2022. Post-combustion capture refers to the separation of CO2 from flue gas derived from combusting fossil fuels—coal, natural gas, or oil. Power consumption has been growing at a significant rate in developing economies such as China and India driven by industrialization, population growth, and growing urbanization. In China, in 2022, the power generated from coal accounted to 4,732 TWh, up from the previous year’s 4,445 TWh. Coal power generation holds a 66% share of China’s overall energy mix. In China and India, which have accounted for 85% of new coal power capacity since 2005, the number of permits for new coal plants dropped to record lows, but new plants are still in the pipeline. Therefore, increase in power needs in these countries are expected to increase the number of coal-fired power generation plants during the forecast period, which eventually will escalate the adoption of post-combustion carbon capture technology in the coming years.
 Market by Technology")
Global CCUS Market By Application
The oil & gas industry was the major share contributor in 2022, as the CCUS process is aiding the oil & gas industry to mitigate the emission of greenhouse gases. Carbon dioxide stored in deep, onshore, or offshore geological formations uses CCUS technologies for enhanced oil recovery that have been developed in the oil & gas industry. In other circumstances, carbon dioxide is not soluble in oil. Here, the injection of carbon dioxide raises the pressure in the reservoir, helping to sweep the oil toward the production well. In Texas (U.S.), for more than three decades carbon dioxide has been used in enhanced oil recovery projects, enhanced oil recovery (EOR) constitutes over 20.0% of total oil production, and some fields achieve recoveries of nearly 70.0%. Kyoto Clean Development Mechanism is mostly applied among the OPEC Nations, which support CCUS technology. For instance, Abu Dhabi National Oil Company achieved dramatic reductions in gas flaring, from about 1,500 million cubic feet per day in the early 1980s to less than 200 million cubic feet per day today. This decreased air pollution and augmented the gas availability for export or internal use.
 Market by Application")
Global CCUS Market By Service
The capture service segment accounted for a major share in the carbon capture, utilization, and storage market in 2022. This is attributed to the fact that carbon capture is the first stage of the CCUS process and involves capturing CO2 from its emission source. It can be applied to any large-scale emission process, including coal-fired power generation plants; gas and oil production; and manufacturing industries, such as cement, iron, and steel. The cost of capturing CO2 is heavily dependent on technical, economic, and financial factors associated with the design and operation of the production process, along with the design and operation of the CO2 capture technology.
 Market by Service")
Global CCUS Market By Region
North America accounted for a major market share in 2022 owing to surge in demand for clean technology, accompanied by the growing use of CO2 in enhanced oil recovery practices. U.S. uses 75.0% of the global carbon capture capacity in enhanced oil recovery operations, which accounts for nearly 30 metric tons per annum.
The country introduced the FUTURE Act (Furthering Capital Carbon Capture, Utilization, Technology, Underground Storage, and Reduced Emissions) under the 45Q section to provide incentives for capturing carbon dioxide produced from industrial and power sources to be used in enhanced oil recovery. With the development of shale gas techniques and less interest in carbon capturing by the new government, it is expected that the market for CCUS is anticipated to grow at a moderate rate in the country, thereby increasing the market share of North America in the carbon capture, utilization, and storage market.
 Market by Region")
What are the top carbon capture, utilization, and storage (CCUS) companies
The following are the leading companies in the market. These players have adopted various strategies to increase their market penetration and strengthen their position in the CCUS industry.
Royal Dutch Shell PLC
Fluor Corporation
Mitsubishi Heavy Industries, Ltd.
Linde Plc
Exxon Mobil Corporation
JGC Holdings Corporation
Schlumberger Limited
Aker Solutions
Honeywell International Inc.
Halliburton
C-Capture Ltd.
Tandem Technical
Carbicrete
Hitachi, Ltd.
Siemens AG
General Electric
Total S.A.
Equinor ASA
What are the Recent Developments in the CCUS Market
Royal Dutch Shell PLC actively advocates for policies driving the deployment of carbon capture, utilization, and storage (CCUS) at scale, supporting strong government incentives and streamlined permitting processes. They are actively developing CCUS hubs globally to aggregate CO2‚ emissions from industrial sources for centralized storage, thereby contributing to significant reductions in greenhouse gas emissions. Collaborating with industry partners, Shell aims to decarbonize hard-to-abate sectors and accelerate the transition to a low-carbon economy.
Fluor Corporation plays a crucial role in advising clients on commercialized CCUS technologies, focusing on applications such as hydrogen and ammonia production. Their expertise in large-scale projects and innovative methods, like mineralizing CO2, demonstrates a commitment to advancing carbon capture solutions. By leveraging their knowledge and experience, Fluor contributes to the development and deployment of CCUS technologies across various industries, thereby facilitating the transition to a more sustainable energy future.
Mitsubishi Heavy Industries, Ltd. (MHI) is at the forefront of developing and deploying carbon capture technologies globally. Collaborating with partners like ExxonMobil, MHI is advancing the deployment of CO2‚ capture technology as part of end-to-end CCS solutions. Additionally, MHI licenses its carbon capture technology for projects worldwide, contributing to efforts to reduce emissions and combat climate change. With a focus on innovation and sustainability, MHI plays a pivotal role in driving the adoption of CCUS technologies across industries.
Linde Plc is actively collaborating with partners like SLB to accelerate the deployment of carbon capture and storage (CCUS) projects, particularly in the hydrogen and ammonia production sectors. Through their collaboration, Linde aims to reduce emissions and create low-carbon energy sources and products. By leveraging their expertise in gas processing and technology solutions, Linde contributes to the development of sustainable energy solutions, thereby supporting global efforts to mitigate climate change and transition to a low-carbon economy.
Exxon Mobil Corporation is committed to developing comprehensive carbon capture solutions in collaboration with partners like Mitsubishi Heavy Industries. Their end-to-end CCS solution for industrial customers demonstrates ExxonMobil's dedication to reducing emissions and addressing climate change. With extensive experience in capturing and transporting CO2, ExxonMobil plays a critical role in advancing post-combustion CO2‚ capture technology and accelerating the deployment of CCUS solutions worldwide, thereby contributing to global efforts to achieve a more sustainable energy future.
Key Benefits for Stakeholders
This report provides a quantitative analysis of the carbon capture, utilization, and storage (CCUS) market overview, segments, current trends, estimations, and dynamics of the carbon capture, utilization, and storage (CCUS) market analysis from 2022 to 2032 to identify the prevailing carbon capture, utilization, and storage (CCUS) market opportunities.
The market research is offered along with information related to key drivers, restraints, and opportunities.
Porter's five forces analysis highlights the potency of buyers and suppliers to enable stakeholders make profit-oriented business decisions and strengthen their supplier-buyer network.
In-depth analysis of the carbon capture, utilization, and storage (CCUS) market segmentation assists to determine the prevailing market opportunities.
Major countries in each region are mapped according to their revenue contribution to the global CCUS market.
Market player positioning facilitates benchmarking and provides a clear understanding of the present position of the market players.
The report includes the analysis of the regional as well as global carbon capture, utilization, and storage (CCUS) market trends, key players, market segments, application areas, and market growth strategies.
Carbon Capture, Utilization, and Storage (CCUS) Market Report Highlights
| Aspects | Details |
| Market Size By 2032 | USD 10.3 billion |
| Growth Rate | CAGR of 13.3% |
| Forecast period | 2022 - 2032 |
| Report Pages | 210 |
| By Technology |
|
| By Application |
|
| By Service |
|
| By Region |
|
| Key Market Players | Exxon Mobil Corporation, Linde PLC, Halliburton Company, Aker Solutions, Honeywell International Inc., Royal Dutch Shell PLC, Fluor Corporation, Schlumberger Limited, Mitsubishi Heavy Industries, Ltd., JGC HOLDINGS CORPORATION |
Analyst Review
According to the analyst, the global carbon capture, utilization, and storage market is anticipated to witness notable growth during the forecast period, driven by the rising industrialization rate coupled with increasing investment in manufacturing facilities. Various governmental strategies to decrease greenhouse gas emissions in many industries are expected to support the demand for carbon capture, utilization, and storage. In addition, the improved oilfield recovery plans release carbon dioxide when the machine is in process. This released carbon dioxide requires being stored, thus driving the carbon capture, utilization, and storage market. Moreover, increasing energy demands, coupled with rising investment toward the upstream & downstream sectors, is expected to improve the market outlook. Furthermore, serious concern about the increasing CO2 emission and the rising energy demands among the management and societies eventually drive the market growth. Furthermore, the rising adoption of highly efficient power generation cycles along with technological improvements in the field is feeding industry development.
However, high cost of carbon capture and storage and decreasing crude oil prices are expected to hamper the growth of the CCUS market during the forecast period. Furthermore, a large number of upcoming projects in Asia-Pacific and Europe and continuous investments in developing innovative capturing technologies enabling economic operations are expected to provide growth opportunities for the market during the forecast period.
$10.3 billion is the estimated industry size of Carbon Capture, Utilization, and Storage Market during the forecast period.
Government support and policies, technological advancements, Increasing Investments, integration with renewable energy, and industrial applications are the upcoming trends of Carbon Capture, Utilization, and Storage (CCUS) Market in the world.
Oil and Gas is the leading application of Carbon Capture, Utilization, and Storage Market.
North America is the largest regional market for Carbon Capture, Utilization, and Storage (CCUS) Market during the forecast period.
Royal Dutch Shell PLC, Fluor Corporation, Mitsubishi Heavy Industries, Ltd, Linde Plc, and Exxon Mobil Corporation are the top companies to hold the market share in Carbon Capture, Utilization, and Storage (CCUS).
Loading Table Of Content...
Loading Research Methodology...

