0
New
New
2023
Carbon Fiber Market

Carbon Fiber Market

by Type (Continuous carbon fiber, Long carbon fiber, Short carbon fiber), by Raw Material (PAN-Based carbon fiber, Pitch-Based and Rayon-Based carbon fiber), by Form (Composite carbon fiber, Non-Composite carbon fiber), by End Use Industry (Aerospace amd Dfense, Sports/Leisure, Wind Turbines, Molding and Compounds, Automotive, Pressure Vessels, Civil Engineering, Marine, Pultrusion Misc., Misc. Consumer, Sailing/Yacht Building, Others): Global Opportunity Analysis and Industry Forecast, 2023-2032

Report Code: A01613
Jul 2023 | Pages: 446
Tables: 276
Charts: 83
  • Formats*:

  • pdf

    Single User License, Five User
    License & Enterprise User License

  • xls

    Data Pack Excel License

  • ppt

    It comes with the additional cost
    of $2500.00 contact sales.


Carbon Fiber Market Research, 2032

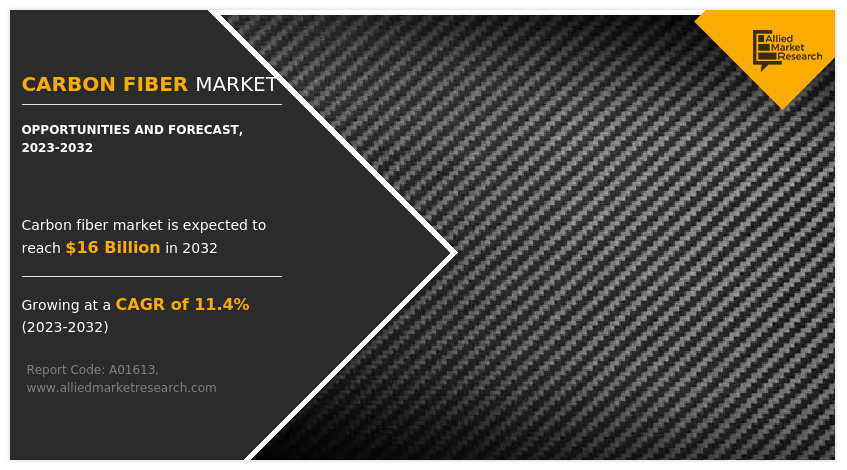
The global carbon fiber market was valued at $5.5 billion in 2022, and is projected to reach $16.0 billion by 2032, growing at a CAGR of 11.4% from 2023 to 2032.

Key Market insight:

  • The report outlines the current carbon fiber market trends and future scenario of the market from 2022 to 2032 to understand the prevailing opportunities and potential investment pockets.
  • The global carbon fiber market has been analyzed in terms of value ($ Billion) and volume (Kilotons). The analysis in the report is provided on the basis of raw material, type, form, end-use industry,  4 major regions, and more than 15 countries.
  • The carbon fiber market is fragmented  in nature with few players such as, DowAksa Advanced Composites Holding B.V, Formosa Europe, Solvay, TORAY INDUSTRIES, INC., Nippon Steel Corporation, Mitsubishi Chemical Group Corporation, SGL Carbon, Hyosung Co Public, Teijin Limited, and ZOLTEK which hold significant share of the market.
  • The report proivdes strategy planning and industry dynamics to enhance decision making for existing market players and new entrants entering the carbon fiber market.
  • Countries such as China, U.S., India, Germany, and Brazil hold a significant share in the global  carbon fiber market.

As the world becomes more conscious of environmental issues, there is a growing demand for sustainable materials. Carbon fiber's lightweight nature and potential for reducing emissions in transportation and other industries have made it an attractive option for environmentally conscious companies which in turn led to rise in the production of carbon fiber in the coming years.

Carbon Fiber Market

Carbon fiber is a lightweight and extremely strong material known for its high tensile strength and low weight-to-strength ratio. It is composed of thin strands of carbon atoms bonded together in a crystalline arrangement. These fibers are woven together to form a composite material, which is reinforced with a polymer matrix (such as epoxy) to create the final product.

The production of carbon fiber involves several steps. Initially, precursor materials, such as polyacrylonitrile (PAN) fibers or pitch fibers, are subjected to high temperatures in an oxygen-free environment to carbonize them. This process eliminates non-carbon elements and aligns the carbon atoms into tightly bonded structures.

Expansion of automotive industry is projected to boost the carbon fiber market

The automotive industry increasingly uses carbon fiber to reduce vehicle weight and improve fuel efficiency. Carbon fiber components help to enhance performance, safety, and overall design aesthetics in high-end sports cars and electric vehicles. d. This factor is anticipated to drive the market during the forecast period.

Challenging and energy intensive process of carbon fiber is projected to restrain the market growth

However, recycling carbon fiber composites is more challenging compared to traditional materials. The separation of carbon fibers from the polymer matrix is anticipated to be a complex and energy-intensive process. Proper recycling methods and infrastructure are still being developed to address the issue of carbon fiber waste and to improve sustainability in the industry. This factor is projected to restrain market growth.

Emergence of renewable energy sector has enhanced the potential sales of carbon fiber market

The renewable energy sector, particularly wind energy, provides a significant opportunity for carbon fiber. Wind turbine blades, which require strength, stiffness, and fatigue resistance, is projected to benefit from the lightweight and high-performance properties of carbon fiber composites. The carbon fiber market is expected to expand in this sector as the demand for renewable energy continues to rise. Furthermore, the use of carbon fiber in infrastructure and construction applications is a developing opportunity.

Carbon fiber reinforcement can strengthen and extend the lifespan of concrete structures, bridges, and buildings. In addition, the lightweight nature of carbon fiber is anticipated to simplify construction processes and reduce transportation costs for large-scale projects. These factors are expected to offer remunerative opportunities for the carbon fiber market during the forecast period.

The carbon fiber market is segmented on the basis of raw material, type, form, end-use industry, and region. On the basis of raw material, the market is bifurcated into PAN-based carbon fiber, and pitch-based & rayon-based carbon fiber. On the basis of type, it is categorized into continuous, long, and short carbon fibers. On the basis of form the market is bifurcated into composite and non-composite carbon fibers. On the basis of end-use industry, the market is fragmented into aerospace & defense, sports/leisure, wind turbines, molding & compounds, automotive, pressure vessels, civil engineering, marine, pultrusion misc., misc. consumer, sailing/yacht building, and others. On the basis of region, the market is studied across North America, Europe, Asia-Pacific, and LAMEA.
Carbon Fiber Market

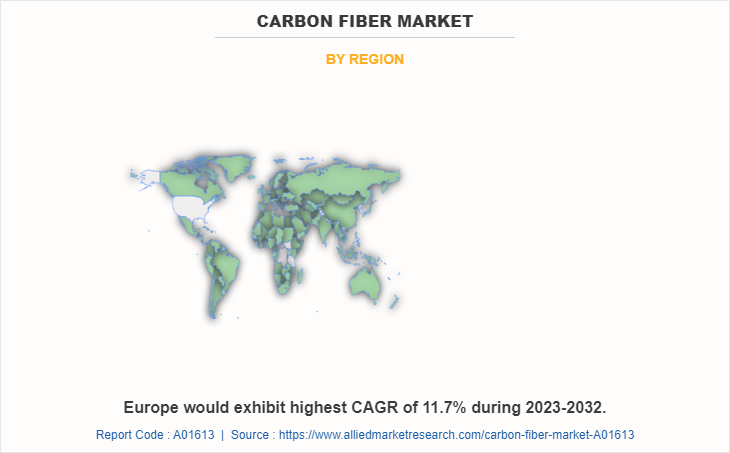
The Europe carbon fiber market size is projected to grow at the highest CAGR of 11.7% during the forecast period and accounted for 36% of carbon fiber market share in 2022. This is due to the fact that, Germany is known for its advanced manufacturing capabilities and technological expertise. The focus of the country on research and development, along with its strong engineering and manufacturing sectors, supports the growth of the carbon fiber market. Advanced manufacturing technologies such as automated fiber placement (AFP) and resin infusion contribute to efficient and cost-effective carbon fiber production in the Europe region. Furthermore, the UK has ongoing infrastructure development projects, including bridges, buildings, and transportation systems.

Carbon fiber composites are utilized in the construction industry for applications such as reinforcing structures, seismic retrofitting, and corrosion-resistant materials. The demand for sustainable and high-performance materials drives the use of carbon fiber in construction sector of the UK. These factors are offering most remunerative opportunities in the European region for carbon fiber market.

Carbon Fiber Market

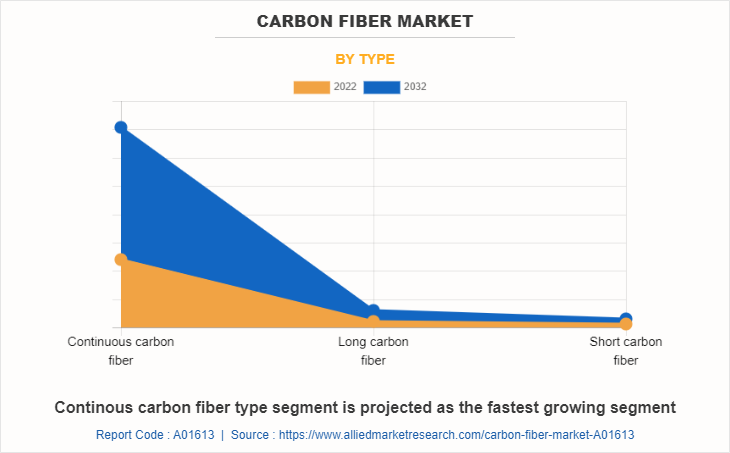
On the basis of type, the continuous carbon fiber segment dominated the global market in 2022 and is anticipated to grow at a CAGR of 11.4% during forecast period. Carbon fibers are inherently resistant to corrosion and chemical attack. This makes them a preferred choice in industries where exposure to harsh environments, such as marine and chemical processing, is common.

Structures reinforced with continuous carbon fiber composites are anticipated to withstand corrosive conditions for extended periods, reducing maintenance and replacement costs. This factor is projected to enhance the demand for continuous carbon fiber segment. Continuous carbon fiber production has benefited from advancements in manufacturing technologies, such as automated fiber placement (AFP) and automated tape laying (ATL). These technologies allow for precise and efficient placement of carbon fibers, enabling cost-effective production and reducing material waste. Continuous carbon fiber composites are expected to contribute to environmental sustainability.

Carbon Fiber Market

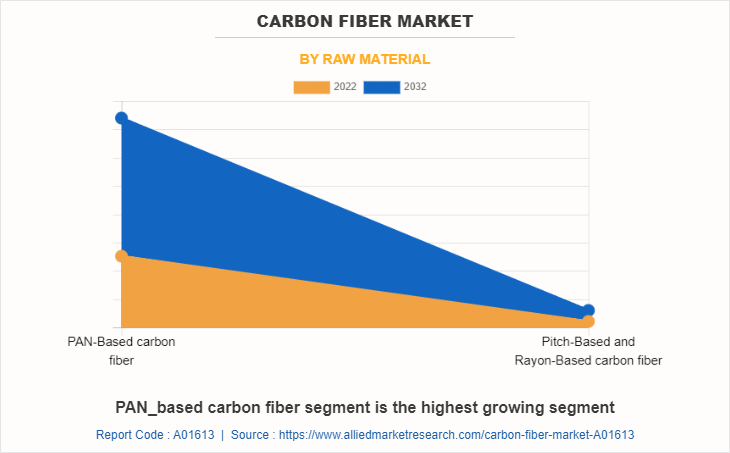
On the basis of raw material, the PAN-based carbon fiber segment dominated the global market in 2022 and is anticipated to grow at a CAGR of 11.4% during forecast period. PAN-based carbon fiber materials are preferred for use in the aerospace industry owing to their high strength, low heat expansion, moisture absorption, lightweight, specific strength, ease of use, and thermal conductivity. There is no significant growth in technology used to manufacture PAN precursors and carbon fibers, and thus there is high scope for improvement in process and product areas. This factor is expected to enhance the overall market demand for PAN-based carbon fiber market.

Carbon Fiber Market

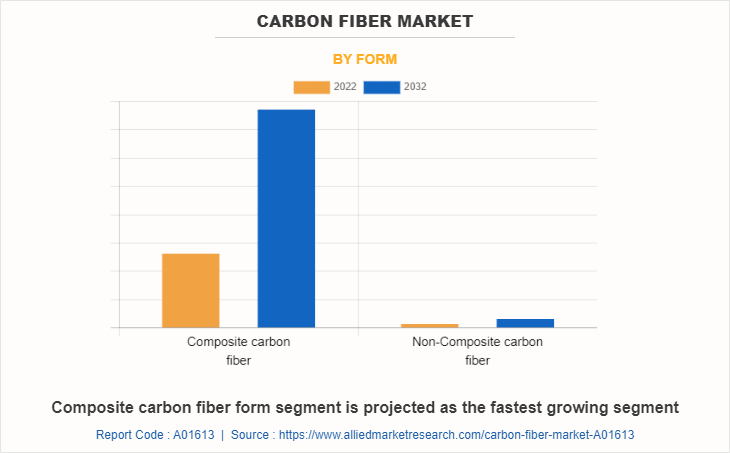
On the basis of form, the composite carbon fiber segment was the largest revenue generator in 2022, and is anticipated to grow at a CAGR of 11.4% during the forecast period. Composite carbon fiber refers to the use of carbon fiber reinforcement in composite materials. It involves combining carbon fibers with a polymer matrix, such as epoxy or thermoplastics, to create a composite material that exhibits enhanced mechanical properties. Carbon fiber is known for its exceptional strength, stiffness, and low weight.

Carbon fibers provide high tensile strength, flexural strength, and impact resistance when used as a reinforcement in composites. They are typically oriented and aligned in specific directions within the matrix to optimize the mechanical properties of the composite material. This factor is projected to boost the sales of carbon fiber market for composite-based carbon fiber segment during the forecast period.

Carbon Fiber Market

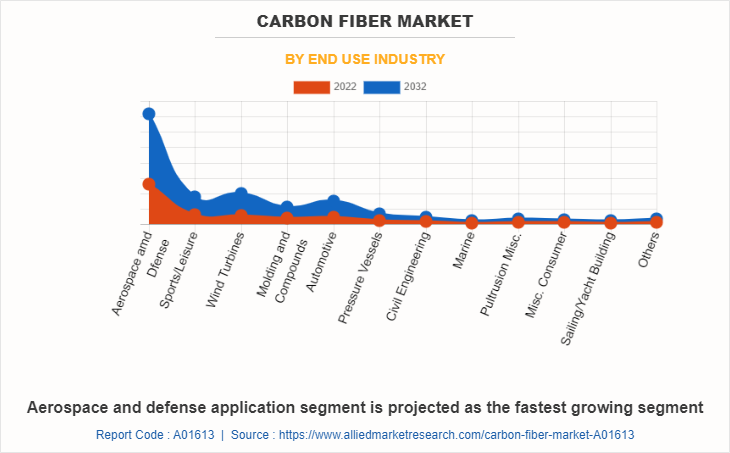
On the basis of end use industry, the aerospace and defense segment was the largest revenue generator in 2022, and is anticipated to grow at a CAGR of 10.6% during the forecast period. The aerospace and defense industry plays a significant role in the growth of the carbon fibers market. Furthermore, the upsurge in international passengers and freight trafficking has led to a rise in demand for aircraft. These factors are expected to eventually boost the demand for carbon fibers market. This is attributed to the fact that they help in reducing weight compared to traditional metallic materials.

Moreover, government investment in the defense industry along with modernization in the defense equipment has enhanced the overall performance of the defense industry. For instance, according to an article published by Economics Times in February 2023, defense sector of India has allotted $72 billion budget in 2023. Carbon fiber composites are widely used in military aircraft structures, including fighter jets, bombers, and unmanned aerial vehicles (UAVs). The lightweight nature of carbon fiber helps improve maneuverability, range, and fuel efficiency while maintaining high structural integrity and stiffness.

The global carbon fiber market profiles leading players that include DowAksa Advanced Composites Holding B.V, Formosa Europe, Solvay, TORAY INDUSTRIES, INC., Nippon Steel Corporation, Mitsubishi Chemical Group Corporation, SGL Carbon, Hyosung Co Public, Teijin Limited, and ZOLTEK.  The global carbon fiber market report provides in-depth competitive analysis as well as profiles of these major players.

Impact Analysis of Russia/Ukraine War

  • Geopolitical tensions can create market uncertainties, which can impact investor confidence and business decisions. Companies may become cautious about investing in new projects or expanding their operations, which could slow down the growth of the carbon fiber market.
  • Armed conflicts or political instability can have adverse effects on the overall economy. If either Russia or Ukraine experiences significant economic downturns as a result of the conflict, it could impact consumer demand for carbon fiber-based products. Reduced demand may lead to lower production levels or delays in the adoption of carbon fiber technologies.
  • Governments often respond to geopolitical events by implementing trade restrictions, tariffs, or sanctions. These measures can affect international trade and impose additional costs on imported or exported carbon fiber products. Changes in regulations or trade policies could create challenges for companies operating in the carbon fiber market.

Key Benefits For Stakeholders

  • This report provides a quantitative analysis of the market segments, current trends, estimations, and dynamics of the carbon fiber market analysis from 2022 to 2032 to identify the prevailing carbon fiber market opportunities.
  • The market research is offered along with information related to key drivers, restraints, and opportunities.
  • Porter's five forces analysis highlights the potency of buyers and suppliers to enable stakeholders make profit-oriented business decisions and strengthen their supplier-buyer network.
  • In-depth analysis of the carbon fiber market segmentation assists to determine the prevailing market opportunities.
  • Major countries in each region are mapped according to their revenue contribution to the global market.
  • Market player positioning facilitates benchmarking and provides a clear understanding of the present position of the market players.
  • The report includes the analysis of the regional as well as global carbon fiber market trends, key players, market segments, application areas, and market growth strategies.

Carbon Fiber Market Report Highlights

Aspects Details
Market Size By 2032 USD 16 billion
Growth Rate CAGR of 11.4%
Forecast period 2022 - 2032
Report Pages 446
By Type
  • Continuous carbon fiber
  • Long carbon fiber
  • Short carbon fiber
By Raw Material
  • PAN-Based carbon fiber
  • Pitch-Based and Rayon-Based carbon fiber
By Form
  • Composite carbon fiber
  • Non-Composite carbon fiber
By End Use Industry
  • Aerospace amd Dfense
  • Sports/Leisure
  • Wind Turbines
  • Molding and Compounds
  • Automotive
  • Pressure Vessels
  • Civil Engineering
  • Marine
  • Pultrusion Misc.
  • Misc. Consumer
  • Sailing/Yacht Building
  • Others
By Region
  • North America  (U.S., Canada, Mexico)
  • Europe  (Germany, UK, France, Italy, Spain, Rest of Europe)
  • Asia-Pacific  (China, Japan, India, South Korea, Australia, Rest of Asia-Pacific)
  • LAMEA  (Brazil, Saudi Arabia, South Africa, Rest of LAMEA)
Key Market Players Solvay, DowAksa, TORAY INDUSTRIES, INC., ZOLTEK, SGL Carbon, Mitsubishi Chemical Group Corporation, Nippon Steel Corporation, Formosa Europe, TEIJIN LIMITED.

Analyst Review

According to to CXOs of leading companies, the global carbon fiber market is expected to exhibit high growth potential due to rise in demand for lightweight, high-strength materials across various end-use industries such as aerospace & defense, automotive, and building & construction. Moreover, the surge in demand for lightweight, fuel-efficient cars encourages automotive manufacturers to adopt carbon fiber.

Carbon fibers enable the manufacturers to considerably reduce the weight of the vehicle without compromising on strength. The product is being utilized to produce a variety of automotive components, including interior body panels, floors, chassis components, diffusers, and spoilers.

The CXOs further added that aerospace-grade carbon fiber has progressively replaced traditional materials, on account of their lightweight and high-strength attributes. The product is being increasingly adopted in the production of a variety of aerospace components such as helicopter blades, fuselage components, aircraft flooring, and antennas. Thus, the rapid expansion of the automotive and aerospace industries across the developing economies, such as China, India, and Brazil, is expected to significantly contribute toward the growth of the carbon fiber market during the forecast period.

 
  • CHAPTER 1: INTRODUCTION

    • 1.1. Report description

    • 1.2. Key market segments

    • 1.3. Key benefits to the stakeholders

    • 1.4. Research Methodology

      • 1.4.1. Primary research

      • 1.4.2. Secondary research

      • 1.4.3. Analyst tools and models

  • CHAPTER 2: EXECUTIVE SUMMARY

    • 2.1. CXO Perspective

  • CHAPTER 3: MARKET OVERVIEW

    • 3.1. Market definition and scope

    • 3.2. Key findings

      • 3.2.1. Top impacting factors

      • 3.2.2. Top investment pockets

    • 3.3. Porter’s five forces analysis

      • 3.3.1. High bargaining power of suppliers

      • 3.3.2. High threat of new entrants

      • 3.3.3. High threat of substitutes

      • 3.3.4. High intensity of rivalry

      • 3.3.5. High bargaining power of buyers

    • 3.4. Market dynamics

      • 3.4.1. Drivers

        • 3.4.1.1. Increase in penetration of carbon fiber components in automotive industry
        • 3.4.1.2. Government regulations for emission control

      • 3.4.2. Restraints

        • 3.4.2.1. Long production cycle and unavailability of carbon fibers

      • 3.4.3. Opportunities

        • 3.4.3.1. Rise in use of carbon fiber in medical industry

    • 3.5. COVID-19 Impact Analysis on the market

    • 3.6. Value Chain Analysis

    • 3.7. Pricing Analysis

    • 3.8. Key Regulation Analysis

    • 3.9. Patent Landscape

    • 3.10. Regulatory Guidelines

  • CHAPTER 4: CARBON FIBER MARKET, BY TYPE

    • 4.1. Overview

      • 4.1.1. Market size and forecast

    • 4.2. Continuous carbon fiber

      • 4.2.1. Key market trends, growth factors and opportunities

      • 4.2.2. Market size and forecast, by region

      • 4.2.3. Market share analysis by country

    • 4.3. Long carbon fiber

      • 4.3.1. Key market trends, growth factors and opportunities

      • 4.3.2. Market size and forecast, by region

      • 4.3.3. Market share analysis by country

    • 4.4. Short carbon fiber

      • 4.4.1. Key market trends, growth factors and opportunities

      • 4.4.2. Market size and forecast, by region

      • 4.4.3. Market share analysis by country

  • CHAPTER 5: CARBON FIBER MARKET, BY RAW MATERIAL

    • 5.1. Overview

      • 5.1.1. Market size and forecast

    • 5.2. PAN-Based carbon fiber

      • 5.2.1. Key market trends, growth factors and opportunities

      • 5.2.2. Market size and forecast, by region

      • 5.2.3. Market share analysis by country

    • 5.3. Pitch-Based and Rayon-Based carbon fiber

      • 5.3.1. Key market trends, growth factors and opportunities

      • 5.3.2. Market size and forecast, by region

      • 5.3.3. Market share analysis by country

  • CHAPTER 6: CARBON FIBER MARKET, BY FORM

    • 6.1. Overview

      • 6.1.1. Market size and forecast

    • 6.2. Composite carbon fiber

      • 6.2.1. Key market trends, growth factors and opportunities

      • 6.2.2. Market size and forecast, by region

      • 6.2.3. Market share analysis by country

    • 6.3. Non-Composite carbon fiber

      • 6.3.1. Key market trends, growth factors and opportunities

      • 6.3.2. Market size and forecast, by region

      • 6.3.3. Market share analysis by country

  • CHAPTER 7: CARBON FIBER MARKET, BY END USE INDUSTRY

    • 7.1. Overview

      • 7.1.1. Market size and forecast

    • 7.2. Aerospace amd Dfense

      • 7.2.1. Key market trends, growth factors and opportunities

      • 7.2.2. Market size and forecast, by region

      • 7.2.3. Market share analysis by country

    • 7.3. Sports/Leisure

      • 7.3.1. Key market trends, growth factors and opportunities

      • 7.3.2. Market size and forecast, by region

      • 7.3.3. Market share analysis by country

    • 7.4. Wind Turbines

      • 7.4.1. Key market trends, growth factors and opportunities

      • 7.4.2. Market size and forecast, by region

      • 7.4.3. Market share analysis by country

    • 7.5. Molding and Compounds

      • 7.5.1. Key market trends, growth factors and opportunities

      • 7.5.2. Market size and forecast, by region

      • 7.5.3. Market share analysis by country

    • 7.6. Automotive

      • 7.6.1. Key market trends, growth factors and opportunities

      • 7.6.2. Market size and forecast, by region

      • 7.6.3. Market share analysis by country

    • 7.7. Pressure Vessels

      • 7.7.1. Key market trends, growth factors and opportunities

      • 7.7.2. Market size and forecast, by region

      • 7.7.3. Market share analysis by country

    • 7.8. Civil Engineering

      • 7.8.1. Key market trends, growth factors and opportunities

      • 7.8.2. Market size and forecast, by region

      • 7.8.3. Market share analysis by country

    • 7.9. Marine

      • 7.9.1. Key market trends, growth factors and opportunities

      • 7.9.2. Market size and forecast, by region

      • 7.9.3. Market share analysis by country

    • 7.10. Pultrusion Misc.

      • 7.10.1. Key market trends, growth factors and opportunities

      • 7.10.2. Market size and forecast, by region

      • 7.10.3. Market share analysis by country

    • 7.11. Misc. Consumer

      • 7.11.1. Key market trends, growth factors and opportunities

      • 7.11.2. Market size and forecast, by region

      • 7.11.3. Market share analysis by country

    • 7.12. Sailing/Yacht Building

      • 7.12.1. Key market trends, growth factors and opportunities

      • 7.12.2. Market size and forecast, by region

      • 7.12.3. Market share analysis by country

    • 7.13. Others

      • 7.13.1. Key market trends, growth factors and opportunities

      • 7.13.2. Market size and forecast, by region

      • 7.13.3. Market share analysis by country

  • CHAPTER 8: CARBON FIBER MARKET, BY REGION

    • 8.1. Overview

      • 8.1.1. Market size and forecast By Region

    • 8.2. North America

      • 8.2.1. Key trends and opportunities

      • 8.2.2. Market size and forecast, by Type

      • 8.2.3. Market size and forecast, by Raw Material

      • 8.2.4. Market size and forecast, by Form

      • 8.2.5. Market size and forecast, by End Use Industry

      • 8.2.6. Market size and forecast, by country

        • 8.2.6.1. U.S.
          • 8.2.6.1.1. Key market trends, growth factors and opportunities
          • 8.2.6.1.2. Market size and forecast, by Type
          • 8.2.6.1.3. Market size and forecast, by Raw Material
          • 8.2.6.1.4. Market size and forecast, by Form
          • 8.2.6.1.5. Market size and forecast, by End Use Industry
        • 8.2.6.2. Canada
          • 8.2.6.2.1. Key market trends, growth factors and opportunities
          • 8.2.6.2.2. Market size and forecast, by Type
          • 8.2.6.2.3. Market size and forecast, by Raw Material
          • 8.2.6.2.4. Market size and forecast, by Form
          • 8.2.6.2.5. Market size and forecast, by End Use Industry
        • 8.2.6.3. Mexico
          • 8.2.6.3.1. Key market trends, growth factors and opportunities
          • 8.2.6.3.2. Market size and forecast, by Type
          • 8.2.6.3.3. Market size and forecast, by Raw Material
          • 8.2.6.3.4. Market size and forecast, by Form
          • 8.2.6.3.5. Market size and forecast, by End Use Industry
    • 8.3. Europe

      • 8.3.1. Key trends and opportunities

      • 8.3.2. Market size and forecast, by Type

      • 8.3.3. Market size and forecast, by Raw Material

      • 8.3.4. Market size and forecast, by Form

      • 8.3.5. Market size and forecast, by End Use Industry

      • 8.3.6. Market size and forecast, by country

        • 8.3.6.1. Germany
          • 8.3.6.1.1. Key market trends, growth factors and opportunities
          • 8.3.6.1.2. Market size and forecast, by Type
          • 8.3.6.1.3. Market size and forecast, by Raw Material
          • 8.3.6.1.4. Market size and forecast, by Form
          • 8.3.6.1.5. Market size and forecast, by End Use Industry
        • 8.3.6.2. UK
          • 8.3.6.2.1. Key market trends, growth factors and opportunities
          • 8.3.6.2.2. Market size and forecast, by Type
          • 8.3.6.2.3. Market size and forecast, by Raw Material
          • 8.3.6.2.4. Market size and forecast, by Form
          • 8.3.6.2.5. Market size and forecast, by End Use Industry
        • 8.3.6.3. France
          • 8.3.6.3.1. Key market trends, growth factors and opportunities
          • 8.3.6.3.2. Market size and forecast, by Type
          • 8.3.6.3.3. Market size and forecast, by Raw Material
          • 8.3.6.3.4. Market size and forecast, by Form
          • 8.3.6.3.5. Market size and forecast, by End Use Industry
        • 8.3.6.4. Italy
          • 8.3.6.4.1. Key market trends, growth factors and opportunities
          • 8.3.6.4.2. Market size and forecast, by Type
          • 8.3.6.4.3. Market size and forecast, by Raw Material
          • 8.3.6.4.4. Market size and forecast, by Form
          • 8.3.6.4.5. Market size and forecast, by End Use Industry
        • 8.3.6.5. Spain
          • 8.3.6.5.1. Key market trends, growth factors and opportunities
          • 8.3.6.5.2. Market size and forecast, by Type
          • 8.3.6.5.3. Market size and forecast, by Raw Material
          • 8.3.6.5.4. Market size and forecast, by Form
          • 8.3.6.5.5. Market size and forecast, by End Use Industry
        • 8.3.6.6. Rest of Europe
          • 8.3.6.6.1. Key market trends, growth factors and opportunities
          • 8.3.6.6.2. Market size and forecast, by Type
          • 8.3.6.6.3. Market size and forecast, by Raw Material
          • 8.3.6.6.4. Market size and forecast, by Form
          • 8.3.6.6.5. Market size and forecast, by End Use Industry
    • 8.4. Asia-Pacific

      • 8.4.1. Key trends and opportunities

      • 8.4.2. Market size and forecast, by Type

      • 8.4.3. Market size and forecast, by Raw Material

      • 8.4.4. Market size and forecast, by Form

      • 8.4.5. Market size and forecast, by End Use Industry

      • 8.4.6. Market size and forecast, by country

        • 8.4.6.1. China
          • 8.4.6.1.1. Key market trends, growth factors and opportunities
          • 8.4.6.1.2. Market size and forecast, by Type
          • 8.4.6.1.3. Market size and forecast, by Raw Material
          • 8.4.6.1.4. Market size and forecast, by Form
          • 8.4.6.1.5. Market size and forecast, by End Use Industry
        • 8.4.6.2. Japan
          • 8.4.6.2.1. Key market trends, growth factors and opportunities
          • 8.4.6.2.2. Market size and forecast, by Type
          • 8.4.6.2.3. Market size and forecast, by Raw Material
          • 8.4.6.2.4. Market size and forecast, by Form
          • 8.4.6.2.5. Market size and forecast, by End Use Industry
        • 8.4.6.3. India
          • 8.4.6.3.1. Key market trends, growth factors and opportunities
          • 8.4.6.3.2. Market size and forecast, by Type
          • 8.4.6.3.3. Market size and forecast, by Raw Material
          • 8.4.6.3.4. Market size and forecast, by Form
          • 8.4.6.3.5. Market size and forecast, by End Use Industry
        • 8.4.6.4. South Korea
          • 8.4.6.4.1. Key market trends, growth factors and opportunities
          • 8.4.6.4.2. Market size and forecast, by Type
          • 8.4.6.4.3. Market size and forecast, by Raw Material
          • 8.4.6.4.4. Market size and forecast, by Form
          • 8.4.6.4.5. Market size and forecast, by End Use Industry
        • 8.4.6.5. Australia
          • 8.4.6.5.1. Key market trends, growth factors and opportunities
          • 8.4.6.5.2. Market size and forecast, by Type
          • 8.4.6.5.3. Market size and forecast, by Raw Material
          • 8.4.6.5.4. Market size and forecast, by Form
          • 8.4.6.5.5. Market size and forecast, by End Use Industry
        • 8.4.6.6. Rest of Asia-Pacific
          • 8.4.6.6.1. Key market trends, growth factors and opportunities
          • 8.4.6.6.2. Market size and forecast, by Type
          • 8.4.6.6.3. Market size and forecast, by Raw Material
          • 8.4.6.6.4. Market size and forecast, by Form
          • 8.4.6.6.5. Market size and forecast, by End Use Industry
    • 8.5. LAMEA

      • 8.5.1. Key trends and opportunities

      • 8.5.2. Market size and forecast, by Type

      • 8.5.3. Market size and forecast, by Raw Material

      • 8.5.4. Market size and forecast, by Form

      • 8.5.5. Market size and forecast, by End Use Industry

      • 8.5.6. Market size and forecast, by country

        • 8.5.6.1. Brazil
          • 8.5.6.1.1. Key market trends, growth factors and opportunities
          • 8.5.6.1.2. Market size and forecast, by Type
          • 8.5.6.1.3. Market size and forecast, by Raw Material
          • 8.5.6.1.4. Market size and forecast, by Form
          • 8.5.6.1.5. Market size and forecast, by End Use Industry
        • 8.5.6.2. Saudi Arabia
          • 8.5.6.2.1. Key market trends, growth factors and opportunities
          • 8.5.6.2.2. Market size and forecast, by Type
          • 8.5.6.2.3. Market size and forecast, by Raw Material
          • 8.5.6.2.4. Market size and forecast, by Form
          • 8.5.6.2.5. Market size and forecast, by End Use Industry
        • 8.5.6.3. South Africa
          • 8.5.6.3.1. Key market trends, growth factors and opportunities
          • 8.5.6.3.2. Market size and forecast, by Type
          • 8.5.6.3.3. Market size and forecast, by Raw Material
          • 8.5.6.3.4. Market size and forecast, by Form
          • 8.5.6.3.5. Market size and forecast, by End Use Industry
        • 8.5.6.4. Rest of LAMEA
          • 8.5.6.4.1. Key market trends, growth factors and opportunities
          • 8.5.6.4.2. Market size and forecast, by Type
          • 8.5.6.4.3. Market size and forecast, by Raw Material
          • 8.5.6.4.4. Market size and forecast, by Form
          • 8.5.6.4.5. Market size and forecast, by End Use Industry
  • CHAPTER 9: COMPETITIVE LANDSCAPE

    • 9.1. Introduction

    • 9.2. Top winning strategies

    • 9.3. Product Mapping of Top 10 Player

    • 9.4. Competitive Dashboard

    • 9.5. Competitive Heatmap

    • 9.6. Top player positioning, 2022

  • CHAPTER 10: COMPANY PROFILES

    • 10.1. DowAksa

      • 10.1.1. Company overview

      • 10.1.2. Key Executives

      • 10.1.3. Company snapshot

      • 10.1.4. Operating business segments

      • 10.1.5. Product portfolio

    • 10.2. Formosa Europe

      • 10.2.1. Company overview

      • 10.2.2. Key Executives

      • 10.2.3. Company snapshot

      • 10.2.4. Operating business segments

      • 10.2.5. Product portfolio

    • 10.3. Solvay

      • 10.3.1. Company overview

      • 10.3.2. Key Executives

      • 10.3.3. Company snapshot

      • 10.3.4. Operating business segments

      • 10.3.5. Product portfolio

      • 10.3.6. Business performance

    • 10.4. TORAY INDUSTRIES, INC.

      • 10.4.1. Company overview

      • 10.4.2. Key Executives

      • 10.4.3. Company snapshot

      • 10.4.4. Operating business segments

      • 10.4.5. Product portfolio

      • 10.4.6. Business performance

    • 10.5. Nippon Steel Corporation

      • 10.5.1. Company overview

      • 10.5.2. Key Executives

      • 10.5.3. Company snapshot

      • 10.5.4. Operating business segments

      • 10.5.5. Product portfolio

      • 10.5.6. Business performance

    • 10.6. Mitsubishi Chemical Group Corporation

      • 10.6.1. Company overview

      • 10.6.2. Key Executives

      • 10.6.3. Company snapshot

      • 10.6.4. Operating business segments

      • 10.6.5. Product portfolio

      • 10.6.6. Business performance

    • 10.7. SGL Carbon

      • 10.7.1. Company overview

      • 10.7.2. Key Executives

      • 10.7.3. Company snapshot

      • 10.7.4. Operating business segments

      • 10.7.5. Product portfolio

      • 10.7.6. Business performance

    • 10.8. TEIJIN LIMITED.

      • 10.8.1. Company overview

      • 10.8.2. Key Executives

      • 10.8.3. Company snapshot

      • 10.8.4. Operating business segments

      • 10.8.5. Product portfolio

      • 10.8.6. Business performance

    • 10.9. ZOLTEK

      • 10.9.1. Company overview

      • 10.9.2. Key Executives

      • 10.9.3. Company snapshot

      • 10.9.4. Operating business segments

      • 10.9.5. Product portfolio

  • LIST OF TABLES

  • TABLE 01. GLOBAL CARBON FIBER MARKET, BY TYPE, 2022-2032 ($MILLION)
    TABLE 02. GLOBAL CARBON FIBER MARKET, BY TYPE, 2022-2032 (KILOTON)
    TABLE 03. CARBON FIBER MARKET FOR CONTINUOUS CARBON FIBER, BY REGION, 2022-2032 ($MILLION)
    TABLE 04. CARBON FIBER MARKET FOR CONTINUOUS CARBON FIBER, BY REGION, 2022-2032 (KILOTON)
    TABLE 05. CARBON FIBER MARKET FOR LONG CARBON FIBER, BY REGION, 2022-2032 ($MILLION)
    TABLE 06. CARBON FIBER MARKET FOR LONG CARBON FIBER, BY REGION, 2022-2032 (KILOTON)
    TABLE 07. CARBON FIBER MARKET FOR SHORT CARBON FIBER, BY REGION, 2022-2032 ($MILLION)
    TABLE 08. CARBON FIBER MARKET FOR SHORT CARBON FIBER, BY REGION, 2022-2032 (KILOTON)
    TABLE 09. GLOBAL CARBON FIBER MARKET, BY RAW MATERIAL, 2022-2032 ($MILLION)
    TABLE 10. GLOBAL CARBON FIBER MARKET, BY RAW MATERIAL, 2022-2032 (KILOTON)
    TABLE 11. CARBON FIBER MARKET FOR PAN-BASED CARBON FIBER, BY REGION, 2022-2032 ($MILLION)
    TABLE 12. CARBON FIBER MARKET FOR PAN-BASED CARBON FIBER, BY REGION, 2022-2032 (KILOTON)
    TABLE 13. CARBON FIBER MARKET FOR PITCH-BASED AND RAYON-BASED CARBON FIBER, BY REGION, 2022-2032 ($MILLION)
    TABLE 14. CARBON FIBER MARKET FOR PITCH-BASED AND RAYON-BASED CARBON FIBER, BY REGION, 2022-2032 (KILOTON)
    TABLE 15. GLOBAL CARBON FIBER MARKET, BY FORM, 2022-2032 ($MILLION)
    TABLE 16. GLOBAL CARBON FIBER MARKET, BY FORM, 2022-2032 (KILOTON)
    TABLE 17. CARBON FIBER MARKET FOR COMPOSITE CARBON FIBER, BY REGION, 2022-2032 ($MILLION)
    TABLE 18. CARBON FIBER MARKET FOR COMPOSITE CARBON FIBER, BY REGION, 2022-2032 (KILOTON)
    TABLE 19. CARBON FIBER MARKET FOR NON-COMPOSITE CARBON FIBER, BY REGION, 2022-2032 ($MILLION)
    TABLE 20. CARBON FIBER MARKET FOR NON-COMPOSITE CARBON FIBER, BY REGION, 2022-2032 (KILOTON)
    TABLE 21. GLOBAL CARBON FIBER MARKET, BY END USE INDUSTRY, 2022-2032 ($MILLION)
    TABLE 22. GLOBAL CARBON FIBER MARKET, BY END USE INDUSTRY, 2022-2032 (KILOTON)
    TABLE 23. CARBON FIBER MARKET FOR AEROSPACE AMD DFENSE, BY REGION, 2022-2032 ($MILLION)
    TABLE 24. CARBON FIBER MARKET FOR AEROSPACE AMD DFENSE, BY REGION, 2022-2032 (KILOTON)
    TABLE 25. CARBON FIBER MARKET FOR SPORTS/LEISURE, BY REGION, 2022-2032 ($MILLION)
    TABLE 26. CARBON FIBER MARKET FOR SPORTS/LEISURE, BY REGION, 2022-2032 (KILOTON)
    TABLE 27. CARBON FIBER MARKET FOR WIND TURBINES, BY REGION, 2022-2032 ($MILLION)
    TABLE 28. CARBON FIBER MARKET FOR WIND TURBINES, BY REGION, 2022-2032 (KILOTON)
    TABLE 29. CARBON FIBER MARKET FOR MOLDING AND COMPOUNDS, BY REGION, 2022-2032 ($MILLION)
    TABLE 30. CARBON FIBER MARKET FOR MOLDING AND COMPOUNDS, BY REGION, 2022-2032 (KILOTON)
    TABLE 31. CARBON FIBER MARKET FOR AUTOMOTIVE, BY REGION, 2022-2032 ($MILLION)
    TABLE 32. CARBON FIBER MARKET FOR AUTOMOTIVE, BY REGION, 2022-2032 (KILOTON)
    TABLE 33. CARBON FIBER MARKET FOR PRESSURE VESSELS, BY REGION, 2022-2032 ($MILLION)
    TABLE 34. CARBON FIBER MARKET FOR PRESSURE VESSELS, BY REGION, 2022-2032 (KILOTON)
    TABLE 35. CARBON FIBER MARKET FOR CIVIL ENGINEERING, BY REGION, 2022-2032 ($MILLION)
    TABLE 36. CARBON FIBER MARKET FOR CIVIL ENGINEERING, BY REGION, 2022-2032 (KILOTON)
    TABLE 37. CARBON FIBER MARKET FOR MARINE, BY REGION, 2022-2032 ($MILLION)
    TABLE 38. CARBON FIBER MARKET FOR MARINE, BY REGION, 2022-2032 (KILOTON)
    TABLE 39. CARBON FIBER MARKET FOR PULTRUSION MISC., BY REGION, 2022-2032 ($MILLION)
    TABLE 40. CARBON FIBER MARKET FOR PULTRUSION MISC., BY REGION, 2022-2032 (KILOTON)
    TABLE 41. CARBON FIBER MARKET FOR MISC. CONSUMER, BY REGION, 2022-2032 ($MILLION)
    TABLE 42. CARBON FIBER MARKET FOR MISC. CONSUMER, BY REGION, 2022-2032 (KILOTON)
    TABLE 43. CARBON FIBER MARKET FOR SAILING/YACHT BUILDING, BY REGION, 2022-2032 ($MILLION)
    TABLE 44. CARBON FIBER MARKET FOR SAILING/YACHT BUILDING, BY REGION, 2022-2032 (KILOTON)
    TABLE 45. CARBON FIBER MARKET FOR OTHERS, BY REGION, 2022-2032 ($MILLION)
    TABLE 46. CARBON FIBER MARKET FOR OTHERS, BY REGION, 2022-2032 (KILOTON)
    TABLE 47. CARBON FIBER MARKET, BY REGION, 2022-2032 ($MILLION)
    TABLE 48. CARBON FIBER MARKET, BY REGION, 2022-2032 (KILOTON)
    TABLE 49. NORTH AMERICA CARBON FIBER MARKET, BY TYPE, 2022-2032 ($MILLION)
    TABLE 50. NORTH AMERICA CARBON FIBER MARKET, BY TYPE, 2022-2032 (KILOTON)
    TABLE 51. NORTH AMERICA CARBON FIBER MARKET, BY RAW MATERIAL, 2022-2032 ($MILLION)
    TABLE 52. NORTH AMERICA CARBON FIBER MARKET, BY RAW MATERIAL, 2022-2032 (KILOTON)
    TABLE 53. NORTH AMERICA CARBON FIBER MARKET, BY FORM, 2022-2032 ($MILLION)
    TABLE 54. NORTH AMERICA CARBON FIBER MARKET, BY FORM, 2022-2032 (KILOTON)
    TABLE 55. NORTH AMERICA CARBON FIBER MARKET, BY END USE INDUSTRY, 2022-2032 ($MILLION)
    TABLE 56. NORTH AMERICA CARBON FIBER MARKET, BY END USE INDUSTRY, 2022-2032 (KILOTON)
    TABLE 57. NORTH AMERICA CARBON FIBER MARKET, BY COUNTRY, 2022-2032 ($MILLION)
    TABLE 58. NORTH AMERICA CARBON FIBER MARKET, BY COUNTRY, 2022-2032 (KILOTON)
    TABLE 59. U.S. CARBON FIBER MARKET, BY TYPE, 2022-2032 ($MILLION)
    TABLE 60. U.S. CARBON FIBER MARKET, BY TYPE, 2022-2032 (KILOTON)
    TABLE 61. U.S. CARBON FIBER MARKET, BY RAW MATERIAL, 2022-2032 ($MILLION)
    TABLE 62. U.S. CARBON FIBER MARKET, BY RAW MATERIAL, 2022-2032 (KILOTON)
    TABLE 63. U.S. CARBON FIBER MARKET, BY FORM, 2022-2032 ($MILLION)
    TABLE 64. U.S. CARBON FIBER MARKET, BY FORM, 2022-2032 (KILOTON)
    TABLE 65. U.S. CARBON FIBER MARKET, BY END USE INDUSTRY, 2022-2032 ($MILLION)
    TABLE 66. U.S. CARBON FIBER MARKET, BY END USE INDUSTRY, 2022-2032 (KILOTON)
    TABLE 67. CANADA CARBON FIBER MARKET, BY TYPE, 2022-2032 ($MILLION)
    TABLE 68. CANADA CARBON FIBER MARKET, BY TYPE, 2022-2032 (KILOTON)
    TABLE 69. CANADA CARBON FIBER MARKET, BY RAW MATERIAL, 2022-2032 ($MILLION)
    TABLE 70. CANADA CARBON FIBER MARKET, BY RAW MATERIAL, 2022-2032 (KILOTON)
    TABLE 71. CANADA CARBON FIBER MARKET, BY FORM, 2022-2032 ($MILLION)
    TABLE 72. CANADA CARBON FIBER MARKET, BY FORM, 2022-2032 (KILOTON)
    TABLE 73. CANADA CARBON FIBER MARKET, BY END USE INDUSTRY, 2022-2032 ($MILLION)
    TABLE 74. CANADA CARBON FIBER MARKET, BY END USE INDUSTRY, 2022-2032 (KILOTON)
    TABLE 75. MEXICO CARBON FIBER MARKET, BY TYPE, 2022-2032 ($MILLION)
    TABLE 76. MEXICO CARBON FIBER MARKET, BY TYPE, 2022-2032 (KILOTON)
    TABLE 77. MEXICO CARBON FIBER MARKET, BY RAW MATERIAL, 2022-2032 ($MILLION)
    TABLE 78. MEXICO CARBON FIBER MARKET, BY RAW MATERIAL, 2022-2032 (KILOTON)
    TABLE 79. MEXICO CARBON FIBER MARKET, BY FORM, 2022-2032 ($MILLION)
    TABLE 80. MEXICO CARBON FIBER MARKET, BY FORM, 2022-2032 (KILOTON)
    TABLE 81. MEXICO CARBON FIBER MARKET, BY END USE INDUSTRY, 2022-2032 ($MILLION)
    TABLE 82. MEXICO CARBON FIBER MARKET, BY END USE INDUSTRY, 2022-2032 (KILOTON)
    TABLE 83. EUROPE CARBON FIBER MARKET, BY TYPE, 2022-2032 ($MILLION)
    TABLE 84. EUROPE CARBON FIBER MARKET, BY TYPE, 2022-2032 (KILOTON)
    TABLE 85. EUROPE CARBON FIBER MARKET, BY RAW MATERIAL, 2022-2032 ($MILLION)
    TABLE 86. EUROPE CARBON FIBER MARKET, BY RAW MATERIAL, 2022-2032 (KILOTON)
    TABLE 87. EUROPE CARBON FIBER MARKET, BY FORM, 2022-2032 ($MILLION)
    TABLE 88. EUROPE CARBON FIBER MARKET, BY FORM, 2022-2032 (KILOTON)
    TABLE 89. EUROPE CARBON FIBER MARKET, BY END USE INDUSTRY, 2022-2032 ($MILLION)
    TABLE 90. EUROPE CARBON FIBER MARKET, BY END USE INDUSTRY, 2022-2032 (KILOTON)
    TABLE 91. EUROPE CARBON FIBER MARKET, BY COUNTRY, 2022-2032 ($MILLION)
    TABLE 92. EUROPE CARBON FIBER MARKET, BY COUNTRY, 2022-2032 (KILOTON)
    TABLE 93. GERMANY CARBON FIBER MARKET, BY TYPE, 2022-2032 ($MILLION)
    TABLE 94. GERMANY CARBON FIBER MARKET, BY TYPE, 2022-2032 (KILOTON)
    TABLE 95. GERMANY CARBON FIBER MARKET, BY RAW MATERIAL, 2022-2032 ($MILLION)
    TABLE 96. GERMANY CARBON FIBER MARKET, BY RAW MATERIAL, 2022-2032 (KILOTON)
    TABLE 97. GERMANY CARBON FIBER MARKET, BY FORM, 2022-2032 ($MILLION)
    TABLE 98. GERMANY CARBON FIBER MARKET, BY FORM, 2022-2032 (KILOTON)
    TABLE 99. GERMANY CARBON FIBER MARKET, BY END USE INDUSTRY, 2022-2032 ($MILLION)
    TABLE 100. GERMANY CARBON FIBER MARKET, BY END USE INDUSTRY, 2022-2032 (KILOTON)
    TABLE 101. UK CARBON FIBER MARKET, BY TYPE, 2022-2032 ($MILLION)
    TABLE 102. UK CARBON FIBER MARKET, BY TYPE, 2022-2032 (KILOTON)
    TABLE 103. UK CARBON FIBER MARKET, BY RAW MATERIAL, 2022-2032 ($MILLION)
    TABLE 104. UK CARBON FIBER MARKET, BY RAW MATERIAL, 2022-2032 (KILOTON)
    TABLE 105. UK CARBON FIBER MARKET, BY FORM, 2022-2032 ($MILLION)
    TABLE 106. UK CARBON FIBER MARKET, BY FORM, 2022-2032 (KILOTON)
    TABLE 107. UK CARBON FIBER MARKET, BY END USE INDUSTRY, 2022-2032 ($MILLION)
    TABLE 108. UK CARBON FIBER MARKET, BY END USE INDUSTRY, 2022-2032 (KILOTON)
    TABLE 109. FRANCE CARBON FIBER MARKET, BY TYPE, 2022-2032 ($MILLION)
    TABLE 110. FRANCE CARBON FIBER MARKET, BY TYPE, 2022-2032 (KILOTON)
    TABLE 111. FRANCE CARBON FIBER MARKET, BY RAW MATERIAL, 2022-2032 ($MILLION)
    TABLE 112. FRANCE CARBON FIBER MARKET, BY RAW MATERIAL, 2022-2032 (KILOTON)
    TABLE 113. FRANCE CARBON FIBER MARKET, BY FORM, 2022-2032 ($MILLION)
    TABLE 114. FRANCE CARBON FIBER MARKET, BY FORM, 2022-2032 (KILOTON)
    TABLE 115. FRANCE CARBON FIBER MARKET, BY END USE INDUSTRY, 2022-2032 ($MILLION)
    TABLE 116. FRANCE CARBON FIBER MARKET, BY END USE INDUSTRY, 2022-2032 (KILOTON)
    TABLE 117. ITALY CARBON FIBER MARKET, BY TYPE, 2022-2032 ($MILLION)
    TABLE 118. ITALY CARBON FIBER MARKET, BY TYPE, 2022-2032 (KILOTON)
    TABLE 119. ITALY CARBON FIBER MARKET, BY RAW MATERIAL, 2022-2032 ($MILLION)
    TABLE 120. ITALY CARBON FIBER MARKET, BY RAW MATERIAL, 2022-2032 (KILOTON)
    TABLE 121. ITALY CARBON FIBER MARKET, BY FORM, 2022-2032 ($MILLION)
    TABLE 122. ITALY CARBON FIBER MARKET, BY FORM, 2022-2032 (KILOTON)
    TABLE 123. ITALY CARBON FIBER MARKET, BY END USE INDUSTRY, 2022-2032 ($MILLION)
    TABLE 124. ITALY CARBON FIBER MARKET, BY END USE INDUSTRY, 2022-2032 (KILOTON)
    TABLE 125. SPAIN CARBON FIBER MARKET, BY TYPE, 2022-2032 ($MILLION)
    TABLE 126. SPAIN CARBON FIBER MARKET, BY TYPE, 2022-2032 (KILOTON)
    TABLE 127. SPAIN CARBON FIBER MARKET, BY RAW MATERIAL, 2022-2032 ($MILLION)
    TABLE 128. SPAIN CARBON FIBER MARKET, BY RAW MATERIAL, 2022-2032 (KILOTON)
    TABLE 129. SPAIN CARBON FIBER MARKET, BY FORM, 2022-2032 ($MILLION)
    TABLE 130. SPAIN CARBON FIBER MARKET, BY FORM, 2022-2032 (KILOTON)
    TABLE 131. SPAIN CARBON FIBER MARKET, BY END USE INDUSTRY, 2022-2032 ($MILLION)
    TABLE 132. SPAIN CARBON FIBER MARKET, BY END USE INDUSTRY, 2022-2032 (KILOTON)
    TABLE 133. REST OF EUROPE CARBON FIBER MARKET, BY TYPE, 2022-2032 ($MILLION)
    TABLE 134. REST OF EUROPE CARBON FIBER MARKET, BY TYPE, 2022-2032 (KILOTON)
    TABLE 135. REST OF EUROPE CARBON FIBER MARKET, BY RAW MATERIAL, 2022-2032 ($MILLION)
    TABLE 136. REST OF EUROPE CARBON FIBER MARKET, BY RAW MATERIAL, 2022-2032 (KILOTON)
    TABLE 137. REST OF EUROPE CARBON FIBER MARKET, BY FORM, 2022-2032 ($MILLION)
    TABLE 138. REST OF EUROPE CARBON FIBER MARKET, BY FORM, 2022-2032 (KILOTON)
    TABLE 139. REST OF EUROPE CARBON FIBER MARKET, BY END USE INDUSTRY, 2022-2032 ($MILLION)
    TABLE 140. REST OF EUROPE CARBON FIBER MARKET, BY END USE INDUSTRY, 2022-2032 (KILOTON)
    TABLE 141. ASIA-PACIFIC CARBON FIBER MARKET, BY TYPE, 2022-2032 ($MILLION)
    TABLE 142. ASIA-PACIFIC CARBON FIBER MARKET, BY TYPE, 2022-2032 (KILOTON)
    TABLE 143. ASIA-PACIFIC CARBON FIBER MARKET, BY RAW MATERIAL, 2022-2032 ($MILLION)
    TABLE 144. ASIA-PACIFIC CARBON FIBER MARKET, BY RAW MATERIAL, 2022-2032 (KILOTON)
    TABLE 145. ASIA-PACIFIC CARBON FIBER MARKET, BY FORM, 2022-2032 ($MILLION)
    TABLE 146. ASIA-PACIFIC CARBON FIBER MARKET, BY FORM, 2022-2032 (KILOTON)
    TABLE 147. ASIA-PACIFIC CARBON FIBER MARKET, BY END USE INDUSTRY, 2022-2032 ($MILLION)
    TABLE 148. ASIA-PACIFIC CARBON FIBER MARKET, BY END USE INDUSTRY, 2022-2032 (KILOTON)
    TABLE 149. ASIA-PACIFIC CARBON FIBER MARKET, BY COUNTRY, 2022-2032 ($MILLION)
    TABLE 150. ASIA-PACIFIC CARBON FIBER MARKET, BY COUNTRY, 2022-2032 (KILOTON)
    TABLE 151. CHINA CARBON FIBER MARKET, BY TYPE, 2022-2032 ($MILLION)
    TABLE 152. CHINA CARBON FIBER MARKET, BY TYPE, 2022-2032 (KILOTON)
    TABLE 153. CHINA CARBON FIBER MARKET, BY RAW MATERIAL, 2022-2032 ($MILLION)
    TABLE 154. CHINA CARBON FIBER MARKET, BY RAW MATERIAL, 2022-2032 (KILOTON)
    TABLE 155. CHINA CARBON FIBER MARKET, BY FORM, 2022-2032 ($MILLION)
    TABLE 156. CHINA CARBON FIBER MARKET, BY FORM, 2022-2032 (KILOTON)
    TABLE 157. CHINA CARBON FIBER MARKET, BY END USE INDUSTRY, 2022-2032 ($MILLION)
    TABLE 158. CHINA CARBON FIBER MARKET, BY END USE INDUSTRY, 2022-2032 (KILOTON)
    TABLE 159. JAPAN CARBON FIBER MARKET, BY TYPE, 2022-2032 ($MILLION)
    TABLE 160. JAPAN CARBON FIBER MARKET, BY TYPE, 2022-2032 (KILOTON)
    TABLE 161. JAPAN CARBON FIBER MARKET, BY RAW MATERIAL, 2022-2032 ($MILLION)
    TABLE 162. JAPAN CARBON FIBER MARKET, BY RAW MATERIAL, 2022-2032 (KILOTON)
    TABLE 163. JAPAN CARBON FIBER MARKET, BY FORM, 2022-2032 ($MILLION)
    TABLE 164. JAPAN CARBON FIBER MARKET, BY FORM, 2022-2032 (KILOTON)
    TABLE 165. JAPAN CARBON FIBER MARKET, BY END USE INDUSTRY, 2022-2032 ($MILLION)
    TABLE 166. JAPAN CARBON FIBER MARKET, BY END USE INDUSTRY, 2022-2032 (KILOTON)
    TABLE 167. INDIA CARBON FIBER MARKET, BY TYPE, 2022-2032 ($MILLION)
    TABLE 168. INDIA CARBON FIBER MARKET, BY TYPE, 2022-2032 (KILOTON)
    TABLE 169. INDIA CARBON FIBER MARKET, BY RAW MATERIAL, 2022-2032 ($MILLION)
    TABLE 170. INDIA CARBON FIBER MARKET, BY RAW MATERIAL, 2022-2032 (KILOTON)
    TABLE 171. INDIA CARBON FIBER MARKET, BY FORM, 2022-2032 ($MILLION)
    TABLE 172. INDIA CARBON FIBER MARKET, BY FORM, 2022-2032 (KILOTON)
    TABLE 173. INDIA CARBON FIBER MARKET, BY END USE INDUSTRY, 2022-2032 ($MILLION)
    TABLE 174. INDIA CARBON FIBER MARKET, BY END USE INDUSTRY, 2022-2032 (KILOTON)
    TABLE 175. SOUTH KOREA CARBON FIBER MARKET, BY TYPE, 2022-2032 ($MILLION)
    TABLE 176. SOUTH KOREA CARBON FIBER MARKET, BY TYPE, 2022-2032 (KILOTON)
    TABLE 177. SOUTH KOREA CARBON FIBER MARKET, BY RAW MATERIAL, 2022-2032 ($MILLION)
    TABLE 178. SOUTH KOREA CARBON FIBER MARKET, BY RAW MATERIAL, 2022-2032 (KILOTON)
    TABLE 179. SOUTH KOREA CARBON FIBER MARKET, BY FORM, 2022-2032 ($MILLION)
    TABLE 180. SOUTH KOREA CARBON FIBER MARKET, BY FORM, 2022-2032 (KILOTON)
    TABLE 181. SOUTH KOREA CARBON FIBER MARKET, BY END USE INDUSTRY, 2022-2032 ($MILLION)
    TABLE 182. SOUTH KOREA CARBON FIBER MARKET, BY END USE INDUSTRY, 2022-2032 (KILOTON)
    TABLE 183. AUSTRALIA CARBON FIBER MARKET, BY TYPE, 2022-2032 ($MILLION)
    TABLE 184. AUSTRALIA CARBON FIBER MARKET, BY TYPE, 2022-2032 (KILOTON)
    TABLE 185. AUSTRALIA CARBON FIBER MARKET, BY RAW MATERIAL, 2022-2032 ($MILLION)
    TABLE 186. AUSTRALIA CARBON FIBER MARKET, BY RAW MATERIAL, 2022-2032 (KILOTON)
    TABLE 187. AUSTRALIA CARBON FIBER MARKET, BY FORM, 2022-2032 ($MILLION)
    TABLE 188. AUSTRALIA CARBON FIBER MARKET, BY FORM, 2022-2032 (KILOTON)
    TABLE 189. AUSTRALIA CARBON FIBER MARKET, BY END USE INDUSTRY, 2022-2032 ($MILLION)
    TABLE 190. AUSTRALIA CARBON FIBER MARKET, BY END USE INDUSTRY, 2022-2032 (KILOTON)
    TABLE 191. REST OF ASIA-PACIFIC CARBON FIBER MARKET, BY TYPE, 2022-2032 ($MILLION)
    TABLE 192. REST OF ASIA-PACIFIC CARBON FIBER MARKET, BY TYPE, 2022-2032 (KILOTON)
    TABLE 193. REST OF ASIA-PACIFIC CARBON FIBER MARKET, BY RAW MATERIAL, 2022-2032 ($MILLION)
    TABLE 194. REST OF ASIA-PACIFIC CARBON FIBER MARKET, BY RAW MATERIAL, 2022-2032 (KILOTON)
    TABLE 195. REST OF ASIA-PACIFIC CARBON FIBER MARKET, BY FORM, 2022-2032 ($MILLION)
    TABLE 196. REST OF ASIA-PACIFIC CARBON FIBER MARKET, BY FORM, 2022-2032 (KILOTON)
    TABLE 197. REST OF ASIA-PACIFIC CARBON FIBER MARKET, BY END USE INDUSTRY, 2022-2032 ($MILLION)
    TABLE 198. REST OF ASIA-PACIFIC CARBON FIBER MARKET, BY END USE INDUSTRY, 2022-2032 (KILOTON)
    TABLE 199. LAMEA CARBON FIBER MARKET, BY TYPE, 2022-2032 ($MILLION)
    TABLE 200. LAMEA CARBON FIBER MARKET, BY TYPE, 2022-2032 (KILOTON)
    TABLE 201. LAMEA CARBON FIBER MARKET, BY RAW MATERIAL, 2022-2032 ($MILLION)
    TABLE 202. LAMEA CARBON FIBER MARKET, BY RAW MATERIAL, 2022-2032 (KILOTON)
    TABLE 203. LAMEA CARBON FIBER MARKET, BY FORM, 2022-2032 ($MILLION)
    TABLE 204. LAMEA CARBON FIBER MARKET, BY FORM, 2022-2032 (KILOTON)
    TABLE 205. LAMEA CARBON FIBER MARKET, BY END USE INDUSTRY, 2022-2032 ($MILLION)
    TABLE 206. LAMEA CARBON FIBER MARKET, BY END USE INDUSTRY, 2022-2032 (KILOTON)
    TABLE 207. LAMEA CARBON FIBER MARKET, BY COUNTRY, 2022-2032 ($MILLION)
    TABLE 208. LAMEA CARBON FIBER MARKET, BY COUNTRY, 2022-2032 (KILOTON)
    TABLE 209. BRAZIL CARBON FIBER MARKET, BY TYPE, 2022-2032 ($MILLION)
    TABLE 210. BRAZIL CARBON FIBER MARKET, BY TYPE, 2022-2032 (KILOTON)
    TABLE 211. BRAZIL CARBON FIBER MARKET, BY RAW MATERIAL, 2022-2032 ($MILLION)
    TABLE 212. BRAZIL CARBON FIBER MARKET, BY RAW MATERIAL, 2022-2032 (KILOTON)
    TABLE 213. BRAZIL CARBON FIBER MARKET, BY FORM, 2022-2032 ($MILLION)
    TABLE 214. BRAZIL CARBON FIBER MARKET, BY FORM, 2022-2032 (KILOTON)
    TABLE 215. BRAZIL CARBON FIBER MARKET, BY END USE INDUSTRY, 2022-2032 ($MILLION)
    TABLE 216. BRAZIL CARBON FIBER MARKET, BY END USE INDUSTRY, 2022-2032 (KILOTON)
    TABLE 217. SAUDI ARABIA CARBON FIBER MARKET, BY TYPE, 2022-2032 ($MILLION)
    TABLE 218. SAUDI ARABIA CARBON FIBER MARKET, BY TYPE, 2022-2032 (KILOTON)
    TABLE 219. SAUDI ARABIA CARBON FIBER MARKET, BY RAW MATERIAL, 2022-2032 ($MILLION)
    TABLE 220. SAUDI ARABIA CARBON FIBER MARKET, BY RAW MATERIAL, 2022-2032 (KILOTON)
    TABLE 221. SAUDI ARABIA CARBON FIBER MARKET, BY FORM, 2022-2032 ($MILLION)
    TABLE 222. SAUDI ARABIA CARBON FIBER MARKET, BY FORM, 2022-2032 (KILOTON)
    TABLE 223. SAUDI ARABIA CARBON FIBER MARKET, BY END USE INDUSTRY, 2022-2032 ($MILLION)
    TABLE 224. SAUDI ARABIA CARBON FIBER MARKET, BY END USE INDUSTRY, 2022-2032 (KILOTON)
    TABLE 225. SOUTH AFRICA CARBON FIBER MARKET, BY TYPE, 2022-2032 ($MILLION)
    TABLE 226. SOUTH AFRICA CARBON FIBER MARKET, BY TYPE, 2022-2032 (KILOTON)
    TABLE 227. SOUTH AFRICA CARBON FIBER MARKET, BY RAW MATERIAL, 2022-2032 ($MILLION)
    TABLE 228. SOUTH AFRICA CARBON FIBER MARKET, BY RAW MATERIAL, 2022-2032 (KILOTON)
    TABLE 229. SOUTH AFRICA CARBON FIBER MARKET, BY FORM, 2022-2032 ($MILLION)
    TABLE 230. SOUTH AFRICA CARBON FIBER MARKET, BY FORM, 2022-2032 (KILOTON)
    TABLE 231. SOUTH AFRICA CARBON FIBER MARKET, BY END USE INDUSTRY, 2022-2032 ($MILLION)
    TABLE 232. SOUTH AFRICA CARBON FIBER MARKET, BY END USE INDUSTRY, 2022-2032 (KILOTON)
    TABLE 233. REST OF LAMEA CARBON FIBER MARKET, BY TYPE, 2022-2032 ($MILLION)
    TABLE 234. REST OF LAMEA CARBON FIBER MARKET, BY TYPE, 2022-2032 (KILOTON)
    TABLE 235. REST OF LAMEA CARBON FIBER MARKET, BY RAW MATERIAL, 2022-2032 ($MILLION)
    TABLE 236. REST OF LAMEA CARBON FIBER MARKET, BY RAW MATERIAL, 2022-2032 (KILOTON)
    TABLE 237. REST OF LAMEA CARBON FIBER MARKET, BY FORM, 2022-2032 ($MILLION)
    TABLE 238. REST OF LAMEA CARBON FIBER MARKET, BY FORM, 2022-2032 (KILOTON)
    TABLE 239. REST OF LAMEA CARBON FIBER MARKET, BY END USE INDUSTRY, 2022-2032 ($MILLION)
    TABLE 240. REST OF LAMEA CARBON FIBER MARKET, BY END USE INDUSTRY, 2022-2032 (KILOTON)
    TABLE 241. DOWAKSA: KEY EXECUTIVES
    TABLE 242. DOWAKSA: COMPANY SNAPSHOT
    TABLE 243. DOWAKSA: PRODUCT SEGMENTS
    TABLE 244. DOWAKSA: PRODUCT PORTFOLIO
    TABLE 245. FORMOSA EUROPE: KEY EXECUTIVES
    TABLE 246. FORMOSA EUROPE: COMPANY SNAPSHOT
    TABLE 247. FORMOSA EUROPE: PRODUCT SEGMENTS
    TABLE 248. FORMOSA EUROPE: PRODUCT PORTFOLIO
    TABLE 249. SOLVAY: KEY EXECUTIVES
    TABLE 250. SOLVAY: COMPANY SNAPSHOT
    TABLE 251. SOLVAY: PRODUCT SEGMENTS
    TABLE 252. SOLVAY: PRODUCT PORTFOLIO
    TABLE 253. TORAY INDUSTRIES, INC.: KEY EXECUTIVES
    TABLE 254. TORAY INDUSTRIES, INC.: COMPANY SNAPSHOT
    TABLE 255. TORAY INDUSTRIES, INC.: PRODUCT SEGMENTS
    TABLE 256. TORAY INDUSTRIES, INC.: PRODUCT PORTFOLIO
    TABLE 257. NIPPON STEEL CORPORATION: KEY EXECUTIVES
    TABLE 258. NIPPON STEEL CORPORATION: COMPANY SNAPSHOT
    TABLE 259. NIPPON STEEL CORPORATION: PRODUCT SEGMENTS
    TABLE 260. NIPPON STEEL CORPORATION: PRODUCT PORTFOLIO
    TABLE 261. MITSUBISHI CHEMICAL GROUP CORPORATION: KEY EXECUTIVES
    TABLE 262. MITSUBISHI CHEMICAL GROUP CORPORATION: COMPANY SNAPSHOT
    TABLE 263. MITSUBISHI CHEMICAL GROUP CORPORATION: PRODUCT SEGMENTS
    TABLE 264. MITSUBISHI CHEMICAL GROUP CORPORATION: PRODUCT PORTFOLIO
    TABLE 265. SGL CARBON: KEY EXECUTIVES
    TABLE 266. SGL CARBON: COMPANY SNAPSHOT
    TABLE 267. SGL CARBON: PRODUCT SEGMENTS
    TABLE 268. SGL CARBON: PRODUCT PORTFOLIO
    TABLE 269. TEIJIN LIMITED.: KEY EXECUTIVES
    TABLE 270. TEIJIN LIMITED.: COMPANY SNAPSHOT
    TABLE 271. TEIJIN LIMITED.: PRODUCT SEGMENTS
    TABLE 272. TEIJIN LIMITED.: PRODUCT PORTFOLIO
    TABLE 273. ZOLTEK: KEY EXECUTIVES
    TABLE 274. ZOLTEK: COMPANY SNAPSHOT
    TABLE 275. ZOLTEK: PRODUCT SEGMENTS
    TABLE 276. ZOLTEK: PRODUCT PORTFOLIO
  • LIST OF FIGURES

  • FIGURE 01. CARBON FIBER MARKET, 2022-2032
    FIGURE 02. SEGMENTATION OF CARBON FIBER MARKET, 2022-2032
    FIGURE 03. CARBON FIBER MARKET,2022-2032
    FIGURE 04. TOP INVESTMENT POCKETS IN CARBON FIBER MARKET (2023-2032)
    FIGURE 05. BARGAINING POWER OF SUPPLIERS
    FIGURE 06. BARGAINING POWER OF BUYERS
    FIGURE 07. THREAT OF SUBSTITUTION
    FIGURE 08. THREAT OF SUBSTITUTION
    FIGURE 09. COMPETITIVE RIVALRY
    FIGURE 10. GLOBAL CARBON FIBER MARKET:DRIVERS, RESTRAINTS AND OPPORTUNITIES
    FIGURE 11. PRICING ANALYSIS: CARBON FIBER MARKET 2022 AND 2032
    FIGURE 12. IMPACT OF KEY REGULATION: CARBON FIBER MARKET
    FIGURE 13. PATENT ANALYSIS BY COMPANY
    FIGURE 14. PATENT ANALYSIS BY COUNTRY
    FIGURE 15. REGULATORY GUIDELINES: CARBON FIBER MARKET
    FIGURE 16. CARBON FIBER MARKET, BY TYPE, 2022(%)
    FIGURE 17. COMPARATIVE SHARE ANALYSIS OF CARBON FIBER MARKET FOR CONTINUOUS CARBON FIBER, BY COUNTRY 2022-2032(%)
    FIGURE 18. COMPARATIVE SHARE ANALYSIS OF CARBON FIBER MARKET FOR LONG CARBON FIBER, BY COUNTRY 2022-2032(%)
    FIGURE 19. COMPARATIVE SHARE ANALYSIS OF CARBON FIBER MARKET FOR SHORT CARBON FIBER, BY COUNTRY 2022-2032(%)
    FIGURE 20. CARBON FIBER MARKET, BY RAW MATERIAL, 2022(%)
    FIGURE 21. COMPARATIVE SHARE ANALYSIS OF CARBON FIBER MARKET FOR PAN-BASED CARBON FIBER, BY COUNTRY 2022-2032(%)
    FIGURE 22. COMPARATIVE SHARE ANALYSIS OF CARBON FIBER MARKET FOR PITCH-BASED AND RAYON-BASED CARBON FIBER, BY COUNTRY 2022-2032(%)
    FIGURE 23. CARBON FIBER MARKET, BY FORM, 2022(%)
    FIGURE 24. COMPARATIVE SHARE ANALYSIS OF CARBON FIBER MARKET FOR COMPOSITE CARBON FIBER, BY COUNTRY 2022-2032(%)
    FIGURE 25. COMPARATIVE SHARE ANALYSIS OF CARBON FIBER MARKET FOR NON-COMPOSITE CARBON FIBER, BY COUNTRY 2022-2032(%)
    FIGURE 26. CARBON FIBER MARKET, BY END USE INDUSTRY, 2022(%)
    FIGURE 27. COMPARATIVE SHARE ANALYSIS OF CARBON FIBER MARKET FOR AEROSPACE AMD DFENSE, BY COUNTRY 2022-2032(%)
    FIGURE 28. COMPARATIVE SHARE ANALYSIS OF CARBON FIBER MARKET FOR SPORTS/LEISURE, BY COUNTRY 2022-2032(%)
    FIGURE 29. COMPARATIVE SHARE ANALYSIS OF CARBON FIBER MARKET FOR WIND TURBINES, BY COUNTRY 2022-2032(%)
    FIGURE 30. COMPARATIVE SHARE ANALYSIS OF CARBON FIBER MARKET FOR MOLDING AND COMPOUNDS, BY COUNTRY 2022-2032(%)
    FIGURE 31. COMPARATIVE SHARE ANALYSIS OF CARBON FIBER MARKET FOR AUTOMOTIVE, BY COUNTRY 2022-2032(%)
    FIGURE 32. COMPARATIVE SHARE ANALYSIS OF CARBON FIBER MARKET FOR PRESSURE VESSELS, BY COUNTRY 2022-2032(%)
    FIGURE 33. COMPARATIVE SHARE ANALYSIS OF CARBON FIBER MARKET FOR CIVIL ENGINEERING, BY COUNTRY 2022-2032(%)
    FIGURE 34. COMPARATIVE SHARE ANALYSIS OF CARBON FIBER MARKET FOR MARINE, BY COUNTRY 2022-2032(%)
    FIGURE 35. COMPARATIVE SHARE ANALYSIS OF CARBON FIBER MARKET FOR PULTRUSION MISC., BY COUNTRY 2022-2032(%)
    FIGURE 36. COMPARATIVE SHARE ANALYSIS OF CARBON FIBER MARKET FOR MISC. CONSUMER, BY COUNTRY 2022-2032(%)
    FIGURE 37. COMPARATIVE SHARE ANALYSIS OF CARBON FIBER MARKET FOR SAILING/YACHT BUILDING, BY COUNTRY 2022-2032(%)
    FIGURE 38. COMPARATIVE SHARE ANALYSIS OF CARBON FIBER MARKET FOR OTHERS, BY COUNTRY 2022-2032(%)
    FIGURE 39. CARBON FIBER MARKET BY REGION, 2022
    FIGURE 40. U.S. CARBON FIBER MARKET, 2022-2032 ($MILLION)
    FIGURE 41. CANADA CARBON FIBER MARKET, 2022-2032 ($MILLION)
    FIGURE 42. MEXICO CARBON FIBER MARKET, 2022-2032 ($MILLION)
    FIGURE 43. GERMANY CARBON FIBER MARKET, 2022-2032 ($MILLION)
    FIGURE 44. UK CARBON FIBER MARKET, 2022-2032 ($MILLION)
    FIGURE 45. FRANCE CARBON FIBER MARKET, 2022-2032 ($MILLION)
    FIGURE 46. ITALY CARBON FIBER MARKET, 2022-2032 ($MILLION)
    FIGURE 47. SPAIN CARBON FIBER MARKET, 2022-2032 ($MILLION)
    FIGURE 48. REST OF EUROPE CARBON FIBER MARKET, 2022-2032 ($MILLION)
    FIGURE 49. CHINA CARBON FIBER MARKET, 2022-2032 ($MILLION)
    FIGURE 50. JAPAN CARBON FIBER MARKET, 2022-2032 ($MILLION)
    FIGURE 51. INDIA CARBON FIBER MARKET, 2022-2032 ($MILLION)
    FIGURE 52. SOUTH KOREA CARBON FIBER MARKET, 2022-2032 ($MILLION)
    FIGURE 53. AUSTRALIA CARBON FIBER MARKET, 2022-2032 ($MILLION)
    FIGURE 54. REST OF ASIA-PACIFIC CARBON FIBER MARKET, 2022-2032 ($MILLION)
    FIGURE 55. BRAZIL CARBON FIBER MARKET, 2022-2032 ($MILLION)
    FIGURE 56. SAUDI ARABIA CARBON FIBER MARKET, 2022-2032 ($MILLION)
    FIGURE 57. SOUTH AFRICA CARBON FIBER MARKET, 2022-2032 ($MILLION)
    FIGURE 58. REST OF LAMEA CARBON FIBER MARKET, 2022-2032 ($MILLION)
    FIGURE 59. TOP WINNING STRATEGIES, BY YEAR
    FIGURE 60. TOP WINNING STRATEGIES, BY DEVELOPMENT
    FIGURE 61. TOP WINNING STRATEGIES, BY COMPANY
    FIGURE 62. PRODUCT MAPPING OF TOP 10 PLAYERS
    FIGURE 63. COMPETITIVE DASHBOARD
    FIGURE 64. COMPETITIVE HEATMAP: CARBON FIBER MARKET
    FIGURE 65. TOP PLAYER POSITIONING, 2022
    FIGURE 66. SOLVAY: NET SALES, 2020-2022 ($MILLION)
    FIGURE 67. SOLVAY: RESEARCH & DEVELOPMENT EXPENDITURE, 2020-2022 ($MILLION)
    FIGURE 68. SOLVAY: REVENUE SHARE BY REGION, 2022 (%)
    FIGURE 69. SOLVAY: REVENUE SHARE BY REGION, 2022 (%)
    FIGURE 70. TORAY INDUSTRIES, INC.: NET SALES, 2019-2021 ($MILLION)
    FIGURE 71. TORAY INDUSTRIES, INC.: REVENUE SHARE BY SEGMENT, 2021 (%)
    FIGURE 72. TORAY INDUSTRIES, INC.: REVENUE SHARE BY REGION, 2021 (%)
    FIGURE 73. NIPPON STEEL CORPORATION: NET SALES, 2020-2022 ($MILLION)
    FIGURE 74. NIPPON STEEL CORPORATION: RESEARCH & DEVELOPMENT EXPENDITURE, 2020-2022 ($MILLION)
    FIGURE 75. NIPPON STEEL CORPORATION: REVENUE SHARE BY REGION, 2022 (%)
    FIGURE 76. NIPPON STEEL CORPORATION: REVENUE SHARE BY REGION, 2022 (%)
    FIGURE 77. MITSUBISHI CHEMICAL GROUP CORPORATION: NET SALES, 2020-2022 ($MILLION)
    FIGURE 78. MITSUBISHI CHEMICAL GROUP CORPORATION: REVENUE SHARE BY SEGMENT, 2022 (%)
    FIGURE 79. SGL CARBON: NET REVENUE, 2020-2022 ($MILLION)
    FIGURE 80. SGL CARBON: REVENUE SHARE BY SEGMENT, 2021 (%)
    FIGURE 81. SGL CARBON: REVENUE SHARE BY REGION, 2021 (%)
    FIGURE 82. TEIJIN LIMITED.: NET SALES, 2020-2022 ($MILLION)
    FIGURE 83. TEIJIN LIMITED.: REVENUE SHARE BY SEGMENT, 2022 (%)


A carbon fiber is a long carbon strand with 5-10 m in diameter. These strands are combined with epoxy or wound or molded into shape to form various composite materials. Composite form of carbon fibers is used to develop aircraft and spacecraft parts, racing car bodies, golf club shafts, bicycle frames, fishing rods, automobile springs, sailboat masts, and other components, where a material of lightweight and high strength is needed.

Use of carbon fiber in manufacturing wind turbines has witnessed the highest growth rate globally. Carbon fiber as a reinforcement instead of glass fiber is used, owing to its superior mechanical strength without compromising its flexibility. Carbon fibers are used to produce spar caps and root end of wind blades to impart structural stability and strength by reducing the dampening.

PURCHASE OPTIONS

Call or Email us

U.S.-Canada Toll-free: +1-800-792-5285
Int'l : +1-503-894-6022
Europe : +44-845-528-1300
Email : help@alliedmarketresearch.com
 
FREQUENTLY ASKED QUESTIONS?

A. Carbon fiber is a strong and lightweight material composed of thin, strong crystalline filaments of carbon atoms. It is known for its exceptional strength-to-weight ratio, making it ideal for applications where high strength and low weight are essential.

A. Europe has accounted for thr largest regional market for carbon fiber market.

A. Governments and private enterprises are investing heavily in research and development to further improve carbon fiber properties and explore new applications. These investments have accelerated the development of advanced carbon fiber composites.

A. DowAksa, Formosa Europe, Mitsubishi Chemical Group Corporation, Nippon Steel Corporation, SGL Carbon, Solvay, TEIJIN LIMITED., TORAY INDUSTRIES, INC., ZOLTEK.

A. The carbon fiber market is segmented on the basis of raw material, type, form, end-use industry, and region. On the basis of raw material, the market is bifurcated into PAN-based carbon fiber, and pitch-based & rayon-based carbon fiber. On the basis of type, it is categorized into continuous, long, and short carbon fibers. On the basis of form the market is bifurcated into composite and non-composite carbon fibers.

A. The global carbon fiber industry generated $5.5 billion in 2022, and is estimated to reach $16 billion by 2032, witnessing a CAGR of 11.4% from 2023 to 2032.

A. Aerospace and defense sector is the leading application of carbon fiber market.

Looking for Customization?

 Customization Request

Have a Question?

 Speak with Analyst

Any Confusion?

 Inquire Before Buying

Have a glance of the Report

  Request Sample
RELATED TAGS

Purchase Full Report of
Carbon Fiber Market

Start reading instantly.
This Report and over 67,068+ more Reports, Available with Avenue Library. T&C*.

  • Online Only
  • $3,570
  • Online cloud access only
  • Restricted print, copy, paste & download
  • Read only
  • Free industry update
    (Within 180 days)
  • Free report update in next update cycle
    (Jul 2024 - Jul 2025)
  • Data Pack
  • $3,840
  • Restricted to one authorized user
  • One print only
  • Available in
    Excel
  • Free industry update
    (Within 180 days)
  •   Free report update in next update cycle
    (Jul 2024 - Jul 2025)
  • Single User
  • $5,730
  • Restricted to one authorized user
  • One print only
  • Available in
    PDF
  • Free industry update
    (Within 180 days)
  •   Free report update in next update cycle
    (Jul 2024 - Jul 2025)
  • Five Users
  • $6,450
  • Limited to five authorized users
  • Print upto five copies
  • Available in
    PDF
  • Free industry update
    (Within 180 days)
  •   Free report update in next update cycle
    (Jul 2024 - Jul 2025)
  • Enterprise
    License/PDF

  • $9,600
  • Unlimited
    within
    company/enterprise
  • Available in Excel & PDF
  • Free industry update
    (Within 180 days)
  •   Free report update in next update cycle
    (Jul 2024 - Jul 2025)
  • Library
    Membership

  • $999 $ 1,175
    Per User/ Per month/ Billed annually
  • Published Content
    E-access
  • Company Profiles
    E-access
  • Newly Added Content Access
  • 10 PDF
    Downloads
  • 5 Excel Data
    Pack Downloads
  • 250 Company Profiles PDF Downloads
  • Buy Now

*Taxes/Fees, if applicable will be added during checkout. All prices in USD

RELATED REPORTS
 

Why Allied Market Research?


Infallible Methodology

To ensure high-level data integrity, accurate analysis, and impeccable forecasts

Analyst Support

For complete satisfaction

Customization

On-demand customization of scope of the report to exactly meet your needs

TARGETED MARKET VIEW

Targeted market view to provide pertinent information and save time of readers

Get fresh content delivered

Get insights on topics that are crucial for your business. Stay abreast of your interest areas.

Get Industry Data Alerts

Why Allied Market Research?

Infallible Methodology

To ensure high-level data integrity, accurate analysis, and impeccable forecasts

Analyst Support

For complete satisfaction

Customization

On-demand customization of scope of the report to exactly meet your needs

TARGETED MARKET VIEW

Targeted market view to provide pertinent information and save time of readers