0
2023
Cardless Atm Market

Cardless ATM Market

by Type (On-site ATM, Off-site ATM, Others), by Technology (Near-field Communication (NFC), Quick Response (QR) Codes, Biometric Verification), by End User (Bank and Financial Institutions, Independent ATM Deployer): Global Opportunity Analysis and Industry Forecast, 2021-2031

Report Code: A12958
Feb 2023 | Pages: 379
Tables: 123
Charts: 73
  • Formats*:

  • pdf

    Single User License, Five User
    License & Enterprise User License

  • xls

    Data Pack Excel License

  • ppt

    It comes with the additional cost
    of $2500.00 contact sales.


Cardless ATM Market Research, 2031

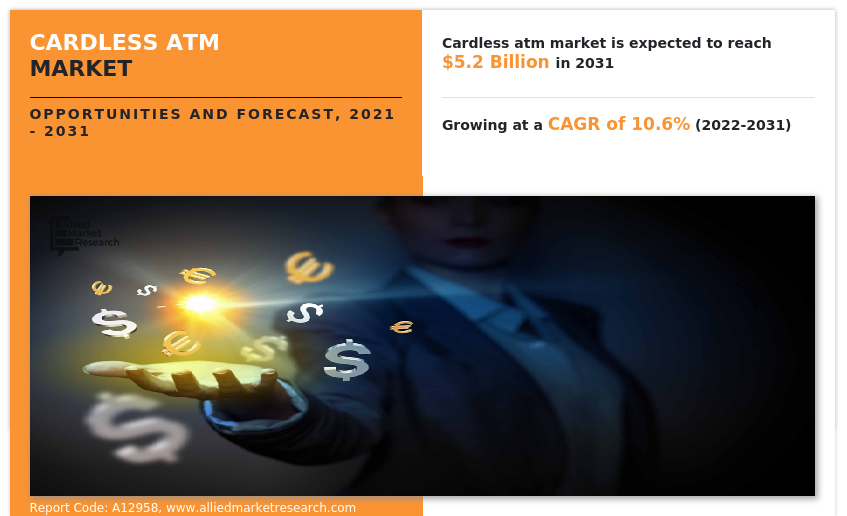
The global cardless atm market was valued at $2 billion in 2021, and is projected to reach $5.2 billion by 2031, growing at a CAGR of 10.6% from 2022 to 2031.

The COVID-19 outbreak had a negative effect on the market for smart financial hardware industry because many bank ATMs were shut down during the lockdown. The governments of every country in the world took this action to prevent new ATM installations.

Customers who use cardless ATMs can quickly set up the withdrawal on their banking app before making the withdrawal at any equipped ATM, as well as digitally locate the closest ATMs, banks, and other institutions. In addition, it reduces the cost of teller service and fraud, increasing mobile banking participation. Further, this novel approach that makes use of the existing card rails boosts efficiency and security. 
Cardless ATMs are frequently being installed in bank locations to provide convenience of cash withdrawals, deposits, and transfers. In addition, the increase in level of technical advancement in IoT technologies, such as incorporation of data analysis tools drives the cardless ATM market growth. However, the market expansion is likely to be hampered by the increase in data breaches and rise in concerns regarding data security. On the contrary, the surge in integration of next-generation smart ATMs that can be remotely maintained further encourages the demand for cardless ATMs among end-users, which is anticipated to contribute toward the growth of the cardless ATM market. 

The report focuses on growth prospects, restraints, and trends of the cardless ATM market analysis. The study provides Porter’s five forces analysis to understand the impact of various factors such as bargaining power of suppliers, competitive intensity of competitors, threat of new entrants, threat of substitutes, and bargaining power of buyers on the cardless ATM market outlook.

Cardless ATM Market

The cardless atm market is segmented into Type, Technology and End User.

Segment review

The cardless ATM market is segmented into type, technology, end user, and region. By type, the market is differentiated into on-site ATM, off-site ATM and, and others. By technology, the market is classified into near-field communication (NFC), quick response (QR) codes, and biometric verification. By end user, it is categorized in bank & financial institutions and independent ATM deployer. Region wise, the market is analyzed across North America, Europe, Asia-Pacific, and LAMEA.
Cardless ATM Market
By Type

Your browser does not support the canvas element.

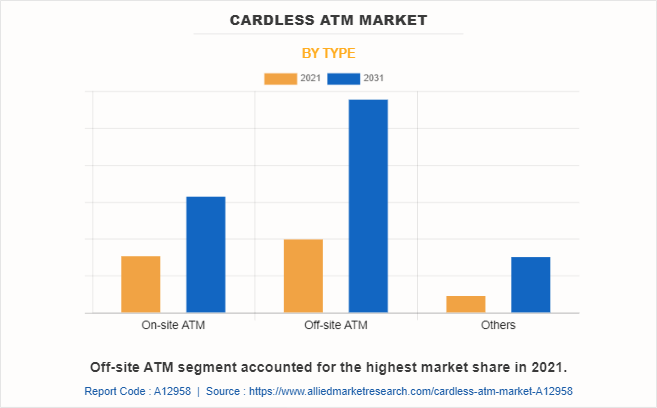
Off-site ATM segment accounted for the highest market share in 2021.

Get more information on this report : Request Sample Pages

By type, the off-site segment has acquired the highest size of cardless ATM market size in 2021. This is attributed to the fact that financial institutions and banks are planning to put more and more emphasis on modernizing their ATM infrastructure in order to increase security & convenience and provide customers with a seamless, personalized banking experience by implementing cardless ATM transactional functionalities like one-time access codes and biometric authentication.
Cardless ATM Market
By Region

2031
Asia-pacific 
North America
Europe
LAMEA

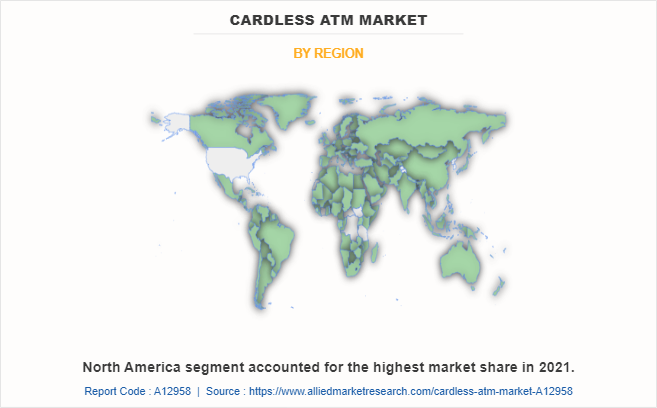
North America segment accounted for the highest market share in 2021.

Get more information on this report : Request Sample Pages

Region wise, North America dominated the cardless ATM market share in 2021. This is attributed to the region’s developed IT infrastructure as it makes easier to implement IoT-based devices in the BFSI sector, such as smart ATMs, contributing to the region’s considerable share in the cardless ATM market.

The key players operating in the global cardless ATM market include Citigroup Inc., JPMorgan Chase and Co., Wells Fargo, NCR Corporation, Fujitsu, Barclays Bank Plc, HSBC Bank A.S., GRGBanking, ICICI Bank Ltd., and Banco Santander S.A. These players have adopted various strategies to increase their market penetration and strengthen their position in the cardless ATM industry. 

Market Landscape & Trends

Industry 4.0 machines, technology, and equipment are transforming the manufacturing industry by digitalizing production processes, quality control, maintenance, and many other parts of the manufacturing ecosystem. However, there are adoption obstacles that can be resolved with financing. Further, vendor finance offers an alternative to outright purchase during the initial scoping and needs analysis phase, which can assist OEMs, systems integrators, and other technology vendors in improving their value proposition and fending off competition challenges. Vendor financing, which can include entire financial solutions, maintenance, servicing, hardware, and software, can play a significant, supplementary role in supporting the sale of digital technology and machines. Affordable payment methods might also encourage the OEM's client to think about a more specialized technical specification and comprehensive solution to meet the client's evolving needs.

Further, various key players are increasingly adopting various strategies to offer innovative solution in cardless ATM market. For instance, in July 2022, Huawei Cloud launched its Cloud Native Core Banking solution – the foundation for agile innovation of traditional banks and new digital banks.

Furthermore, various companies across U.S. are collaborating to boost prosperity in cardless ATM market. For instance, in June 2021, NEXGO and GUOXIN MICRO started a corporation and signed the strategic cooperation agreement. Two enterprises would build up a partnership in mobile communication, FinTech, digital currency, IoT, smart life, etc., for business transformation and upgrade, boost the intelligence industry.

The COVID-19 outbreak had a negative effect on the market for smart financial hardware industry because many bank ATMs were shut down during the lockdown. The governments of every country in the world took this action to prevent new ATM installations. As individuals opted for UPI and other cellular transactions during the pandemic, which had an impact on the market's growth, the restriction of the pandemic further reduced ATM transactions.

Top Impacting Factors

Increased penetration of smartphones

One of the main factors propelling the growth of the cardless automated teller machine (ATM) industry is the rising adoption of smartphones. The expanding sales of affordable smartphones have increased the penetration of smartphones in emerging nations. Furthermore, low-cost smartphones are integrated with several features that are usually available in high-end smartphones. Moreover, smartphones can link to other NFC-enabled devices in cardless ATMs via the peer-to-peer communication mechanism, allowing for the transfer of data. Further, a smartphone can read QR codes shown on an ATM screen in QR code verification. Therefore, this factor is responsible for driving the cardless ATM market’s growth.

In addition, to improve customer experience with better service, various market players are adopting different key strategies to drive their revenue growth opportunities that propel the cardless ATM market’s growth. For instance, in June 2020, Empays Payment Systems, which runs the IMT Payment System, announced a partnership with Mastercard to launch a ‘Cardless ATM powered by Mastercard’ in India. The facility helps users digitally locate the nearest enabled ATM and initiate a withdrawal by simply scanning a QR code on their mobile phone, using their banking app.

Security and convenience offered by cardless ATMs

Since consumers often demand two things that can be inherently contradictory which include increased convenience and increased security. With respect to banking, these two can be offered by banks for instance a cardless ATM. Although world economies continue to shift towards cashless transactions and digital currency and payments, cash remains the prevalent payment method across the world. Furthermore, consumers get cash from ATMs. But consumer convenience, concerns about ATM fraud devices, and the necessities of the COVID pandemic have made consumers warier about ATM usage. Cardless ATMs help resolve these issues, eliminating a card from the user’s wallet and reducing the overall amount of contact consumers have with common surfaces such as ATM screens or keypads. Therefore, these are the factors propelling the growth of the cardless ATM market.

Increase in adoption of artificial intelligence and machine learning

Increased technological advancements are going to create profitable opportunities for banks and other institutions to scale up ATM service strategies and increase business revenues. Furthermore, the incorporation of technologies such as blockchain, artificial intelligence, Internet of Things (IoT), and others will help in executing the better contactless payment.

For instance, in August 2021, National Australia Bank Limited (NAB) and Microsoft collaborated to design a proof-of-concept Automatic Teller Machine (ATM) using cloud and artificial intelligence (AI) technology. The cloud-based application, developed using Azure Cognitive Services, has been designed to improve the customer experience by removing the need for physical cards or devices to access cash from ATMs. Instead, through the concept, a customer who opted into the service would be able to withdraw cash from an ATM using facial recognition technology and a PIN. Therefore, these factors will provide major lucrative opportunities for the growth of the cardless ATM market.

KEY BENEFITS FOR STAKEHOLDERS

  • This report provides a quantitative analysis of the market segments, current trends, estimations, and dynamics of the cardless ATM market forecast from 2021 to 2031 to identify the prevailing market opportunities.
  • The market research is offered along with information related to key drivers, restraints, and opportunities of cardless ATM market overview.
  • Porter's five forces analysis highlights the potency of buyers and suppliers to enable stakeholders make profit-oriented business decisions and strengthen their supplier-buyer network.
  • In-depth analysis of the cardless ATM market segmentation assists to determine the prevailing cardless ATM market opportunity.
  • Major countries in each region are mapped according to their revenue contribution to the global market.
  • Market player positioning facilitates benchmarking and provides a clear understanding of the present position of the market players.
  • The report includes the analysis of the regional as well as global cardless ATM market trends, key players, market segments, application areas, and market growth strategies.

Cardless ATM Market Report Highlights

Aspects Details
Market Size By 2031 USD 5.2 billion
Growth Rate CAGR of 10.6%
Forecast period 2021 - 2031
Report Pages 379
By Type
  • On-site ATM
  • Off-site ATM
  • Others
By Technology
  • Near-field Communication (NFC)
  • Quick Response (QR) Codes
  • Biometric Verification
By End User
  • Bank and Financial Institutions
  • Independent ATM Deployer
By Region
  • North America  (U.S., Canada)
  • Europe  (UK, Germany, France, Italy, Spain, Rest of Europe)
  • Asia-Pacific  (China, Japan, India, Australia, South Korea, Rest of Asia-Pacific)
  • LAMEA  (Latin America, Middle East, Africa)
Key Market Players Fujitsu, Citigroup Inc., HSBC Bank A.S., ICICI Bank Ltd., JPMorgan Chase & Co., Wells Fargo, GRG Banking, Santander Group, Barclays Bank PLC, NCR Corporation
 
  • CHAPTER 1: INTRODUCTION

    • 1.1. Report description

    • 1.2. Key market segments

    • 1.3. Key benefits to the stakeholders

    • 1.4. Research Methodology

      • 1.4.1. Primary research

      • 1.4.2. Secondary research

      • 1.4.3. Analyst tools and models

  • CHAPTER 2: EXECUTIVE SUMMARY

    • 2.1. CXO Perspective

  • CHAPTER 3: MARKET OVERVIEW

    • 3.1. Market definition and scope

    • 3.2. Key findings

      • 3.2.1. Top impacting factors

      • 3.2.2. Top investment pockets

    • 3.3. Porter’s five forces analysis

      • 3.3.1. Bargaining power of suppliers

      • 3.3.2. Bargaining power of buyers

      • 3.3.3. Threat of substitutes

      • 3.3.4. Threat of new entrants

      • 3.3.5. Intensity of rivalry

    • 3.4. Market dynamics

      • 3.4.1. Drivers

        • 3.4.1.1. Increased penetration of smartphones
        • 3.4.1.2. Security and convenience offered by cardless ATMs

      • 3.4.2. Restraints

        • 3.4.2.1. Less availability of cardless ATMs
        • 3.4.2.2. Device incompatibility

      • 3.4.3. Opportunities

        • 3.4.3.1. Increase in adoption of artificial intelligence and machine learning
        • 3.4.3.2. Emergence of biometric ATMs

    • 3.5. COVID-19 Impact Analysis on the market

  • CHAPTER 4: CARDLESS ATM MARKET, BY TYPE

    • 4.1. Overview

      • 4.1.1. Market size and forecast

    • 4.2. On-site ATM

      • 4.2.1. Key market trends, growth factors and opportunities

      • 4.2.2. Market size and forecast, by region

      • 4.2.3. Market share analysis by country

    • 4.3. Off-site ATM

      • 4.3.1. Key market trends, growth factors and opportunities

      • 4.3.2. Market size and forecast, by region

      • 4.3.3. Market share analysis by country

    • 4.4. Others

      • 4.4.1. Key market trends, growth factors and opportunities

      • 4.4.2. Market size and forecast, by region

      • 4.4.3. Market share analysis by country

  • CHAPTER 5: CARDLESS ATM MARKET, BY TECHNOLOGY

    • 5.1. Overview

      • 5.1.1. Market size and forecast

    • 5.2. Near-field Communication (NFC)

      • 5.2.1. Key market trends, growth factors and opportunities

      • 5.2.2. Market size and forecast, by region

      • 5.2.3. Market share analysis by country

    • 5.3. Quick Response (QR) Codes

      • 5.3.1. Key market trends, growth factors and opportunities

      • 5.3.2. Market size and forecast, by region

      • 5.3.3. Market share analysis by country

    • 5.4. Biometric Verification

      • 5.4.1. Key market trends, growth factors and opportunities

      • 5.4.2. Market size and forecast, by region

      • 5.4.3. Market share analysis by country

  • CHAPTER 6: CARDLESS ATM MARKET, BY END USER

    • 6.1. Overview

      • 6.1.1. Market size and forecast

    • 6.2. Bank and Financial Institutions

      • 6.2.1. Key market trends, growth factors and opportunities

      • 6.2.2. Market size and forecast, by region

      • 6.2.3. Market share analysis by country

    • 6.3. Independent ATM Deployer

      • 6.3.1. Key market trends, growth factors and opportunities

      • 6.3.2. Market size and forecast, by region

      • 6.3.3. Market share analysis by country

  • CHAPTER 7: CARDLESS ATM MARKET, BY REGION

    • 7.1. Overview

      • 7.1.1. Market size and forecast By Region

    • 7.2. North America

      • 7.2.1. Key trends and opportunities

      • 7.2.2. Market size and forecast, by Type

      • 7.2.3. Market size and forecast, by Technology

      • 7.2.4. Market size and forecast, by End User

      • 7.2.5. Market size and forecast, by country

        • 7.2.5.1. U.S.
          • 7.2.5.1.1. Key market trends, growth factors and opportunities
          • 7.2.5.1.2. Market size and forecast, by Type
          • 7.2.5.1.3. Market size and forecast, by Technology
          • 7.2.5.1.4. Market size and forecast, by End User
        • 7.2.5.2. Canada
          • 7.2.5.2.1. Key market trends, growth factors and opportunities
          • 7.2.5.2.2. Market size and forecast, by Type
          • 7.2.5.2.3. Market size and forecast, by Technology
          • 7.2.5.2.4. Market size and forecast, by End User
    • 7.3. Europe

      • 7.3.1. Key trends and opportunities

      • 7.3.2. Market size and forecast, by Type

      • 7.3.3. Market size and forecast, by Technology

      • 7.3.4. Market size and forecast, by End User

      • 7.3.5. Market size and forecast, by country

        • 7.3.5.1. UK
          • 7.3.5.1.1. Key market trends, growth factors and opportunities
          • 7.3.5.1.2. Market size and forecast, by Type
          • 7.3.5.1.3. Market size and forecast, by Technology
          • 7.3.5.1.4. Market size and forecast, by End User
        • 7.3.5.2. Germany
          • 7.3.5.2.1. Key market trends, growth factors and opportunities
          • 7.3.5.2.2. Market size and forecast, by Type
          • 7.3.5.2.3. Market size and forecast, by Technology
          • 7.3.5.2.4. Market size and forecast, by End User
        • 7.3.5.3. France
          • 7.3.5.3.1. Key market trends, growth factors and opportunities
          • 7.3.5.3.2. Market size and forecast, by Type
          • 7.3.5.3.3. Market size and forecast, by Technology
          • 7.3.5.3.4. Market size and forecast, by End User
        • 7.3.5.4. Italy
          • 7.3.5.4.1. Key market trends, growth factors and opportunities
          • 7.3.5.4.2. Market size and forecast, by Type
          • 7.3.5.4.3. Market size and forecast, by Technology
          • 7.3.5.4.4. Market size and forecast, by End User
        • 7.3.5.5. Spain
          • 7.3.5.5.1. Key market trends, growth factors and opportunities
          • 7.3.5.5.2. Market size and forecast, by Type
          • 7.3.5.5.3. Market size and forecast, by Technology
          • 7.3.5.5.4. Market size and forecast, by End User
        • 7.3.5.6. Rest of Europe
          • 7.3.5.6.1. Key market trends, growth factors and opportunities
          • 7.3.5.6.2. Market size and forecast, by Type
          • 7.3.5.6.3. Market size and forecast, by Technology
          • 7.3.5.6.4. Market size and forecast, by End User
    • 7.4. Asia-Pacific

      • 7.4.1. Key trends and opportunities

      • 7.4.2. Market size and forecast, by Type

      • 7.4.3. Market size and forecast, by Technology

      • 7.4.4. Market size and forecast, by End User

      • 7.4.5. Market size and forecast, by country

        • 7.4.5.1. China
          • 7.4.5.1.1. Key market trends, growth factors and opportunities
          • 7.4.5.1.2. Market size and forecast, by Type
          • 7.4.5.1.3. Market size and forecast, by Technology
          • 7.4.5.1.4. Market size and forecast, by End User
        • 7.4.5.2. Japan
          • 7.4.5.2.1. Key market trends, growth factors and opportunities
          • 7.4.5.2.2. Market size and forecast, by Type
          • 7.4.5.2.3. Market size and forecast, by Technology
          • 7.4.5.2.4. Market size and forecast, by End User
        • 7.4.5.3. India
          • 7.4.5.3.1. Key market trends, growth factors and opportunities
          • 7.4.5.3.2. Market size and forecast, by Type
          • 7.4.5.3.3. Market size and forecast, by Technology
          • 7.4.5.3.4. Market size and forecast, by End User
        • 7.4.5.4. Australia
          • 7.4.5.4.1. Key market trends, growth factors and opportunities
          • 7.4.5.4.2. Market size and forecast, by Type
          • 7.4.5.4.3. Market size and forecast, by Technology
          • 7.4.5.4.4. Market size and forecast, by End User
        • 7.4.5.5. South Korea
          • 7.4.5.5.1. Key market trends, growth factors and opportunities
          • 7.4.5.5.2. Market size and forecast, by Type
          • 7.4.5.5.3. Market size and forecast, by Technology
          • 7.4.5.5.4. Market size and forecast, by End User
        • 7.4.5.6. Rest of Asia-Pacific
          • 7.4.5.6.1. Key market trends, growth factors and opportunities
          • 7.4.5.6.2. Market size and forecast, by Type
          • 7.4.5.6.3. Market size and forecast, by Technology
          • 7.4.5.6.4. Market size and forecast, by End User
    • 7.5. LAMEA

      • 7.5.1. Key trends and opportunities

      • 7.5.2. Market size and forecast, by Type

      • 7.5.3. Market size and forecast, by Technology

      • 7.5.4. Market size and forecast, by End User

      • 7.5.5. Market size and forecast, by country

        • 7.5.5.1. Latin America
          • 7.5.5.1.1. Key market trends, growth factors and opportunities
          • 7.5.5.1.2. Market size and forecast, by Type
          • 7.5.5.1.3. Market size and forecast, by Technology
          • 7.5.5.1.4. Market size and forecast, by End User
        • 7.5.5.2. Middle East
          • 7.5.5.2.1. Key market trends, growth factors and opportunities
          • 7.5.5.2.2. Market size and forecast, by Type
          • 7.5.5.2.3. Market size and forecast, by Technology
          • 7.5.5.2.4. Market size and forecast, by End User
        • 7.5.5.3. Africa
          • 7.5.5.3.1. Key market trends, growth factors and opportunities
          • 7.5.5.3.2. Market size and forecast, by Type
          • 7.5.5.3.3. Market size and forecast, by Technology
          • 7.5.5.3.4. Market size and forecast, by End User
  • CHAPTER 8: COMPETITIVE LANDSCAPE

    • 8.1. Introduction

    • 8.2. Top winning strategies

    • 8.3. Product Mapping of Top 10 Player

    • 8.4. Competitive Dashboard

    • 8.5. Competitive Heatmap

    • 8.6. Top player positioning, 2021

  • CHAPTER 9: COMPANY PROFILES

    • 9.1. Citigroup Inc.

      • 9.1.1. Company overview

      • 9.1.2. Key Executives

      • 9.1.3. Company snapshot

      • 9.1.4. Operating business segments

      • 9.1.5. Product portfolio

      • 9.1.6. Business performance

      • 9.1.7. Key strategic moves and developments

    • 9.2. JPMorgan Chase & Co.

      • 9.2.1. Company overview

      • 9.2.2. Key Executives

      • 9.2.3. Company snapshot

      • 9.2.4. Operating business segments

      • 9.2.5. Product portfolio

      • 9.2.6. Business performance

    • 9.3. Wells Fargo

      • 9.3.1. Company overview

      • 9.3.2. Key Executives

      • 9.3.3. Company snapshot

      • 9.3.4. Operating business segments

      • 9.3.5. Product portfolio

      • 9.3.6. Business performance

    • 9.4. NCR Corporation

      • 9.4.1. Company overview

      • 9.4.2. Key Executives

      • 9.4.3. Company snapshot

      • 9.4.4. Operating business segments

      • 9.4.5. Product portfolio

      • 9.4.6. Business performance

      • 9.4.7. Key strategic moves and developments

    • 9.5. Fujitsu

      • 9.5.1. Company overview

      • 9.5.2. Key Executives

      • 9.5.3. Company snapshot

      • 9.5.4. Operating business segments

      • 9.5.5. Product portfolio

      • 9.5.6. Business performance

    • 9.6. Barclays Bank PLC

      • 9.6.1. Company overview

      • 9.6.2. Key Executives

      • 9.6.3. Company snapshot

      • 9.6.4. Operating business segments

      • 9.6.5. Product portfolio

      • 9.6.6. Business performance

      • 9.6.7. Key strategic moves and developments

    • 9.7. HSBC Bank A.S.

      • 9.7.1. Company overview

      • 9.7.2. Key Executives

      • 9.7.3. Company snapshot

      • 9.7.4. Operating business segments

      • 9.7.5. Product portfolio

      • 9.7.6. Business performance

    • 9.8. GRG Banking

      • 9.8.1. Company overview

      • 9.8.2. Key Executives

      • 9.8.3. Company snapshot

      • 9.8.4. Operating business segments

      • 9.8.5. Product portfolio

      • 9.8.6. Business performance

    • 9.9. ICICI Bank Ltd.

      • 9.9.1. Company overview

      • 9.9.2. Key Executives

      • 9.9.3. Company snapshot

      • 9.9.4. Operating business segments

      • 9.9.5. Product portfolio

      • 9.9.6. Business performance

      • 9.9.7. Key strategic moves and developments

    • 9.10. Santander Group

      • 9.10.1. Company overview

      • 9.10.2. Key Executives

      • 9.10.3. Company snapshot

      • 9.10.4. Operating business segments

      • 9.10.5. Product portfolio

      • 9.10.6. Business performance

  • LIST OF TABLES

  • TABLE 01. GLOBAL CARDLESS ATM MARKET, BY TYPE, 2021-2031 ($MILLION)
    TABLE 02. CARDLESS ATM MARKET FOR ON-SITE ATM, BY REGION, 2021-2031 ($MILLION)
    TABLE 03. CARDLESS ATM MARKET FOR OFF-SITE ATM, BY REGION, 2021-2031 ($MILLION)
    TABLE 04. CARDLESS ATM MARKET FOR OTHERS, BY REGION, 2021-2031 ($MILLION)
    TABLE 05. GLOBAL CARDLESS ATM MARKET, BY TECHNOLOGY, 2021-2031 ($MILLION)
    TABLE 06. CARDLESS ATM MARKET FOR NEAR-FIELD COMMUNICATION (NFC), BY REGION, 2021-2031 ($MILLION)
    TABLE 07. CARDLESS ATM MARKET FOR QUICK RESPONSE (QR) CODES, BY REGION, 2021-2031 ($MILLION)
    TABLE 08. CARDLESS ATM MARKET FOR BIOMETRIC VERIFICATION, BY REGION, 2021-2031 ($MILLION)
    TABLE 09. GLOBAL CARDLESS ATM MARKET, BY END USER, 2021-2031 ($MILLION)
    TABLE 10. CARDLESS ATM MARKET FOR BANK AND FINANCIAL INSTITUTIONS, BY REGION, 2021-2031 ($MILLION)
    TABLE 11. CARDLESS ATM MARKET FOR INDEPENDENT ATM DEPLOYER, BY REGION, 2021-2031 ($MILLION)
    TABLE 12. CARDLESS ATM MARKET, BY REGION, 2021-2031 ($MILLION)
    TABLE 13. NORTH AMERICA CARDLESS ATM MARKET, BY TYPE, 2021-2031 ($MILLION)
    TABLE 14. NORTH AMERICA CARDLESS ATM MARKET, BY TECHNOLOGY, 2021-2031 ($MILLION)
    TABLE 15. NORTH AMERICA CARDLESS ATM MARKET, BY END USER, 2021-2031 ($MILLION)
    TABLE 16. NORTH AMERICA CARDLESS ATM MARKET, BY COUNTRY, 2021-2031 ($MILLION)
    TABLE 17. U.S. CARDLESS ATM MARKET, BY TYPE, 2021-2031 ($MILLION)
    TABLE 18. U.S. CARDLESS ATM MARKET, BY TECHNOLOGY, 2021-2031 ($MILLION)
    TABLE 19. U.S. CARDLESS ATM MARKET, BY END USER, 2021-2031 ($MILLION)
    TABLE 20. CANADA CARDLESS ATM MARKET, BY TYPE, 2021-2031 ($MILLION)
    TABLE 21. CANADA CARDLESS ATM MARKET, BY TECHNOLOGY, 2021-2031 ($MILLION)
    TABLE 22. CANADA CARDLESS ATM MARKET, BY END USER, 2021-2031 ($MILLION)
    TABLE 23. EUROPE CARDLESS ATM MARKET, BY TYPE, 2021-2031 ($MILLION)
    TABLE 24. EUROPE CARDLESS ATM MARKET, BY TECHNOLOGY, 2021-2031 ($MILLION)
    TABLE 25. EUROPE CARDLESS ATM MARKET, BY END USER, 2021-2031 ($MILLION)
    TABLE 26. EUROPE CARDLESS ATM MARKET, BY COUNTRY, 2021-2031 ($MILLION)
    TABLE 27. UK CARDLESS ATM MARKET, BY TYPE, 2021-2031 ($MILLION)
    TABLE 28. UK CARDLESS ATM MARKET, BY TECHNOLOGY, 2021-2031 ($MILLION)
    TABLE 29. UK CARDLESS ATM MARKET, BY END USER, 2021-2031 ($MILLION)
    TABLE 30. GERMANY CARDLESS ATM MARKET, BY TYPE, 2021-2031 ($MILLION)
    TABLE 31. GERMANY CARDLESS ATM MARKET, BY TECHNOLOGY, 2021-2031 ($MILLION)
    TABLE 32. GERMANY CARDLESS ATM MARKET, BY END USER, 2021-2031 ($MILLION)
    TABLE 33. FRANCE CARDLESS ATM MARKET, BY TYPE, 2021-2031 ($MILLION)
    TABLE 34. FRANCE CARDLESS ATM MARKET, BY TECHNOLOGY, 2021-2031 ($MILLION)
    TABLE 35. FRANCE CARDLESS ATM MARKET, BY END USER, 2021-2031 ($MILLION)
    TABLE 36. ITALY CARDLESS ATM MARKET, BY TYPE, 2021-2031 ($MILLION)
    TABLE 37. ITALY CARDLESS ATM MARKET, BY TECHNOLOGY, 2021-2031 ($MILLION)
    TABLE 38. ITALY CARDLESS ATM MARKET, BY END USER, 2021-2031 ($MILLION)
    TABLE 39. SPAIN CARDLESS ATM MARKET, BY TYPE, 2021-2031 ($MILLION)
    TABLE 40. SPAIN CARDLESS ATM MARKET, BY TECHNOLOGY, 2021-2031 ($MILLION)
    TABLE 41. SPAIN CARDLESS ATM MARKET, BY END USER, 2021-2031 ($MILLION)
    TABLE 42. REST OF EUROPE CARDLESS ATM MARKET, BY TYPE, 2021-2031 ($MILLION)
    TABLE 43. REST OF EUROPE CARDLESS ATM MARKET, BY TECHNOLOGY, 2021-2031 ($MILLION)
    TABLE 44. REST OF EUROPE CARDLESS ATM MARKET, BY END USER, 2021-2031 ($MILLION)
    TABLE 45. ASIA-PACIFIC CARDLESS ATM MARKET, BY TYPE, 2021-2031 ($MILLION)
    TABLE 46. ASIA-PACIFIC CARDLESS ATM MARKET, BY TECHNOLOGY, 2021-2031 ($MILLION)
    TABLE 47. ASIA-PACIFIC CARDLESS ATM MARKET, BY END USER, 2021-2031 ($MILLION)
    TABLE 48. ASIA-PACIFIC CARDLESS ATM MARKET, BY COUNTRY, 2021-2031 ($MILLION)
    TABLE 49. CHINA CARDLESS ATM MARKET, BY TYPE, 2021-2031 ($MILLION)
    TABLE 50. CHINA CARDLESS ATM MARKET, BY TECHNOLOGY, 2021-2031 ($MILLION)
    TABLE 51. CHINA CARDLESS ATM MARKET, BY END USER, 2021-2031 ($MILLION)
    TABLE 52. JAPAN CARDLESS ATM MARKET, BY TYPE, 2021-2031 ($MILLION)
    TABLE 53. JAPAN CARDLESS ATM MARKET, BY TECHNOLOGY, 2021-2031 ($MILLION)
    TABLE 54. JAPAN CARDLESS ATM MARKET, BY END USER, 2021-2031 ($MILLION)
    TABLE 55. INDIA CARDLESS ATM MARKET, BY TYPE, 2021-2031 ($MILLION)
    TABLE 56. INDIA CARDLESS ATM MARKET, BY TECHNOLOGY, 2021-2031 ($MILLION)
    TABLE 57. INDIA CARDLESS ATM MARKET, BY END USER, 2021-2031 ($MILLION)
    TABLE 58. AUSTRALIA CARDLESS ATM MARKET, BY TYPE, 2021-2031 ($MILLION)
    TABLE 59. AUSTRALIA CARDLESS ATM MARKET, BY TECHNOLOGY, 2021-2031 ($MILLION)
    TABLE 60. AUSTRALIA CARDLESS ATM MARKET, BY END USER, 2021-2031 ($MILLION)
    TABLE 61. SOUTH KOREA CARDLESS ATM MARKET, BY TYPE, 2021-2031 ($MILLION)
    TABLE 62. SOUTH KOREA CARDLESS ATM MARKET, BY TECHNOLOGY, 2021-2031 ($MILLION)
    TABLE 63. SOUTH KOREA CARDLESS ATM MARKET, BY END USER, 2021-2031 ($MILLION)
    TABLE 64. REST OF ASIA-PACIFIC CARDLESS ATM MARKET, BY TYPE, 2021-2031 ($MILLION)
    TABLE 65. REST OF ASIA-PACIFIC CARDLESS ATM MARKET, BY TECHNOLOGY, 2021-2031 ($MILLION)
    TABLE 66. REST OF ASIA-PACIFIC CARDLESS ATM MARKET, BY END USER, 2021-2031 ($MILLION)
    TABLE 67. LAMEA CARDLESS ATM MARKET, BY TYPE, 2021-2031 ($MILLION)
    TABLE 68. LAMEA CARDLESS ATM MARKET, BY TECHNOLOGY, 2021-2031 ($MILLION)
    TABLE 69. LAMEA CARDLESS ATM MARKET, BY END USER, 2021-2031 ($MILLION)
    TABLE 70. LAMEA CARDLESS ATM MARKET, BY COUNTRY, 2021-2031 ($MILLION)
    TABLE 71. LATIN AMERICA CARDLESS ATM MARKET, BY TYPE, 2021-2031 ($MILLION)
    TABLE 72. LATIN AMERICA CARDLESS ATM MARKET, BY TECHNOLOGY, 2021-2031 ($MILLION)
    TABLE 73. LATIN AMERICA CARDLESS ATM MARKET, BY END USER, 2021-2031 ($MILLION)
    TABLE 74. MIDDLE EAST CARDLESS ATM MARKET, BY TYPE, 2021-2031 ($MILLION)
    TABLE 75. MIDDLE EAST CARDLESS ATM MARKET, BY TECHNOLOGY, 2021-2031 ($MILLION)
    TABLE 76. MIDDLE EAST CARDLESS ATM MARKET, BY END USER, 2021-2031 ($MILLION)
    TABLE 77. AFRICA CARDLESS ATM MARKET, BY TYPE, 2021-2031 ($MILLION)
    TABLE 78. AFRICA CARDLESS ATM MARKET, BY TECHNOLOGY, 2021-2031 ($MILLION)
    TABLE 79. AFRICA CARDLESS ATM MARKET, BY END USER, 2021-2031 ($MILLION)
    TABLE 80. CITIGROUP INC.: KEY EXECUTIVES
    TABLE 81. CITIGROUP INC.: COMPANY SNAPSHOT
    TABLE 82. CITIGROUP INC.: SERVICE SEGMENTS
    TABLE 83. CITIGROUP INC.: PRODUCT PORTFOLIO
    TABLE 84. CITIGROUP INC.: KEY STRATERGIES
    TABLE 85. JPMORGAN CHASE & CO.: KEY EXECUTIVES
    TABLE 86. JPMORGAN CHASE & CO.: COMPANY SNAPSHOT
    TABLE 87. JPMORGAN CHASE & CO.: PRODUCT SEGMENTS
    TABLE 88. JPMORGAN CHASE & CO.: PRODUCT PORTFOLIO
    TABLE 89. WELLS FARGO: KEY EXECUTIVES
    TABLE 90. WELLS FARGO: COMPANY SNAPSHOT
    TABLE 91. WELLS FARGO: SERVICE SEGMENTS
    TABLE 92. WELLS FARGO: PRODUCT PORTFOLIO
    TABLE 93. NCR CORPORATION: KEY EXECUTIVES
    TABLE 94. NCR CORPORATION: COMPANY SNAPSHOT
    TABLE 95. NCR CORPORATION: PRODUCT SEGMENTS
    TABLE 96. NCR CORPORATION: PRODUCT PORTFOLIO
    TABLE 97. NCR CORPORATION: KEY STRATERGIES
    TABLE 98. FUJITSU: KEY EXECUTIVES
    TABLE 99. FUJITSU: COMPANY SNAPSHOT
    TABLE 100. FUJITSU: SERVICE SEGMENTS
    TABLE 101. FUJITSU: PRODUCT PORTFOLIO
    TABLE 102. BARCLAYS BANK PLC: KEY EXECUTIVES
    TABLE 103. BARCLAYS BANK PLC: COMPANY SNAPSHOT
    TABLE 104. BARCLAYS BANK PLC: SERVICE SEGMENTS
    TABLE 105. BARCLAYS BANK PLC: PRODUCT PORTFOLIO
    TABLE 106. BARCLAYS BANK PLC: KEY STRATERGIES
    TABLE 107. HSBC BANK A.S.: KEY EXECUTIVES
    TABLE 108. HSBC BANK A.S.: COMPANY SNAPSHOT
    TABLE 109. HSBC BANK A.S.: SERVICE SEGMENTS
    TABLE 110. HSBC BANK A.S.: PRODUCT PORTFOLIO
    TABLE 111. GRG BANKING: KEY EXECUTIVES
    TABLE 112. GRG BANKING: COMPANY SNAPSHOT
    TABLE 113. GRG BANKING: SERVICE SEGMENTS
    TABLE 114. GRG BANKING: PRODUCT PORTFOLIO
    TABLE 115. ICICI BANK LTD.: KEY EXECUTIVES
    TABLE 116. ICICI BANK LTD.: COMPANY SNAPSHOT
    TABLE 117. ICICI BANK LTD.: SERVICE SEGMENTS
    TABLE 118. ICICI BANK LTD.: PRODUCT PORTFOLIO
    TABLE 119. ICICI BANK LTD.: KEY STRATERGIES
    TABLE 120. SANTANDER GROUP: KEY EXECUTIVES
    TABLE 121. SANTANDER GROUP: COMPANY SNAPSHOT
    TABLE 122. SANTANDER GROUP: SERVICE SEGMENTS
    TABLE 123. SANTANDER GROUP: PRODUCT PORTFOLIO
  • LIST OF FIGURES

  • FIGURE 01. CARDLESS ATM MARKET, 2021-2031
    FIGURE 02. SEGMENTATION OF CARDLESS ATM MARKET, 2021-2031
    FIGURE 03. TOP INVESTMENT POCKETS IN CARDLESS ATM MARKET (2022-2031)
    FIGURE 04. HIGH TO MODERATE BARGAINING POWER OF SUPPLIERS
    FIGURE 05. HIGH TO LOW BARGAINING POWER OF BUYERS
    FIGURE 06. MODERATE TO HIGH THREAT OF SUBSTITUTES
    FIGURE 07. HIGH THREAT OF NEW ENTRANTS
    FIGURE 08. MODERATE TO HIGH INTENSITY OF RIVALRY
    FIGURE 09. DRIVERS, RESTRAINTS AND OPPORTUNITIES: GLOBALCARDLESS ATM MARKET
    FIGURE 10. CARDLESS ATM MARKET, BY TYPE, 2021(%)
    FIGURE 11. COMPARATIVE SHARE ANALYSIS OF CARDLESS ATM MARKET FOR ON-SITE ATM, BY COUNTRY 2021-2031(%)
    FIGURE 12. COMPARATIVE SHARE ANALYSIS OF CARDLESS ATM MARKET FOR OFF-SITE ATM, BY COUNTRY 2021-2031(%)
    FIGURE 13. COMPARATIVE SHARE ANALYSIS OF CARDLESS ATM MARKET FOR OTHERS, BY COUNTRY 2021-2031(%)
    FIGURE 14. CARDLESS ATM MARKET, BY TECHNOLOGY, 2021(%)
    FIGURE 15. COMPARATIVE SHARE ANALYSIS OF CARDLESS ATM MARKET FOR NEAR-FIELD COMMUNICATION (NFC), BY COUNTRY 2021-2031(%)
    FIGURE 16. COMPARATIVE SHARE ANALYSIS OF CARDLESS ATM MARKET FOR QUICK RESPONSE (QR) CODES, BY COUNTRY 2021-2031(%)
    FIGURE 17. COMPARATIVE SHARE ANALYSIS OF CARDLESS ATM MARKET FOR BIOMETRIC VERIFICATION, BY COUNTRY 2021-2031(%)
    FIGURE 18. CARDLESS ATM MARKET, BY END USER, 2021(%)
    FIGURE 19. COMPARATIVE SHARE ANALYSIS OF CARDLESS ATM MARKET FOR BANK AND FINANCIAL INSTITUTIONS, BY COUNTRY 2021-2031(%)
    FIGURE 20. COMPARATIVE SHARE ANALYSIS OF CARDLESS ATM MARKET FOR INDEPENDENT ATM DEPLOYER, BY COUNTRY 2021-2031(%)
    FIGURE 21. CARDLESS ATM MARKET BY REGION, 2021
    FIGURE 22. U.S. CARDLESS ATM MARKET, 2021-2031 ($MILLION)
    FIGURE 23. CANADA CARDLESS ATM MARKET, 2021-2031 ($MILLION)
    FIGURE 24. UK CARDLESS ATM MARKET, 2021-2031 ($MILLION)
    FIGURE 25. GERMANY CARDLESS ATM MARKET, 2021-2031 ($MILLION)
    FIGURE 26. FRANCE CARDLESS ATM MARKET, 2021-2031 ($MILLION)
    FIGURE 27. ITALY CARDLESS ATM MARKET, 2021-2031 ($MILLION)
    FIGURE 28. SPAIN CARDLESS ATM MARKET, 2021-2031 ($MILLION)
    FIGURE 29. REST OF EUROPE CARDLESS ATM MARKET, 2021-2031 ($MILLION)
    FIGURE 30. CHINA CARDLESS ATM MARKET, 2021-2031 ($MILLION)
    FIGURE 31. JAPAN CARDLESS ATM MARKET, 2021-2031 ($MILLION)
    FIGURE 32. INDIA CARDLESS ATM MARKET, 2021-2031 ($MILLION)
    FIGURE 33. AUSTRALIA CARDLESS ATM MARKET, 2021-2031 ($MILLION)
    FIGURE 34. SOUTH KOREA CARDLESS ATM MARKET, 2021-2031 ($MILLION)
    FIGURE 35. REST OF ASIA-PACIFIC CARDLESS ATM MARKET, 2021-2031 ($MILLION)
    FIGURE 36. LATIN AMERICA CARDLESS ATM MARKET, 2021-2031 ($MILLION)
    FIGURE 37. MIDDLE EAST CARDLESS ATM MARKET, 2021-2031 ($MILLION)
    FIGURE 38. AFRICA CARDLESS ATM MARKET, 2021-2031 ($MILLION)
    FIGURE 39. TOP WINNING STRATEGIES, BY YEAR
    FIGURE 40. TOP WINNING STRATEGIES, BY DEVELOPMENT
    FIGURE 41. TOP WINNING STRATEGIES, BY COMPANY
    FIGURE 42. PRODUCT MAPPING OF TOP 10 PLAYERS
    FIGURE 43. COMPETITIVE DASHBOARD
    FIGURE 44. COMPETITIVE HEATMAP: CARDLESS ATM MARKET
    FIGURE 45. TOP PLAYER POSITIONING, 2021
    FIGURE 46. CITIGROUP INC.: NET REVENUE, 2019-2021 ($MILLION)
    FIGURE 47. CITIGROUP INC.: REVENUE SHARE BY SEGMENT, 2021 (%)
    FIGURE 48. CITIGROUP INC.: REVENUE SHARE BY REGION, 2021 (%)
    FIGURE 49. JPMORGAN CHASE & CO.: NET REVENUE, 2019-2021 ($MILLION)
    FIGURE 50. WELLS FARGO: NET REVENUE, 2019-2021 ($MILLION)
    FIGURE 51. WELLS FARGO: REVENUE SHARE BY SEGMENT, 2021 (%)
    FIGURE 52. NCR CORPORATION: NET REVENUE, 2019-2021 ($MILLION)
    FIGURE 53. NCR CORPORATION: RESEARCH & DEVELOPMENT EXPENDITURE, 2019-2021
    FIGURE 54. NCR CORPORATION: REVENUE SHARE BY SEGMENT, 2021 (%)
    FIGURE 55. NCR CORPORATION: REVENUE SHARE BY REGION, 2021 (%)
    FIGURE 56. FUJITSU: NET REVENUE, 2019-2021 ($MILLION)
    FIGURE 57. FUJITSU: REVENUE SHARE BY SEGMENT, 2021 (%)
    FIGURE 58. FUJITSU: REVENUE SHARE BY REGION, 2021 (%)
    FIGURE 59. BARCLAYS BANK PLC: NET REVENUE, 2019-2021 ($MILLION)
    FIGURE 60. BARCLAYS BANK PLC: REVENUE SHARE BY SEGMENT, 2021 (%)
    FIGURE 61. BARCLAYS BANK PLC: REVENUE SHARE BY REGION, 2021 (%)
    FIGURE 62. HSBC BANK A.S.: NET REVENUE, 2019-2021 ($MILLION)
    FIGURE 63. HSBC BANK A.S.: REVENUE SHARE BY SEGMENT, 2021 (%)
    FIGURE 64. HSBC BANK A.S.: REVENUE SHARE BY REGION, 2021 (%)
    FIGURE 65. GRG BANKING: NET SALES, 2019-2021 ($MILLION)
    FIGURE 66. GRG BANKING: REVENUE SHARE BY SEGMENT, 2021 (%)
    FIGURE 67. GRG BANKING: REVENUE SHARE BY REGION, 2021 (%)
    FIGURE 68. ICICI BANK LTD.: NET REVENUE, 2019-2021 ($MILLION)
    FIGURE 69. ICICI BANK LTD.: REVENUE SHARE BY SEGMENT, 2021 (%)
    FIGURE 70. ICICI BANK LTD.: REVENUE SHARE BY REGION, 2021 (%)
    FIGURE 71. SANTANDER GROUP: NET REVENUE, 2019-2021 ($MILLION)
    FIGURE 72. SANTANDER GROUP: REVENUE SHARE BY SEGMENT, 2021 (%)
    FIGURE 73. SANTANDER GROUP: REVENUE SHARE BY REGION, 2021 (%)


One of the major factors propelling the growth of the cardless ATM industry is the rise in use of smartphones. The expanding sales of inexpensive smartphones have increased the penetration of smartphones in emerging nations. Further, NFC chips allow smartphones to exchange data with other NFC-enabled devices in cardless ATMs when using the peer-to-peer communication architecture. Furthermore, a smartphone may scan QR codes on the ATM screen for QR code verification. These factors are anticipated to propel the expansion of the global cardless ATM market during the projected period.

The COVID-19 outbreak has a significant impact on the cardless ATM market and has accelerated the adoption of the smart technology in BFSI industry. Moreover, the adoption of cardless ATM technology increased among medium and small-sized banks, during this global health crisis. This, as a result promoted the demand for cardless ATM technologies, thereby accelerating the revenue growth.

The cardless ATM market is fragmented with the presence of regional vendors such as Intel Corporation, NCR Corporation, Diebold Nixdorf, Incorporated, Fujitsu, IMS Evolve, InHand Networks, Miles Technologies, Digi International Inc., Microchip Technology Inc., and OptConnect.com. Major players operating in this market have witnessed significant adoption of strategies that include business expansion and partnership to reduce supply and demand gap. Major players are collaborating their product portfolio to provide differentiated and innovative products with increase in awareness & demand for cardless ATM across the globe.

PURCHASE OPTIONS

Call or Email us

U.S.-Canada Toll-free: +1-800-792-5285
Int'l : +1-503-894-6022
Europe : +44-845-528-1300
Email : help@alliedmarketresearch.com
 
FREQUENTLY ASKED QUESTIONS?

A. The cardless ATM market is estimated to grow at a CAGR of 10.6% from 2022 to 2031.

A. The cardless ATM market is projected to reach $5.20 billion by 2031.

A. Increased penetration of smartphones, security and convenience offered by cardless ATMs and increase in adoption of artificial intelligence and machine learning majorly contribute toward the growth of the market.

A. The key players profiled in the report include reinsurance market analysis includes top companies operating in the market such as Citigroup Inc., JPMorgan Chase and Co., Wells Fargo, NCR Corporation, Fujitsu, Barclays Bank Plc, HSBC Bank A.S., GRGBanking, ICICI Bank Ltd., and Banco Santander S.A.

A. The key growth strategies of cardless ATM market players include product portfolio expansion, mergers & acquisitions, agreements, geographical expansion, and collaborations.

Looking for Customization?

 Customization Request

Have a Question?

 Speak with Analyst

Any Confusion?

 Inquire Before Buying

Have a glance of the Report

  Request Sample
RELATED TAGS

Purchase Full Report of
Cardless Atm Market

Start reading instantly.
This Report and over 67,404+ more Reports, Available with Avenue Library. T&C*.

  • Online Only
  • $3,570
  • Online cloud access only
  • Restricted print, copy, paste & download
  • Read only
  • Free industry update
    (Within 180 days)
  • Free report update in next update cycle
    (Feb 2024 - Feb 2025)
  • Data Pack
  • $3,840
  • Restricted to one authorized user
  • One print only
  • Available in
    Excel
  • Free industry update
    (Within 180 days)
  •   Free report update in next update cycle
    (Feb 2024 - Feb 2025)
  • Single User
  • $5,730
  • Restricted to one authorized user
  • One print only
  • Available in
    PDF
  • Free industry update
    (Within 180 days)
  •   Free report update in next update cycle
    (Feb 2024 - Feb 2025)
  • Five Users
  • $6,450
  • Limited to five authorized users
  • Print upto five copies
  • Available in
    PDF
  • Free industry update
    (Within 180 days)
  •   Free report update in next update cycle
    (Feb 2024 - Feb 2025)
  • Enterprise
    License/PDF

  • $9,600
  • Unlimited
    within
    company/enterprise
  • Available in Excel & PDF
  • Free industry update
    (Within 180 days)
  •   Free report update in next update cycle
    (Feb 2024 - Feb 2025)
  • Library
    Membership

  • $999 $ 1,175
    Per User/ Per month/ Billed annually
  • Published Content
    E-access
  • Company Profiles
    E-access
  • Newly Added Content Access
  • 10 PDF
    Downloads
  • 5 Excel Data
    Pack Downloads
  • 250 Company Profiles PDF Downloads
  • Buy Now

*Taxes/Fees, if applicable will be added during checkout. All prices in USD

RELATED REPORTS
 

Why Allied Market Research?


Infallible Methodology

To ensure high-level data integrity, accurate analysis, and impeccable forecasts

Analyst Support

For complete satisfaction

Customization

On-demand customization of scope of the report to exactly meet your needs

TARGETED MARKET VIEW

Targeted market view to provide pertinent information and save time of readers

Get fresh content delivered

Get insights on topics that are crucial for your business. Stay abreast of your interest areas.

Get Industry Data Alerts

Why Allied Market Research?

Infallible Methodology

To ensure high-level data integrity, accurate analysis, and impeccable forecasts

Analyst Support

For complete satisfaction

Customization

On-demand customization of scope of the report to exactly meet your needs

TARGETED MARKET VIEW

Targeted market view to provide pertinent information and save time of readers