
Carpet Tiles Market Research, 2032
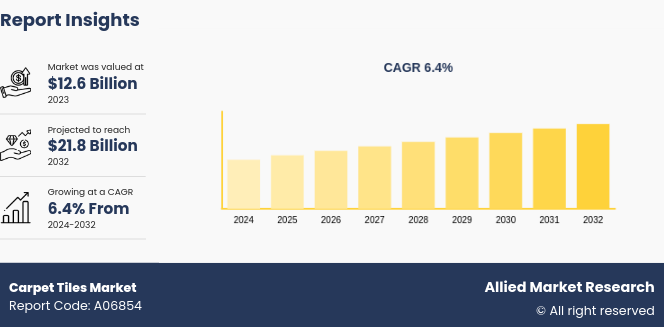
The global carpet tiles market was valued at $12.6 billion in 2023, and is projected to reach $21.8 billion by 2032, growing at a CAGR of 6.4% from 2024 to 2032.
Market Introduction and Definition
Carpet Tiles industry refers to the segment of the flooring industry that specializes in modular carpeting solutions. Carpet tiles, also known as carpet squares or modular carpets, are individual sections of carpeting material typically sized in squares, ranging from 12 inches by 12 inches to 24 inches by 24 inches. These tiles are installed by fixing them to the floor surface using adhesive or tackifier, allowing for easy installation and replacement. The carpet tiles market caters to both residential and commercial applications, offering a wide range of designs, colors, patterns, and materials to suit various aesthetic preferences and functional requirements. Carpet tiles are known for their versatility, durability, and ease of maintenance, making them popular choices for high-traffic areas such as offices, retail spaces, schools, and healthcare facilities. In addition, carpet tiles are often favored for their ability to withstand spills, stains, and heavy wear, as well as their acoustic and thermal insulation properties. The carpet tiles market plays a significant role in the flooring industry, providing consumers with practical and stylish solutions for their flooring needs.
Key Takeaways
The carpet tiles market study covers 20 countries. The research includes a segment analysis of each country in terms of value for the projected period.
More than 1, 500 product literatures, industry releases, annual reports, and other such documents of major energy storage system industry participants along with authentic industry journals, trade associations' releases, and government websites have been reviewed for generating high-value industry insights.
The study integrated high-quality data, professional opinions and analysis, and critical independent perspectives. The research approach is intended to provide a balanced view of global markets and assist stakeholders in making educated decisions to achieve their most ambitious growth objectives.
Key market dynamics
The carpet tiles market growth is driven by the rise in number of commercial construction projects, including office buildings, retail spaces, hospitality establishments, and healthcare facilities. Carpet tiles are preferred in these settings due to their durability, ease of maintenance, and ability to withstand heavy foot traffic. As the commercial construction sector continues to expand globally, the demand for carpet tiles is expected to rise, driving market growth. Moreover, there is a surge in emphasis on interior design and aesthetics in both residential and commercial spaces. Carpet tiles offer versatility in design, allowing customization and creative layouts to achieve desired aesthetics. With consumers seeking unique and visually appealing flooring solutions, the demand for carpet tiles as a design element is increasing, particularly in industries such as hospitality, retail, and education, which has increased Carpet Tiles Market Share.
However, the carpet tiles market faces competition from other flooring options such as broadloom carpets, hardwood flooring, vinyl flooring, and ceramic tiles. Consumers opt for these alternatives based on factors such as cost, aesthetics, durability, or ease of installation, posing a challenge to the growth of the carpet tiles market. Economic downturns and fluctuations in construction activity can adversely affect the carpet tiles market. During periods of economic uncertainty, commercial construction projects may be delayed or scaled back, leading to reduced demand for carpet tiles in the construction sector.
Furthermore, while carpet tiles are traditionally associated with commercial spaces, there is an opportunity for growth in the residential market. With increase in awareness of the benefits of carpet tiles, such as ease of installation, maintenance, and customization, consumers explore their use in residential settings, including living rooms, bedrooms, and basements. In addition, according to Carpet Tiles Market Forecast technological advancements and innovations in manufacturing processes are creating opportunities for the carpet tiles market. Manufacturers are developing sustainable and eco-friendly carpet tiles using recycled materials and environmentally friendly production methods, catering to the growing demand for sustainable flooring solutions. In addition, advancements in design technology are enabling the creation of more intricate and customizable carpet tile designs, expanding the range of options available to consumers, increased Carpet Tiles Market Demand.
PESTEL Analysis of Carpet Tiles Market
Political Factors:
Government regulations: Regulations related to environmental standards, trade policies, and manufacturing practices can impact the carpet tiles market. Compliance with regulations on sustainability and emissions may influence product development and manufacturing processes.
Political stability: Political stability in key manufacturing and consumer markets can affect supply chains and trade relationships, impacting the availability and pricing of carpet tiles.
Economic Factors:
Economic growth: Economic conditions, including GDP growth, inflation rates, and consumer spending, influence demand for construction projects and renovation activities, which in turn impact the carpet tiles market.
Interest rates: Changes in interest rates can affect construction financing and investment decisions, potentially impacting demand for carpet tiles in both residential and commercial sectors.
Social Factors:
Changing consumer preferences: Shifting trends in interior design, sustainability, and lifestyle preferences influence consumer demand for carpet tiles. Preferences for customizable designs, eco-friendly materials, and ease of maintenance can shape product development and marketing strategies.
Demographic trends: Factors such as population growth, urbanization, and aging populations can impact the demand for residential and commercial spaces, driving demand for carpet tiles in housing, offices, healthcare facilities, and other sectors.
Technological Factors:
Advancements in manufacturing technology: Innovations in manufacturing processes, materials, and design technologies can lead to the development of more sustainable, durable, and customizable carpet tiles, driving market growth and competitiveness.
Digitalization and e-commerce: The adoption of digital technologies and online sales channels can influence consumer purchasing behavior, distribution networks, and marketing strategies in the carpet tiles market.
Environmental Factors:
Sustainability concerns: Increasing awareness of environmental issues and regulations related to emissions, waste management, and resource conservation drive demand for eco-friendly and sustainable carpet tiles made from recycled materials and manufactured using environmentally friendly processes.
Climate change: Climate-related factors such as extreme weather events and temperature fluctuations can impact construction activities, building design requirements, and the choice of flooring materials, affecting the demand for carpet tiles in different regions.
Legal Factors:
Health and safety regulations: Compliance with health and safety standards, such as indoor air quality regulations and workplace safety requirements, may influence product specifications and installation practices in the carpet tiles market.
Intellectual property rights: Protection of intellectual property rights, including patents and trademarks, can impact innovation and competition among carpet tile manufacturers.
Market Segmentation
The carpet tiles market is segmented into type, application, distribution channel, and region. On the basis of type, it is bifurcated into square and rectangle. On the basis of application, it is divided into residential, commercial, and others. On the basis of distribution channel, it is categorized into retail store and online store. Region wise, the market is analyzed across North America, Europe, Asia-Pacific, and LAMEA.
Regional/Country Market Outlook
According to the Economics Times the UK, Continental Europe, the Middle East and Africa, hold a 40 per cent market share in the global market for carpet tiles. They are the largest commercial floor covering company in the world, with has over 28 fully-fledged manufacturing sites in U.S, Canada, UK, Holland, Australia, and Thailand. The interface products are sold in over 100 countries around the world.
According to Economics Times, the carpet tile commercial can be used in any non-residential building, regardless of type, whose floor area is less than 25, 000 square feet. The Contract segment of Commercial market involve buildings of 25, 000 square feet floor area or greater. Although the Main Street market varies by size per building type, on average, the Main Street market is 25% to 30% of the total commercial market in the U.S., as this is the average percent of all non-residential buildings that are less than 25, 000 square feet floor area. The sales which are made direct to commercial building owners (not via commercial flooring contractors or retailers) are considered part of the Contract Commercial market.
Industry Trends:
The Carpet Tiles industry has experienced several notable industry trends that shape the landscape of the flooring industry. One prominent trend is the increase in emphasis on sustainability and eco-friendly materials. As environmental concerns become more prevalent, consumers seek flooring options that minimize their carbon footprint and environmental impact. In response, carpet tile manufacturers incorporate recycled materials, such as post-consumer nylon and PET fibers, into their products. In addition, eco-friendly backing materials made from renewable resources are used to enhance the sustainability profile of carpet tiles. Carpet manufacturing in India is focused on export markets. 80% of the carpets produced in India is exported worldwide. Currently India exports to more than 70 countries in the world. Leading importers are U.S., Germany, Canada, Australia, South Africa, France, Italy, and Brazil. U.S. alone has 48.84% share out of total export. Moreover, manufacturers are adopting sustainable manufacturing processes and obtaining certifications from third-party organizations to validate their environmental claims.
Consumers look for flooring solutions that allow them to express their individual style and creativity. Carpet tiles offer versatility in design, with a wide range of options in terms of patterns, colors, textures, and shapes. Modular carpet tiles, in particular, enable easy mixing and matching to create unique and personalized flooring layouts, which has increased Carpet Tiles Market Size. This trend towards customization is driven by the desire for interiors that are visually appealing, functional, and reflective of the user's personality or brand identity. As a result, carpet tile manufacturers are investing in innovative design technologies and expanding their product offerings to cater to diverse aesthetic preferences and design requirements in both residential and commercial settings.
Competitive Landscape
The major players operating in the carpet tiles market are Suminoe Textile Co., Ltd., Tapibel, Nabel Ceramics, SUMINOE Co.Ltd., Hunan Tianxin Technology Co.Ltd., Japan Carpet Co., Ltd. (JCC) , Beaulieu, EO Technology Co. Ltd., Shaw Industries, Wuxi Diamond Carpet Manufacturing Co., Ltd. Other players in the carpet tiles market include Interface, Inc., Shaw Industries Group, Inc., Tarkett Group, Milliken & Company, Forbo Holding AG, and Balta Group.
Recent Key Strategies and Developments
In June 2021, Suminoe Textile Co., Ltd announced that it is expected to commence the production of "ECOS, " a new line of carpet tiles with a significantly higher recycled content rate than previous products. The recycled materials used in ECOS tiles are jointly developed in conjunction with Sumitomo Corporation. The new line will help close the materials loop in carpet tile production.
In March 2022, Milliken & Company announced the launch of its textile business’s first-ever brand campaign, “Anything. Everywhere.” Anchored by a new landing page and brand video, the campaign explores the many roles’ textiles play in everyday life. This campaign is expected to expand the consumer reach.
Key Sources Referred
Milliken & Company Textile Business
Sumitomo Corporation
Economic Times ???????
Key Benefits For Stakeholders
- This report provides a quantitative analysis of the market segments, current trends, estimations, and dynamics of the carpet tiles market analysis from 2023 to 2032 to identify the prevailing carpet tiles market opportunities.
- The market research is offered along with information related to key drivers, restraints, and opportunities.
- Porter's five forces analysis highlights the potency of buyers and suppliers to enable stakeholders make profit-oriented business decisions and strengthen their supplier-buyer network.
- In-depth analysis of the carpet tiles market segmentation assists to determine the prevailing market opportunities.
- Major countries in each region are mapped according to their revenue contribution to the Global market.
- Market player positioning facilitates benchmarking and provides a clear understanding of the present position of the market players.
- The report includes the analysis of the regional as well as Global carpet tiles market trends, key players, market segments, application areas, and market growth strategies.
Carpet Tiles Market Report Highlights
| Aspects | Details |
| Market Size By 2032 | USD 21.8 Billion |
| Growth Rate | CAGR of 6.4% |
| Forecast period | 2024 - 2032 |
| Report Pages | 288 |
| By Type |
|
| By Application |
|
| By Distribution Channel |
|
| By Region |
|
| Key Market Players | Japan Carpet Co., Ltd, Suminoe Textile Co., Ltd., EO Technology Co. Ltd, Nabel Ceramics, Beaulieu, Wuxi Diamond Carpet Manufacturing Co., Shaw Industries Group, Tapibel, Shaw Industries, Hunan Tianxin Technology Co.Ltd |
The global carpet tiles market was valued at $12.6 billion in 2023, and is projected to reach $21.8 Billion by 2032, growing at a CAGR of 6.4% from 2024 to 2032
Consumers and businesses are increasingly seeking eco-friendly carpet tiles made from recycled materials, such as plastic bottles and reclaimed fibers.
The leading application of the carpet tiles market is in the commercial sector.
The major players operating in the carpet tiles market are Suminoe Textile Co., Ltd., Tapibel, Nabel Ceramics, SUMINOE Co.Ltd., Hunan Tianxin Technology Co.Ltd., Japan Carpet Co., Ltd. (JCC) , Beaulieu, EO Technology Co. Ltd., Shaw Industries, Wuxi Diamond Carpet Manufacturing Co., Ltd. Other players in the carpet tiles market include Interface, Inc., Shaw Industries Group, Inc., Tarkett Group, Milliken & Company, Forbo Holding AG, and Balta Group.
The largest regional market for carpet tiles is North America.
Loading Table Of Content...

