
Cat Litter Market Summary, 2035
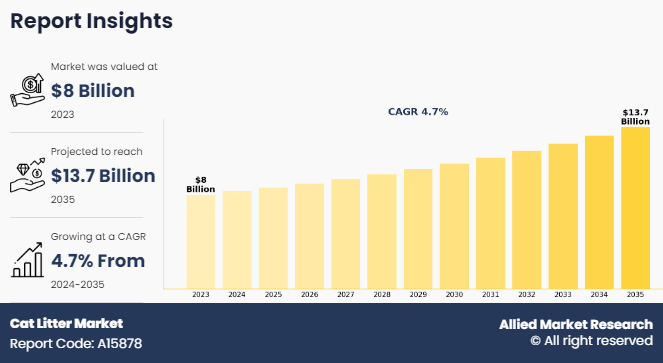
The global cat litter market size was valued at $8 billion in 2023, and is projected to reach $13.7 billion by 2035, growing at a CAGR of 4.7% from 2024 to 2035. The growth of the cat litter market is primarily driven by rising pet ownership rates, urbanization leading to smaller living spaces, heightened awareness of pet health and hygiene, and innovation in eco-friendly and specialized litter formulations.
Cat litter is a highly absorbent material used to facilitate the management of cat waste in indoor environments. Its primary purpose is to provide a sanitary and convenient solution for cats to urinate and defecate within the confines of a litter box. Cat litter is typically made up of various materials, including clay, silica gel, natural plant fibers, recycled paper, or biodegradable substances. These materials are chosen for their absorbency, odor control properties, and ease of disposal. Cat litter is essential for maintaining cleanliness and hygiene in homes with cats, as it helps contain odors and prevents the spread of waste and contributes to a healthier and more pleasant living environment for both pets and their owners.
Key Takeaways of Cat Litter Market Report
- By type, the clumping segment was the highest revenue contributor to the cat litter market in 2023.
- As per raw material, clay segment was the largest segment in the global cat litter market during the forecast period.
- Depending on distribution channel, hypermarkets/supermarkets segment was the largest segment in 2023.
- Region-wise, North America was the highest revenue contributor in 2023.
Market Dynamics
Pet ownership trend is anticipated to drive the demand for the cat litter market. As the number of households adopting cats as pets continues to rise, so does the need for effective and convenient solutions for managing cat waste. Cats are among the most popular pets globally, and their relatively low maintenance compared to dogs makes them particularly attractive to urban dwellers and individuals with busy lifestyles. With more people welcoming cats into their homes, the demand for cat litter products experiences a corresponding surge, as pet owners seek ways to maintain cleanliness and hygiene within their living spaces.
In addition, as pet ownership becomes increasingly prevalent across various demographic groups, including families, singles, and seniors, the market for cat litter expands accordingly. The human-animal bond, characterized by the growing inclination to treat pets as integral members of the family and further boosts the demand for high-quality cat litter products. Pet owners prioritize the comfort and well-being of their feline companions, driving them to invest in premium litter options that offer superior odor control, clumping ability, and environmental sustainability. Furthermore, pet ownership trends drive the growth of the cat litter market by creating a sustained demand for products that cater to the needs of both pets and their owners.
Urbanization significantly drives the cat litter market demand by reshaping the living environments where pets, particularly cats, reside. As urban areas continue to expand and populations concentrate in cities, the availability of outdoor space for pets to roam and relieve themselves diminishes. Many urban pet owners are constrained by limited access to yards or green spaces, opt for indoor pet solutions, including cat ownership. In these urban locations, cat litter becomes an essential component for managing pet waste conveniently within the confines of apartments, condominiums, and other small living spaces. Thus, the densification of urban areas directly correlates with an increased demand for cat litter products as a practical solution for pet waste management in constrained environments.
Cats are known for their relatively independent nature and suitability to indoor living and are particularly favored by urban residents seeking animal companionship. As the urban population grows, so does the demand for pet care products, including cat litter, to cater the needs of these urban pet owners. Furthermore, urbanization acts as a significant driver for the cat litter market by creating a growing consumer base of urban pet owners in need of convenient and effective solutions for managing pet waste in urban environments. Thus, all these factors contribute to the cat litter market growth.
Environmental concerns present a significant restraint on the cat litter market, particularly for products made from non-biodegradable materials such as clay. Traditional clay-based cat litter is often derived from strip-mined clay, which leads to habitat destruction, soil erosion, and landscape alteration. Moreover, clay litter is non-biodegradable, as it does not break down naturally in landfills and contributes to long-term environmental pollution. As awareness of these issues grows, consumers are increasingly seeking eco-friendly alternatives to minimize their ecological footprint and reduce demand for conventional cat litter products. In addition, the disposal of used cat litter presents environmental challenges, especially when it contains clay or synthetic materials which do not decompose easily. Furthermore, improper disposal methods, such as flushing litter down the toilet or disposing of it in regular household waste, might lead to contamination of waterways and soil, posing risks to aquatic ecosystems and wildlife. Thus, all these factors limit the cat litter market growth.
Lack of consumer awareness often restrains the demand for cat litter market. Many consumers are not fully informed about the environmental and health implications of conventional cat litter products, such as clay-based litter containing silica dust. This lack of awareness leads to uninformed purchasing decisions, with consumers opting for traditional litter options without considering the potential negative consequences. In addition, some consumers are not aware of the availability of alternative cat litter products that are more environmentally friendly, healthier for pets, and safer for disposal. Without adequate education and information, these consumers continue to purchase less sustainable and potentially harmful cat litter options.
Furthermore, misconceptions or outdated beliefs about cat litter products impact market demand. For example, some consumers believe that all cat litter must be disposed of in the trash or flushed down the toilet as they are unaware of the environmental risks associated with these disposal methods. Others underestimate the health hazards posed by clay litter dust or overestimate the effectiveness of certain odor-control additives. As a result, they are less inclined to seek out alternative cat litter options that offer superior performance and safety benefits. Thus, all these factors limit the growth of the cat litter market share.
Health-conscious formulations present significant opportunities for the cat litter market by addressing consumer concerns about the safety and well-being of both pets and humans. By developing cat litter products free from harmful chemicals, dust, and artificial fragrances, manufacturers capitalize on the growing demand for safer alternatives. Moreover, health-conscious formulations help pet owners seek products which promote the health and comfort of their cat companions while minimizing potential risks. This presents an opportunity for companies to differentiate themselves in the market by offering cat litter industry with various options that prioritize pet and human health.
In addition, health-conscious formulations target specific consumer segments with unique needs, such as cats with allergies or sensitive skin, or households with young children or individuals with respiratory conditions. By developing cat litter products that are hypoallergenic, low-dust, and fragrance-free, manufacturers attract consumers who prioritize safety and are willing to invest in premium products for their pets' well-being. Furthermore, marketing these formulations as safer alternatives to traditional litter options helps educate consumers about the potential health risks associated with conventional products, drive awareness and demand for healthier alternatives. Thus, all these factors present numerous opportunities for the cat litter industry.
Segmental Overview
The cat litter market is segmented into type, raw material, distribution channel and region. By type, the cat litter market is bifurcated into clumping and non-clumping. By raw material, the market is classified into clay, silica, and others. By distribution channel, the market is divided into hypermarkets/supermarkets, specialty pet stores, and online channels. Region-wise, the market is analyzed across North America (the U.S., Canada, and Mexico), Europe (France, Germany, the UK, Italy, Spain, Russia, and the rest of Europe), Asia-Pacific (China, Japan, India, Australia, South Korea, and the rest of Asia-Pacific), and Latin America (Brazil, Argentina, Colombia, and rest of Latin America) Middle East of Africa (GCC, South Africa, and rest of MEA).
By Type
By type, the clumping segment dominated the global cat litter market in 2023 and is anticipated to maintain its dominance during the forecast period. Clumping litter forms solid clumps upon contact with moisture, encapsulating liquid waste for easy removal, while leaving the remaining litter clean and dry. In addition, this feature significantly reduces the frequency of complete litter box changes, save time and effort for pet owners. Clumping litter offers better odor control compared to non-clumping varieties, as it effectively traps and seals odors within the clumps. Moreover, this enhanced odor control particularly appeals to pet owners seeking a cleaner and more hygienic living environment for both them and their pets.

By Raw Material
By raw material, the clay segment dominated the global cat litter market share in 2023 and is anticipated to maintain its dominance during the forecast period. Clay litter offers excellent absorbency, effectively soaking up moisture and forming solid clumps for easy removal of waste. This feature provides convenience for pet owners by simplifying litter box maintenance. In addition, clay litter is readily available and relatively inexpensive compared to alternative litter materials, making it accessible to a wide range of consumers. Its affordability appeals to budget-conscious pet owners seeking cost-effective solutions for managing cat waste. clay litter often provides effective odor control, helping to neutralize unpleasant smells associated with cat urine and feces. Furthermore, this odor control capability enhances the cleanliness and freshness of the home environment and contribute in the widespread use among pet owners.

By Distribution Channel
By distribution channel, the hypermarkets/supermarkets segment dominated the global cat litter market size in 2023 and is anticipated to maintain its dominance during the cat litter market forecast period. Hypermarkets/Supermarkets outlets offer a one-stop shopping experience for pet owners which provides a comprehensive range of cat litter products alongside other pet care essentials. Hypermarkets and supermarkets typically stock a variety of cat litter brands, formulations, and packaging sizes, catering to different consumer preferences and budgetary constraints. This extensive product selection allows pet owners to compare options and choose the most suitable litter for their cats, all in one convenient location. Moreover, hypermarkets and supermarkets often run promotions, discounts, and bulk purchase deals on cat litter products, attracting price-sensitive consumers and encouraging larger purchases.

By Region
Region wise, North America is anticipated to dominate the market with the largest share as per cat litter market analysis and forecast period. North America has a high rate of pet ownership, with a large population of cat owners who prioritize pet care and hygiene. This sizable consumer base drives significant demand for cat litter products. North America boasts a well-developed pet care industry, with established manufacturers and retailers offering a wide range of cat litter options to meet diverse consumer preferences. The region's strong distribution network, including pet specialty stores, supermarkets, and online platforms, ensures easy access to cat litter products for consumers across urban and rural areas.

Competitive Analysis
Players operating in the global cat litter market have adopted various developmental strategies to expand their cat litter market share, increase profitability, and remain competitive in the cat litter market. Key players profiled in this report include Mars Inc., Nestle SA, Church & Dwight Co. Inc., The Clorox Company, Dr. Elsey’s, Oil-Dri Corporation of America, Pestell Pet Products, ZOLUX SAS, Cat Litter Company, and Healthy Pet.
Several upcoming brands are vying for market dominance in the expanding cat litter industry. Smaller, niche firms are more well-known for catering to consumer demands and tastes. Private label brands created by merchants and e-commerce platforms are another aspect of the competitive market. While they provide more affordable options, they have different recognition or range of products than well-known companies. An important competition component is innovation in cat litter products, sourcing, and sustainability policies. Brands that are able to change the tastes of their target market and align with their ethical & environmental values have an advantage over rivals.
Key Benefits For Stakeholders
This report provides a quantitative analysis of the market segments, current trends, estimations, and dynamics of the cat litter market statistics from 2023 to 2035 to identify the prevailing cat litter market opportunities.
The market research is offered along with information related to key drivers, restraints, and opportunities.
- Porter's five forces analysis highlights the potency of buyers and suppliers to enable stakeholders make profit-oriented business decisions and strengthen their supplier-buyer network.
- In-depth analysis of the cat litter market segmentation assists to determine the prevailing market opportunities.
- Major countries in each region are mapped according to their revenue contribution to the global market.
- Market player positioning facilitates benchmarking and provides a clear understanding of the present position of the market players.
- The report includes the analysis of the regional as well as global cat litter market trends, key players, market segments, application areas, and market growth strategies.
Cat Litter Market Report Highlights
| Aspects | Details |
| Forecast period | 2023 - 2035 |
| Report Pages | 283 |
| By Product Type |
|
| By Distribution Channel |
|
| By Raw Material |
|
| By Region |
|
| Key Market Players | Cat Litter Company, Church & Dwight Co. Inc., healthy pet, Oil-Dri Corporation of America, Mars Inc., ZOLUX SAS, Nestle SA, pestell pet products, Dr. Elsey's, The Clorox Company |
Analyst Review
According to CXOs of leading companies, rapid urbanization, and globalization as well as increase in disposable income play a vital role in shifting pet care habits around the world and boosts the consumer demand for unique pet care products. Pet owners all over the world are increasingly considering their pets to be members of their families and are looking for high-quality care solutions. The demand for high safety standards and application efficacy is increasing. Increased spending by cat owners on care and luxury products for their cats is driving the growth of the global cat litter industry. Many brands strive to gain clients in the digital age by establishing a presence through digital media. All these factors fuel the increase in sales of the cat litter market. Companies such as Laviosa, Tolsa Company, Boxiecat, and Dr. Elsey's Cat Products hope to gain traction through social media networks. As the direct-to-consumer trend has made inroads into the cat litter business.
Moreover, several brands, such as Boxiecat, have started their own websites to offer products such as cat litter deodorizers, cat litter jugs, and cat litter mats directly to consumers. This will be further expected to assist them in gaining consumer trust and establishing long-term brand loyalty. The millennial generation and senior individuals are two consumer segments that have had a considerable impact on the global adoption rate of cats. A large number of cat owners, particularly among millennials, have Instagram and Facebook accounts that are used to increase sales of cat litter products. Cat owners are increasingly turning to natural materials in the market as alternatives to cat litter. Consumers are turning to natural alternatives such as corn, wheat, walnut shells, pine, and diatomaceous earth as they become more aware of the environmental impact. This is a significant aspect in the shift in consumer expenditure from conventional to natural and sustainable litter.
The global cat litter market was valued at $7.9 Billion in 2023 and is projected to reach $13.7 billion by 2035.
The top companies analyzed for global cat litter market report are Mars Inc., Nestle SA, Church & Dwight Co. Inc., The Clorox Company, Dr. Elsey's, Oil-Dri Corporation of America, Pestell Pet Products, ZOLUX SAS, Cat Litter Company, and Healthy Pet.
North America holds the maximum market share of the cat litter market.
The growth of the cat litter market is primarily driven by rising pet ownership rates, urbanization leading to smaller living spaces, heightened awareness of pet health and hygiene, and innovation in eco-friendly and specialized litter formulations.
The global cat litter market to register at a CAGR of 4.7%.
Loading Table Of Content...
Loading Research Methodology...

