
Cheese Market Research, 2035
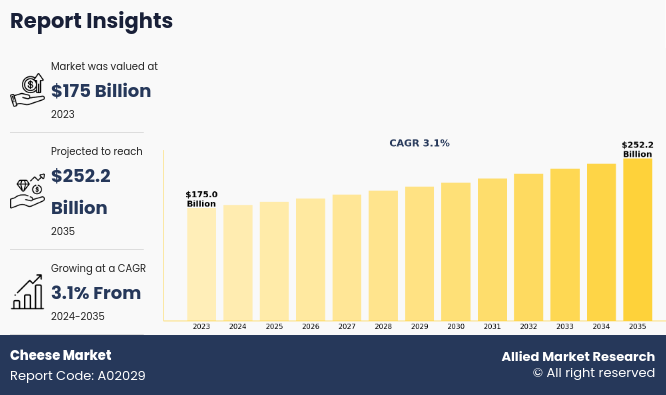
The global cheese market size was valued at $175 billion in 2023, and is projected to reach $252.2 billion by 2035, growing at a CAGR of 3.1% from 2024 to 2035. Cheese is a flavorful food product made from milk that is transformed into a solid form by curdling and draining. It comes in many tastes and textures, from creamy and mild to firm and sharp, and is used in a wide range of dishes from sandwiches and salads to pizzas and desserts. Rich in calcium and protein, cheese is a popular ingredient in both everyday cooking and gourmet cuisine.
Key Takeaways
- By type, the natural cheese segment dominated the market in 2023.
- By source, the cow milk segment dominated the market in 2023.
- By product, the cheddar segment dominated the market in terms of revenue in 2023.
- By distribution channel, the B2C segment dominated the market in terms of revenue in 2023.
- By region, Europe dominated the market in terms of revenue in 2023. However, Asia-Pacific is anticipated to grow at the highest CAGR during the forecast period.
Market Dynamics
The global expansion of the foodservice industry is a significant driver for the cheese industry, as restaurants, cafes, fast-food chains, and catering services increasingly incorporate cheese into a wide range of menu offerings. Cheese is a staple ingredient in pizzas, burgers, sandwiches, pasta, salads, and baked goods items that are central to both Western and increasingly global cuisines. As dining out and food delivery services grow, particularly in urban centers, the demand for versatile, high-quality cheese continues to rise. Quick-service restaurants and casual dining establishments are also introducing cheese-based innovations to attract customers, further fueling consumption. In addition, the growth of international food chains in emerging economies introduces local consumers to new cheese varieties, expanding market reach. As foodservice players prioritize consistent quality, meltability, and flavor, cheese producers have the opportunity to supply customized solutions, thereby strengthening their position in this expanding channel and supporting overall cheese market growth.
However, fluctuating prices and the inconsistent availability of raw milk pose a significant restraint on the cheese market, as milk is the primary raw material in cheese production. Variations in milk supply due to seasonal changes, feed costs, disease outbreaks among livestock, and climate-related challenges can lead to unpredictable pricing and supply shortages. This directly impacts production costs for cheese manufacturers, making it difficult to maintain stable pricing and profit margins. Smaller producers are particularly vulnerable, often facing operational disruptions or being forced to scale back production. In addition, supply chain challenges and regional disparities in milk production further complicate procurement for global and local cheese makers. These fluctuations can lead to higher retail prices, which may discourage cost-sensitive consumers and impact overall demand. Inconsistencies in milk quality can also affect cheese texture, taste, and shelf life, potentially undermining brand trust and product consistency in competitive markets.
Moreover, the increased usage of cheese in snacks, bakery items, and fusion cuisines is creating significant opportunities for increasing the cheese market demand. As global eating habits shift toward convenience and flavor-rich experiences, cheese is becoming a key ingredient in ready-to-eat snacks, stuffed breads, pastries, and cross-cultural dishes. The incorporation of cheese into local and international fusion recipes such as cheese-filled samosas, cheesy sushi rolls, or spiced cheese breads is widening its appeal across diverse consumer groups. In addition, the booming snack food industry, especially among urban youth and working professionals, is driving the demand for cheese-based products that are quick, satisfying, and indulgent. In the bakery segment, cheese is being used innovatively in cakes, muffins, and savory bakes, enhancing both taste and texture. This versatility positions cheese not just as a traditional staple but as a modern, adaptable ingredient that supports product innovation and differentiation in highly competitive food markets.
Product innovation and variety are critical drivers of global cheese industry growth. As customer preferences shift, producers are increasingly focusing on creating new cheese kinds that meet a variety of nutritional demands and lifestyles. This includes the development of plant-based vegan cheeses derived from almonds, soy, or oats, which are aimed at the expanding sector of health-conscious and ecologically concerned customers. Furthermore, low-fat, lactose-free, high-protein, and fortified cheese choices are becoming popular among those who have dietary limitations or special health goals. Consumers who are daring and seeking out novel tastes are also drawn to flavor advancements like herb-infused, spicy, and unusual cheese combinations. Convenient forms such as cheese sticks, spreads, cubes, and ready-to-cook kits have also been developed to cater to busy urban populations looking for quick meal choices. These developments help cheese products grow steadily and gain more market share in both developed and emerging nations by broadening the customer base and allowing brands to stand out in a more competitive market.
Segmental Overview
The cheese market is segmented into source, type, product, distribution channel, and region. On the basis of source, the market is categorized into sheep milk, goat milk, buffalo milk, and cow milk. On the basis of type, the market is divided into natural and processed. On the basis of product, the market is divided into Mozzarella, Feta, Roquefort, Cream Cheese, Cheddar, Parmesan, Blue Cheese, Gouda, Ricotta, Mascarpone, and others. On the basis of distribution channel, the market is divided into B2B and B2C. Region-wise, the cheese market is analyzed across North America (U.S., Canada and Mexico), Europe (France, Germany, Italy, Spain, UK, Russia and Rest of Europe), Asia-Pacific (China, Japan, India, South Korea, Australia, Kazakhstan, Azerbaijan, Uzbekistan, Georgia and Rest of Asia-Pacific) Latin America (Brazil, Argentina and Rest of Latin America) and Middle East & Africa (South Africa, Saudi Arabia, UAE, and Rest of Middle East & Africa)
By Type
By type, the natural cheese segment dominated the cheese market in 2023 and is anticipated to maintain its dominance during the forecast period owing to its clean-label appeal, authentic flavor, and growing consumer preference for minimally processed foods. Natural cheese is considered healthier and more nutritious, attracting health-conscious consumers. The demand is further boosted by its extensive use in cooking, snacking, and foodservice applications. Its association with premium quality and traditional preparation methods supports its leading market position.

By Source
By source, the cow milk segment dominated the cheese market in 2023 and is anticipated to maintain its dominance during the forecast period owing to its widespread availability, cost-effectiveness, and high consumer preference. Cow milk is rich in essential nutrients, making it ideal for producing a wide variety of cheese types with consistent quality and taste. In addition, the well-established cow dairy industry and advanced processing technologies contribute to higher production efficiency, supporting the segment’s continued growth across global markets.

By Product
By product, the cheddar segment dominated the cheese market in 2023 and is anticipated to maintain its dominance during the forecast period owing to its versatility, long shelf life, and wide application in both household and commercial food preparations. Cheddar’s firm texture and rich flavor profile make it suitable for burgers, sandwiches, baked goods, and ready meals. Its global popularity, availability in various aging levels, and adaptability to diverse culinary uses continue to strengthen its market share worldwide.

By Distribution Channel
By distribution channel, the B2B segment dominated the cheese market in 2023 and is anticipated to maintain its dominance during the cheese market forecast period owing to its strong demand from the foodservice sector, including restaurants, hotels, and catering services. Bulk purchasing by manufacturers and institutional buyers ensures consistent supply and cost-efficiency. In addition, B2B distribution supports long-term contracts and partnerships, enabling stable revenue streams for producers. The segment benefits from expanding fast food chains and bakery outlets that rely heavily on cheese as a key ingredient.

By Region
Region wise, Europe dominated the market in 2023 and is anticipated to maintain its dominance during the forecast periodo wing to its strong cheese-making tradition, high per capita consumption, and wide variety of specialty and artisanal cheeses. The region is home to globally recognized cheese-producing countries such as France, Italy, Germany, and the Netherlands, which contribute significantly to both production and exports. In addition, supportive dairy infrastructure, established retail networks, and growing demand for premium and organic cheese products continue to strengthen Europe’s leadership in the global market.

Competition Analysis
Players operating in the market have adopted various developmental strategies to expand their cheese market share, increase profitability, and remain competitive in the market. Key players profiled in this report include Arla Foods Amba, The Bel Group, Fonterra Co-operative Group Limited, The Kraft Heinz Company, Groupe Lactalis S.A, Savencia SA, Britannia Industries Limited, Associated Milk Producers, Saputo Inc., and Gujarat Cooperative Milk Marketing Federation Ltd.
Some Examples of Product Launch in The Market
- In November 2023, The Kraft Heinz Not Company LLC launched KRAFTR. No 1 Mac & Cheese, the first-ever, plant-based KRAFT Mac & Cheese in the United States. KRAFT Not Mac & Cheese is the third innovation to launch in a year from The Kraft Heinz Company (“Kraft Heinz”) and TheNotCompany, Inc. (“NotCo”) joint venture, which aims to create mouthwatering, plant-based foods for all.
- In August 2023, Arla Foods Amba launched first ever locally produced organic cheese in Indonesia as result of International dairy development project.
Some Examples of Innovation in The Market
- In May 2025, Fonterra launched new 24/7 digital sales channel for regional ingredients buyers. MyNZMP Link, a secure and intuitive e-commerce platform giving customers from across the US and Europe access to NZMP ingredients directly from regional warehouses.
Key Benefits For Stakeholders
- This report provides a quantitative analysis of the market segments, current trends, estimations, and dynamics of the cheese market analysis from 2023 to 2035 to identify the prevailing cheese market opportunities.
- The market research is offered along with information related to key drivers, restraints, and opportunities.
- Porter's five forces analysis highlights the potency of buyers and suppliers to enable stakeholders make profit-oriented business decisions and strengthen their supplier-buyer network.
- In-depth analysis of the cheese market segmentation assists to determine the prevailing market opportunities.
- Major countries in each region are mapped according to their revenue contribution to the global market.
- Market player positioning facilitates benchmarking and provides a clear understanding of the present position of the market players.
- The report includes the analysis of the regional as well as global cheese market trends, key players, market segments, application areas, and market growth strategies.
Cheese Market Report Highlights
| Aspects | Details |
| Market Size By 2035 | USD 252.2 billion |
| Growth Rate | CAGR of 3.1% |
| Forecast period | 2023 - 2035 |
| Report Pages | 414 |
| By Product |
|
| By Source |
|
| By Type |
|
| By Distribution channel |
|
| By Region |
|
| Key Market Players | Groupe Lactalis S.A, The Kraft Heinz Company, Associated Milk Producers, Fonterra Co-operative Group Limited, The Bel Group, Arla Foods Amba, Britannia Industries Limited, Savencia SA, Gujarat Cooperative Milk Marketing Federation Ltd., Saputo Inc. |
Analyst Review
Various CXOs from leading companies perceive that flavored processed cheese and innovation in cheese processing is the main area for market growth in the cheese market. Retail market expansion and economic growth in advanced and emerging economies support the cheese market growth. However, increase in health awareness and high perishability nature of cheese among consumers are projected to hinder the market growth. According to the CXOs, Asia-Pacific is projected to register a significant growth as compared to the saturated markets of Europe and North America due to an increase in penetration of a wide range of cheeses.
CXO further added that there is a need for sustainable packaging in the cheese industry as according to National Geographic 18 billion pounds of plastic flows into ocean every year and only 9% of the total plastic produced has been recycled. Also, 79% of it is currently dumped into landfills or discarded in the natural environment. Therefore, there is a need for sustainable packaging of dairy products including cheese which in resultant have led many key players to step toward eco-friendly and sustainable packaging.
Apparently, a global paper packaging group named Mondi and Hazeleger Kaas Company has entered into partnership to promote sustainable packaging of cheese. By working together, they have produced cheese packaging with PP thermoforming top and bottom web, and PP label so that the packaging can be entirely recycled, which was not possible previously. Therefore, due to the growing environmental concern, sustainable packaging is projected to shape the future packaging of cheese and other dairy products.
The global cheese market size was valued at USD 175 billion in 2023, and is projected to reach USD 252.2 billion by 2035.
The global cheese market is projected to grow at a compound annual growth rate of 3.1% from 2024-2035 to reach USD 252.2 billion by 2035.
The top companies that hold the market share in the cheese market include Arla Foods Amba, The Bel Group, Fonterra Co-operative Group Limited, The Kraft Heinz Company, Groupe Lactalis S.A, and others.
Europe will dominate the cheese market.
Expansion of the Foodservice Industry, Rise in Cheese-Based Snacks & Fusion Foods, Product Innovation & Variety.
Loading Table Of Content...
Loading Research Methodology...

