
Child Safety Seats Market Research, 2033
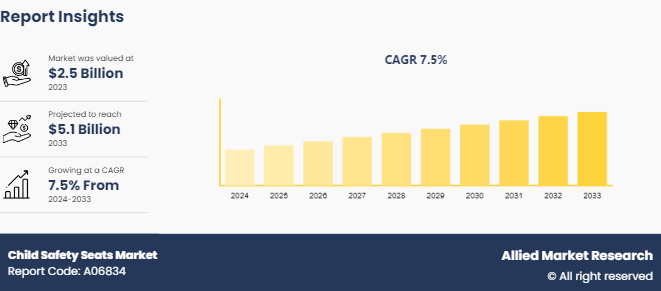
The global child safety seats market was valued at $2.5 billion in 2023, and is projected to reach $5.1 billion by 2033, growing at a CAGR of 7.5% from 2024 to 2033.
Market Introduction and Definition
Child safety seats, also known as car seats or child restraints, are specially designed seats intended to protect infants and young children in the event of a vehicle collision or sudden stop. These seats are crucial for ensuring the safety of children while traveling in vehicles, as they provide protection against injuries that may result from crashes or accidents.
Child safety seats are designed to accommodate children of specific age groups and sizes, ranging from newborns to older children. Different types of seats are available to cater to the varying needs of infants, toddlers, and older children.The child safety seats industry continues to innovate with new designs aimed at enhancing child safety during travel.
Key Takeaways
- The child safety seats market study covers 20 countries. The research includes a segment analysis of each country in terms of value for the projected period.
- More than 1, 500 product literatures, industry releases, annual reports, and other such documents of major child safety seats industry participants along with authentic industry journals, trade associations' releases, and government websites have been reviewed for generating high-value industry insights.
- The study integrated high-quality data, professional opinions and analysis, and critical independent perspectives. The research approach is intended to provide a balanced view of global markets and to assist stakeholders in making educated decisions in order to achieve their most ambitious growth objectives.
Recent Key Strategies and Developments
- In June 2023, Graco introduced their latest innovation, the 4Ever® DLX Grad 5-in-1 Car Seat, which offers five modes of use, including a unique removable seat belt trainer. This seat is designed to accommodate children from infancy up to 12 years old, providing versatility and longevity for growing families.
- In January 2023, Babyark, a company based in Coral Gables, Florida, recently unveiled its latest innovation, the babyark convertible car seat, at the 2023 Consumer Electronics Show (CES) . This car seat represents a significant advancement in child passenger safety, introducing a holistic approach that integrates advanced materials and technology. It includes composites such as high-strength steel, carbon fiber, and D3O—a cutting-edge impact-absorbing polymer commonly used in extreme military applications.
- Baby Jogger® has introduced the City Turn™ Convertible Car Seat in Canada, offering an innovative solution to simplify the process of getting a child in and out of the car. This new car seat features a secure rotating mechanism that enables a one-hand 180-degree rotation in rear-facing mode, bringing the child 25.4 cm (10 inches) closer to the parent. The key highlight of the City Turn™ Convertible Car Seat is its unique technology, which allows parents and caregivers, particularly those who may have mobility challenges such as recent post-partum mothers or elderly grandparents, to easily maneuver the child in and out of the car.
Key Market Dynamics
The global child safety seats market is growing due to several factors such as increasing awareness of child safety, stringent government regulations, and technological advancements and innovations. However, the high cost, and lack of awareness in developing regions restrain the development of the market. In addition, expansion in urbanization and e-commerce growth will provide ample opportunities for the market's development during the forecast period.The child safety seats market size is expanding as awareness grows about the importance of proper child restraint systems.
Rising awareness about the importance of child safety while traveling is a major driver. Governments and non-governmental organizations (NGOs) are actively promoting the use of child safety seats through various campaigns and educational programs, which is increasing consumer awareness and demand. Many countries have implemented strict regulations mandating the use of child safety seats. For instance, laws in the United States, Europe, and several Asian countries require child safety seats for children under a certain age or weight. These regulations compel parents and guardians to purchase appropriate safety seats, driving market growth.
Market Segmentation
The child safety seats market is segmented into product type, type, distribution channel, and region. On the basis of product type, the market is divided into infant seats, convertible seats, booster seats, and others. As per type, the market is segregated into rear facing car seat, and forward facing car seat. On the basis of distribution channel, the market is bifurcated into online, and offline. Region wise, the market is analyzed across North America, Europe, Asia-Pacific, and LAMEA.
Regional/Country Market Outlook
The child safety seats market forecast anticipates steady growth as governments and consumers alike prioritize child safety, driving innovation and adoption of advanced safety technologies in child seating solutions. The safety of children in vehicles is a significant concern, with statistics showing that 31 children die in road accidents every day. Child restraint systems, including car seats, have been proven to be highly effective in reducing the risk of fatal injuries in the event of a car crash.
According to the National Highway Traffic Safety Administration (NHTSA) , the use of car seats can lower the risk of fatal injury by 71% for infants (under 1 year old) and by 54% for toddlers (1 to 4 years old) in vehicles. These statistics underscore the importance of using proper child safety seats to protect young children during car travel.There is a significant child safety seats market opportunity in developing regions where safety regulations are becoming stricter, creating a demand for affordable and reliable child safety seats.
The child safety seats market size reflects the growing demand for safe and compliant seating solutions for children across various age groups. To address the critical issue of child safety in vehicles and the lack of awareness about the importance of using baby car seats in India, Fortis La Femme, a leading healthcare provider, is organizing a public awareness campaign called "The Safest Lap."
This initiative is being conducted in association with Chicco, a well-known brand specializing in baby products, and LifeCell, a prominent stem cell bank and healthcare service provider. Child safety seats market growth is driven by regulatory mandates and increasing awareness of child safety issues, spurring demand for advanced and safer seating solutions.
- In December 2023, Ambarella, Inc., a semiconductor company specializing in edge AI, unveiled its autonomous driving (AD) software stack, a set of modular components designed to enable vehicle autonomy. Driven by deep learning AI processing, the stack handles tasks such as environmental perception, sensor fusion, and vehicle path planning.
- On January 9th, 2024, Black Sesame Technologies, a leading provider of intelligent vehicle System-on-Chip (SoC) solutions, introduced groundbreaking products at the CES 2024 event. Highlights included the Huashan Series A1000, a high-performance automotive-grade autonomous driving chip, and the Wudang C1200 Series, an intelligent vehicle cross-domain computing platform.
- In September 2020, Li Auto Inc., a major player in China's new energy vehicle market, announced a strategic partnership with NVIDIA Corporation and its Chinese partner, Huizhou Desay SV Automotive. The collaboration aims to integrate NVIDIA's Orin SoC, a next-generation autonomous driving smart chip, into Li Auto's full-size extended-range electric vehicles scheduled for launch in 2022.
Competitive Landscape
The child safety seats industry encompasses manufacturers, innovators, and regulators dedicated to advancing safety standards and technologies in child passenger safety. The major players operating in the child safety seats market include Graco Inc., Britax Child Safety, Inc., Evenflo Company, Inc., Chicco, Diono, Maxi-Cosi, Cybex, Safety 1st, Joie Baby, Nuna. Child safety seats market share is dominated by several key manufacturers, each contributing to the safety and innovation of these essential products.
Industry Trends:
- In April 2021, Chicco USA announced the launch of a new line of car seats designed to enhance comfort for children through the use of innovative, breathable, and thermoregulating materials. This new product line, called Chicco Adapt, incorporates the patented 37.5 Technology and breathable mesh fabrics to help maintain an optimal microclimate for children during car rides.
- In March 2024, Uber introduced a new service called "Uber Car Seat, " designed to make traveling with young children easier and more convenient for parents and caregivers. This service, which includes a pre-installed Nuna RAVA car seat, aims to provide a simple and stress-free travel experience by eliminating the need for passengers to bring their own car seats.
- In 2023, AAA and Chicco USA collaborated to release new findings that highlight the critical importance of using proper child restraint systems in vehicles. The analysis, which examined five years of crash data from the U.S. Department of Transportation, reveals alarming statistics about the misuse or non-use of appropriate restraints for children in cars. As Baby Safety Month begins, both organizations aim to raise awareness and educate parents on the correct use of child safety seats.
Key Sources Referred
- National Highway Traffic Safety Administration (NHTSA)
- American Academy of Pediatrics (AAP)
- National Child Passenger Safety Board (NCPSB)
- Safe Kids Worldwide
- European Child Safety Alliance (ECSA)
- Transport Canada
Key Benefits For Stakeholders
- This report provides a quantitative analysis of the market segments, current trends, estimations, and dynamics of the child safety seats market analysis from 2024 to 2033 to identify the prevailing child safety seats market opportunities.
- The market research is offered along with information related to key drivers, restraints, and opportunities.
- Porter's five forces analysis highlights the potency of buyers and suppliers to enable stakeholders make profit-oriented business decisions and strengthen their supplier-buyer network.
- In-depth analysis of the child safety seats market segmentation assists to determine the prevailing market opportunities.
- Major countries in each region are mapped according to their revenue contribution to the global market.
- Market player positioning facilitates benchmarking and provides a clear understanding of the present position of the market players.
- The report includes the analysis of the regional as well as global child safety seats market trends, key players, market segments, application areas, and market growth strategies.
Child Safety Seats Market Report Highlights
| Aspects | Details |
| Market Size By 2033 | USD 5.1 Billion |
| Growth Rate | CAGR of 7.5% |
| Forecast period | 2024 - 2033 |
| Report Pages | 267 |
| By Product Type |
|
| By Type |
|
| By Distribution Channel |
|
| By Region |
|
| Key Market Players | Cybex, Evenflo Company, Inc., Maxi-Cosi, Chicco, Britax Child Safety, Inc., Nuna, Diono, Safety 1st, Graco Inc., Joie Baby |
The child safety seats market was valued at $2.5 billion in 2023 and is estimated to reach $5.0 billion by 2033, exhibiting a CAGR of 7.6% from 2024 to 2033.
The largest regional market for child safety seats is North America
The top companies to hold the market share in child safety seats are Graco Inc., Britax Child Safety, Inc., Evenflo Company, Inc., Chicco, Diono, Maxi-Cosi, Cybex, Safety 1st, Joie Baby, Nuna.
The leading product type of child safety seats market is infant seats.
The upcoming trends of child safety seats market in the globe are expansion in urbanization and e-commerce growth.
Loading Table Of Content...

