Report Code: A05567 | Jan 2021 | Pages: 250 | ||
Tables: 136 | Charts: 72 |
|
Pandemic disrupted the entire world and affected many industries.
Get detailed COVID-19 impact analysis on the Chipless Rfid Market
Request Now !
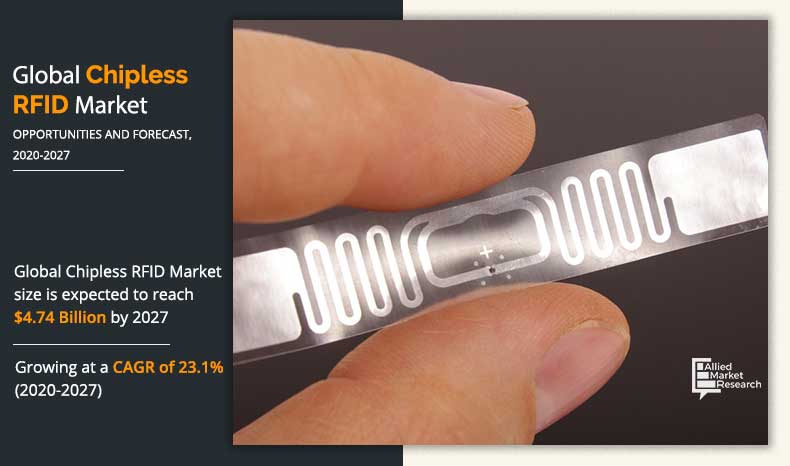
The global chipless RFID market size was valued at $903.3 million in 2019, and is projected to reach $4,744.0 million by 2027, to register a CAGR of 23.1% from 2020 to 2027.
The retail segment in Global Chipless RFID Market is expected to attain positive growth due to increasing automation and wireless operations to maintain minimum contact..
Radio frequency identification (RFID) without a silicon IC are called chipless RFID. It is an evolving wireless technology for access controls, automatic identifications, security & surveillance, tracking, database management, logistics, and inventory control. It uses conductive polymers or plastic as a replacement for silicon-based ICs.
The chipless RFID is a breakthrough in overcoming the restrictions of traditional RFID technology as it eliminates the expense related with the silicon IC chip in the circuit. Also, the chipless RFID is completely printable and in this way it is resistant to very harsh and climate conditions. It can also be imprinted on metals & bottles containing fluids. The key advantages of these features grant chipless RFID in extraordinary applications that couldn't be accomplished beforehand with both chipped and barcode RFIDs. A few examples include low-cost item tagging such as, for ID cards, banknotes, drink containers, books, aluminum cans, and customer merchandise. A chipless RFID tag is also used as a chipless RFID sensors in offering low-priced sensors for realizing the universal networks required by the IoT paradigm. A chipless RFID sensors is mainly used for detection of CO2.
The idea of chipless RFID has been created with rivaling barcodes in specific regions of application. Chipless RFID has numerous benefits, such as low cost, easy to use, and others. The barcode provides single feature of ID recovery, but the technology is time-tasted, and widespread.
The global chipless RFID market is anticipated to witness significant growth over the period of forecast. Factors such as high accuracy, low manufacturing cost, and providing more functions as compared to other alternatives drive the growth of the chipless RFID market. Since, all chipless RFID tags within range can be detected instantaneously & checked with data in system database. Thus, it reduces human error & effort and provides high accuracy. Additionally, chipless RFID technology provides various functionalities such as chipless RFID tags are read/write capable, automated, uniquely identifies each item or asset, among others. However, initially high capital investment is a major restraint to global chipless RFID industry. In addition, growing shift of retailers toward chipless RFID is expected to create opportunities for the
global market.
The global chipless RFID market is segmented into product type, frequency, application, end user, and region. By product type, the market is segmented into tag, and reader. The frequency segment is divided into low frequency, high frequency, and ultrahigh frequency. By application, the market is fragmented into smart cards, smart tickets, and others. Depending on end user, the market is segregated into retail, healthcare, logistics and transportation, BFSI, and others.
Region wise, the chipless RFID market trends are analyzed across North America (U.S., Canada, and Mexico), Europe (UK, Germany, France, and Rest of Europe), Asia-Pacific (China, Japan, India, and Rest of Asia-Pacific), and LAMEA (Latin America, the Middle East, and Africa). APAC region is expected to develop at highest rate during the conjecture time frame. APAC region, specifically China remains a significant participant in the global supply chain market, organizations in the country are intensely putting resources into the technology; for example, usage of RFID labels in logistic sector to improve the production network market in the country. In January 2018, Taocafe, China based organization introduced smart store, where individuals buy RFID labels connected to the item & can check out via WeChat Pay. Comparable smart stores were opened by Alibaba, JD.com, & Tencent in the China market. In this way, owing to high adoption of chipless RFID products, in the APAC market indicating positive effect on the global chipless RFID market.
Leading chipless RFID manufacturer such as Zebra Technologies Corporation, Alien Technology, LLC, Honeywell International Inc., etc. are focusing their investment on technologically advanced, cost-effective and more secure products for various applications.
The prominent factors that impact the chipless RFID market growth are increased efficiency offered by chipless RFID tags, low cost of manufacturing, and rise in demand for chipless RFID tags in the healthcare & banking sector. However, data encoding and transmission while designing chipless RFID restrict the market growth. On the contrary, growing shift of retailers toward chipless RFID & innovation of cloud-based system is expected to create lucrative opportunities for the market. Every one of these elements is expected to affect the development of the global chipless RFID market during the forecast time frame.
Competitive analysis and profiles of the major chipless RFID market players such as Alien Technology, LLC., Applied Wireless, Inc., Avery Dennison Corporation, Checkpoint Systems, Inc., Honeywell International Inc., iDTRONIC GmbH, Impinj, Inc., Invengo Technology Pte. Ltd., NXP Semiconductors, and Zebra Technologies Corporation.
Covid-19 Impact Analysis
Key Benefits For Stakeholders
Chipless RFID Market Report Highlights
Aspects | Details |
---|---|
By Product Type |
|
By Frequency |
|
By Application |
|
By End User |
|
By Region |
|
Key Market Players | HONEYWELL INTERNATIONAL INC., Alien Technology, APPLIED WIRELESS IDENTIFICATIONS GROUP, INC., iDTRONIC GmbH, AVERY DENNISON CORPORATION, ZEBRA TECHNOLOGIES CORP., NXP Semiconductors, IMPINJ, INC., INVENGO TECHNOLOGY PTE. LTD., Checkpoint Systems, Inc. |
CHAPTER 1:INTRODUCTION
1.1.Report description
1.2.Key benefits for stakeholders
1.3.Key market segments
1.4.Key market players
1.5.Research methodology
1.5.1.Primary research
1.5.2.Secondary research
1.5.3.Analyst tools and models
CHAPTER 2:EXECUTIVE SUMMARY
2.1.Key findings
2.1.1.Top impacting factors
2.1.2.Top investment pockets
2.2.CXO perspective
CHAPTER 3:MARKET OVERVIEW
3.1.Market definition and scope
3.2.Porter’s five forces analysis
3.3.Patent analysis
3.3.1.Chipless RFID patent analysis, by region (2019-2020)
3.3.2.Chipless RFID patent analysis, by applicant
3.4.Market dynamics
3.4.1.Drivers
3.4.1.1.Increased efficiency offered by chipless RFID tags
3.4.1.2.Growing demand for chipless RFID in banking and healthcare sector
3.4.1.3.Low cost of manufacturing
3.4.2.Restraint
3.4.2.1.Risk associated with breach of confidential information
3.4.3.Opportunities
3.4.3.1.Growing shift of retailers toward chipless RFID products
3.4.3.2.Innovation of cloud-based system
3.5.COVID-19 impact analysis
3.5.1.COVID-19 outbreak
3.5.2.Impact on the market size
3.5.3.End user trends, preferences, and budget impact
3.5.4.Parent industry impact
3.5.5.Key player strategies to tackle negative impact
3.5.5.1.Limiting cuts to R&D expense
3.5.5.2.Focusing on next-generation products
3.5.5.3.Shifting toward agile supply chain model
CHAPTER 4:CHIPLESS RFID MARKET, BY PRODUCT TYPE
4.1.Overview
4.2.Tag
4.2.1.Key market trends, growth factors, and opportunities
4.2.2.Market size and forecast, by region
4.2.3.Market analysis, by country
4.3.Reader
4.3.1.Key market trends, growth factors, and opportunities
4.3.2.Market size and forecast, by region
4.3.3.Market analysis, by country
CHAPTER 5:CHIPLESS RFID MARKET, BY FREQUENCY
5.1.Overview
5.2.Low frequency
5.2.1.Key market trends, growth factors, and opportunities
5.2.2.Market size and forecast, by region
5.2.3.Market analysis, by country
5.3.High frequency
5.3.1.Key market trends, growth factors, and opportunities
5.3.2.Market size and forecast, by region
5.3.3.Market analysis, by country
5.4.Ultrahigh frequency
5.4.1.Key market trends, growth factors, and opportunities
5.4.2.Market size and forecast, by region
5.4.3.Market analysis, by country
CHAPTER 6:CHIPLESS RFID MARKET, BY APPLICATION
6.1.Overview
6.2.Smart cards
6.2.1.Key market trends, growth factors, and opportunities
6.2.2.Market size and forecast, by region
6.2.3.Market analysis, by country
6.3.Smart tickets
6.3.1.Key market trends, growth factors, and opportunities
6.3.2.Market size and forecast, by region
6.3.3.Market analysis, by country
6.4.Others
6.4.1.Key market trends, growth factors, and opportunities
6.4.2.Market size and forecast, by region
6.4.3.Market analysis, by country
CHAPTER 7:CHIPLESS RFID MARKET, BY END USER
7.1.Overview
7.2.Retail
7.2.1.Key market trends, growth factors, and opportunities
7.2.2.Market size and forecast, by region
7.2.3.Market analysis, by country
7.3.Healthcare
7.3.1.Key market trends, growth factors, and opportunities
7.3.2.Market size and forecast, by region
7.3.3.Market analysis, by country
7.4.Logistics and Transportation
7.4.1.Key market trends, growth factors, and opportunities
7.4.2.Market size and forecast, by region
7.4.3.Market analysis, by country
7.5.BFSI
7.5.1.Key market trends, growth factors, and opportunities
7.5.2.Market size and forecast, by region
7.5.3.Market analysis, by country
7.6.Others
7.6.1.Key market trends, growth factors, and opportunities
7.6.2.Market size and forecast, by region
7.6.3.Market analysis, by country
CHAPTER 8:CHIPLESS RFID MARKET, BY REGION
8.1.Overview
8.2.North America
8.2.1.Key market trends, growth factors, and opportunities
8.2.2.Market size and forecast, by product type
8.2.3.Market size and forecast, by frequency
8.2.4.Market size and forecast, by application
8.2.5.Market size and forecast, by end use
8.2.6.Market analysis, by country
8.2.6.1.U.S.
8.2.6.1.1.Market size and forecast, by product type
8.2.6.1.2.Market size and forecast, by frequency
8.2.6.1.3.Market size and forecast, BY application
8.2.6.1.4.Market size and forecast, by end use
8.2.6.2.Canada
8.2.6.2.1.Market size and forecast, by product type
8.2.6.2.2.Market size and forecast, by frequency
8.2.6.2.3.Market size and forecast, BY application
8.2.6.2.4.Market size and forecast, by end use
8.2.6.3.Mexico
8.2.6.3.1.Market size and forecast, by product type
8.2.6.3.2.Market size and forecast, by frequency
8.2.6.3.3.Market size and forecast, by application
8.2.6.3.4.Market size and forecast, by end use
8.3.Europe
8.3.1.Key market trends, growth factors, and opportunities
8.3.2.Market size and forecast, by product type
8.3.3.Market size and forecast, by frequency
8.3.4.Market size and forecast, by application
8.3.5.Market size and forecast, by end use
8.3.6.Market analysis, by country
8.3.6.1.UK
8.3.6.1.1.Market size and forecast, by product type
8.3.6.1.2.Market size and forecast, by frequency
8.3.6.1.3.Market size and forecast, BY application
8.3.6.1.4.Market size and forecast, by end use
8.3.6.2.Germany
8.3.6.2.1.Market size and forecast, by product type
8.3.6.2.2.Market size and forecast, by frequency
8.3.6.2.3.Market size and forecast, BY application
8.3.6.2.4.Market size and forecast, by end use
8.3.6.3.France
8.3.6.3.1.Market size and forecast, by product type
8.3.6.3.2.Market size and forecast, by frequency
8.3.6.3.3.Market size and forecast, BY application
8.3.6.3.4.Market size and forecast, by end use
8.3.6.4.Rest of Europe
8.3.6.4.1.Market size and forecast, by product type
8.3.6.4.2.Market size and forecast, by frequency
8.3.6.4.3.Market size and forecast, BY application
8.3.6.4.4.Market size and forecast, by end use
8.4.Asia-Pacific
8.4.1.Key market trends, growth factors, and opportunities
8.4.2.Market size and forecast, by product type
8.4.3.Market size and forecast, by frequency
8.4.4.Market size and forecast, by application
8.4.5.Market size and forecast, by end use
8.4.6.Market analysis, by country
8.4.6.1.China
8.4.6.1.1.Market size and forecast, by product type
8.4.6.1.2.Market size and forecast, by frequency
8.4.6.1.3.Market size and forecast, BY application
8.4.6.1.4.Market size and forecast, by end use
8.4.6.2.Japan
8.4.6.2.1.Market size and forecast, by product type
8.4.6.2.2.Market size and forecast, by frequency
8.4.6.2.3.Market size and forecast, BY application
8.4.6.2.4.Market size and forecast, by end use
8.4.6.3.India
8.4.6.3.1.Market size and forecast, by product type
8.4.6.3.2.Market size and forecast, by frequency
8.4.6.3.3.Market size and forecast, BY application
8.4.6.3.4.Market size and forecast, by end use
8.4.6.4.Rest of Asia-Pacific
8.4.6.4.1.Market size and forecast, by product type
8.4.6.4.2.Market size and forecast, by frequency
8.4.6.4.3.Market size and forecast, BY application
8.4.6.4.4.Market size and forecast, by end use
8.5.LAMEA
8.5.1.Key market trends, growth factors, and opportunities
8.5.2.Market size and forecast, by product type
8.5.3.Market size and forecast, by frequency
8.5.4.Market size and forecast, by application
8.5.5.Market size and forecast, by end use
8.5.6.Market analysis, by country
8.5.6.1.Latin America
8.5.6.1.1.Market size and forecast, by product type
8.5.6.1.2.Market size and forecast, by frequency
8.5.6.1.3.Market size and forecast, BY application
8.5.6.1.4.Market size and forecast, by end use
8.5.6.2.Middle East
8.5.6.2.1.Market size and forecast, by product type
8.5.6.2.2.Market size and forecast, by frequency
8.5.6.2.3.Market size and forecast, BY application
8.5.6.2.4.Market size and forecast, by end use
8.5.6.3.Africa
8.5.6.3.1.Market size and forecast, by product type
8.5.6.3.2.Market size and forecast, by frequency
8.5.6.3.3.Market size and forecast, BY application
8.5.6.3.4.Market size and forecast, by end use
CHAPTER 9:COMPETITIVE LANDSCAPE
9.1.Introduction
9.1.1.Market Player Positioning, 2019
9.2.Product Mapping of Top 10 Player
9.3.Competitive Dashboard
9.4.Competitive Heatmap
9.5.Key Developments
9.5.1.New Product Launches
9.5.2.Acquisitions
9.5.3.Collaboration
9.5.4.Partnership
CHAPTER 10:COMPANY PROFILES
10.1.Alien Technology
10.1.1.Company overview
10.1.2.Key Executive
Company snapshot
10.1.3.Operating business segments
10.1.4.Product portfolio
10.1.5.Key strategic moves and developments
10.2.APPLIED WIRELESS IDENTIFICATIONS GROUP, INC.
10.2.1.Company overview
10.2.2.Key Executive
10.2.3.Company snapshot
10.2.4.Operating business segments
10.2.5.Product portfolio
10.3.AVERY DENNISON CORPORATION
10.3.1.Company overview
10.3.2.Key Executive
10.3.3.Company snapshot
10.3.4.Operating business segments
10.3.5.Product portfolio
10.3.6.R&D expenditure
10.3.7.Business performance
10.3.8.Key strategic moves and developments
10.4.Checkpoint Systems, Inc.
10.4.1.Company overview
10.4.2.Key Executive
Company snapshot
10.4.3.Operating business segments
10.4.4.Product portfolio
10.4.5.Key strategic moves and developments
10.5.HONEYWELL INTERNATIONAL INC.
10.5.1.Company overview
10.5.2.Key Executive
10.5.3.Company snapshot
10.5.4.Operating business segments
10.5.5.Product portfolio
10.5.6.R&D Expenditure
10.5.7.Business performance
10.5.8.Key strategic moves and developments
10.6.iDTRONIC GmbH
10.6.1.Company overview
10.6.2.Key Executive
Company snapshot
10.6.3.Operating business segments
10.6.4.Product portfolio
10.7.IMPINJ, INC.
10.7.1.Company overview
10.7.2.Key Executive
10.7.3.Company snapshot
10.7.4.Operating business segments
10.7.5.Product portfolio
10.7.6.R&D Expenditure
10.7.7.Business performance
10.7.8.Key strategic moves and developments
10.8.INVENGO TECHNOLOGY PTE. LTD.
10.8.1.Company overview
10.8.2.Key Executive
10.8.3.Company snapshot
10.8.4.Product portfolio
10.8.5.Key strategic moves and developments
10.9.NXP Semiconductors
10.9.1.Company overview
10.9.2.Key Executives
10.9.3.Company snapshot
10.9.4.Operating business segments
10.9.5.Product portfolio
10.9.6.R&D Expenditure
10.9.7.Business performance
10.10.ZEBRA TECHNOLOGIES CORP.
10.10.1.Company overview
10.10.2.Key Executives
10.10.3.Company snapshot
10.10.4.Operating business segments
10.10.5.Product portfolio
10.10.6.R&D Expenditure
10.10.7.Business performance
10.10.8.Key strategic moves and developments
LIST OF TABLES
TABLE 01.GLOBAL CHIPLESS RFID MARKET, BY PRODCT TYPE, 2019-2027 ($MILLION)
TABLE 02.CHIPLESS RFID MARKET FOR TAG PRODCT TYPES, BY REGION, 2019–2027 ($MILLION)
TABLE 03.CHIPLESS RFID MARKET FOR READER PRODCT TYPE, BY REGION 2019–2027($MILLION)
TABLE 04.GLOBAL CHIPLESS RFID MARKET, BY FREQUENCY, 2019-2027 ($MILLION)
TABLE 05.CHIPLESS RFID MARKET FOR LOW FREQUENCY, BY REGION, 2019–2027 ($MILLION)
TABLE 06.CHIPLESS RFID MARKET FOR HIGH FREQUENCY, BY REGION 2019–2027($MILLION)
TABLE 07.CHIPLESS RFID MARKET FOR ULTRAHIGH FREQUENCY, BY REGION, 2019–2027 ($MILLION)
TABLE 08.GLOBAL CHIPLESS RFID MARKET REVENUE, BY APPLICATION, 2019-2027 ($MILLION)
TABLE 09.CHIPLESS RFID MARKET FOR SMART CARDS, BY REGION 2019–2027 ($MILLION)
TABLE 10.CHIPLESS RFID MARKET FOR SMART TICKETS, BY REGION 2019–2027($MILLION)
TABLE 11.CHIPLESS RFID MARKET FOR OTHERS, BY REGION 2019–2027($MILLION)
TABLE 12.GLOBAL CHIPLESS RFID MARKET, BY END USER, 2019-2027 ($MILLION)
TABLE 13.CHIPLESS RFID MARKET FOR RETAIL, BY REGION 2019–2027 ($MILLION)
TABLE 14.CHIPLESS RFID MARKET FOR HEALTHCARE, BY REGION 2019–2027($MILLION)
TABLE 15.CHIPLESS RFID MARKET FOR LOGISTICS AND TRANSPORTATION, BY REGION 2019–2027($MILLION)
TABLE 16.CHIPLESS RFID MARKET FOR BFSI, BY REGION 2019–2027($MILLION)
TABLE 17.CHIPLESS RFID MARKET FOR OTHERS, BY REGION 2019–2027($MILLION)
TABLE 18.NORTH AMERICA CHIPLESS RFID MARKET, BY PRODUCT TYPE 2019–2027($MILLION)
TABLE 19.NORTH AMERICA CHIPLESS RFID MARKET, BY FREQUENCY 2019–2027($MILLION)
TABLE 20.NORTH AMERICA CHIPLESS RFID MARKET, BY APPLICATION 2019–2027($MILLION)
TABLE 21.NORTH AMERICA CHIPLESS RFID MARKET, BY END USE 2019–2027($MILLION)
TABLE 22.U.S. CHIPLESS RFID MARKET, BY PRODUCT TYPE 2019–2027($MILLION)
TABLE 23.U.S. CHIPLESS RFID MARKET, BY FREQUENCY 2019–2027($MILLION)
TABLE 24.U.S. CHIPLESS RFID MARKET, BY APPLICATION 2019–2027($MILLION)
TABLE 25.U.S. CHIPLESS RFID MARKET, BY END USE 2019–2027($MILLION)
TABLE 26.CANADA CHIPLESS RFID MARKET, BY PRODUCT TYPE 2019–2027($MILLION)
TABLE 27.CANADA CHIPLESS RFID MARKET, BY FREQUENCY 2019–2027($MILLION)
TABLE 28.CANADA CHIPLESS RFID MARKET, BY APPLICATION 2019–2027($MILLION)
TABLE 29.CANADA CHIPLESS RFID MARKET, BY END USE 2019–2027($MILLION)
TABLE 30.MEXICO CHIPLESS RFID MARKET, BY PRODUCT TYPE 2019–2027($MILLION)
TABLE 31.MEXICO CHIPLESS RFID MARKET, BY FREQUENCY 2019–2027($MILLION)
TABLE 32.MEXICO CHIPLESS RFID MARKET, BY APPLICATION 2019–2027($MILLION)
TABLE 33.MEXICO CHIPLESS RFID MARKET, BY END USE 2019–2027($MILLION)
TABLE 34.EUROPE CHIPLESS RFID MARKET, BY PRODUCT TYPE 2019–2027($MILLION)
TABLE 35.EUROPE CHIPLESS RFID MARKET, BY FREQUENCY 2019–2027($MILLION)
TABLE 36.EUROPE CHIPLESS RFID MARKET, BY APPLICATION 2019–2027($MILLION)
TABLE 37.EUROPE CHIPLESS RFID MARKET, BY END USE 2019–2027($MILLION)
TABLE 38.UK CHIPLESS RFID MARKET, BY PRODUCT TYPE 2019–2027($MILLION)
TABLE 39.UK CHIPLESS RFID MARKET, BY FREQUENCY 2019–2027($MILLION)
TABLE 40.UK CHIPLESS RFID MARKET, BY APPLICATION 2019–2027($MILLION)
TABLE 41.UK CHIPLESS RFID MARKET, BY END USE 2019–2027($MILLION)
TABLE 42.GERMANY CHIPLESS RFID MARKET, BY PRODUCT TYPE 2019–2027($MILLION)
TABLE 43.GERMANY CHIPLESS RFID MARKET, BY FREQUENCY 2019–2027($MILLION)
TABLE 44.GERMANY CHIPLESS RFID MARKET, BY APPLICATION 2019–2027($MILLION)
TABLE 45.GERMANY CHIPLESS RFID MARKET, BY END USE 2019–2027($MILLION)
TABLE 46.FRANCE CHIPLESS RFID MARKET, BY PRODUCT TYPE 2019–2027($MILLION)
TABLE 47.FRANCE CHIPLESS RFID MARKET, BY FREQUENCY 2019–2027($MILLION)
TABLE 48.FRANCE CHIPLESS RFID MARKET, BY APPLICATION 2019–2027($MILLION)
TABLE 49.FRANCE CHIPLESS RFID MARKET, BY END USE 2019–2027($MILLION)
TABLE 50.REST OF EUROPE CHIPLESS RFID MARKET, BY PRODUCT TYPE 2019–2027($MILLION)
TABLE 51.REST OF EUROPE CHIPLESS RFID MARKET, BY FREQUENCY 2019–2027($MILLION)
TABLE 52.REST OF EUROPE CHIPLESS RFID MARKET, BY APPLICATION 2019–2027($MILLION)
TABLE 53.REST OF EUROPE CHIPLESS RFID MARKET, BY END USE 2019–2027($MILLION)
TABLE 54.ASIA-PACIFIC CHIPLESS RFID MARKET, BY PRODUCT TYPE 2019–2027($MILLION)
TABLE 55.ASIA-PACIFIC CHIPLESS RFID MARKET, BY FREQUENCY 2019–2027($MILLION)
TABLE 56.ASIA-PACIFIC CHIPLESS RFID MARKET, BY APPLICATION 2019–2027($MILLION)
TABLE 57.ASIA-PACIFIC CHIPLESS RFID MARKET, BY END USE 2019–2027($MILLION)
TABLE 58.CHINA CHIPLESS RFID MARKET, BY PRODUCT TYPE 2019–2027($MILLION)
TABLE 59.CHINA CHIPLESS RFID MARKET, BY FREQUENCY 2019–2027($MILLION)
TABLE 60.CHINA CHIPLESS RFID MARKET, BY APPLICATION 2019–2027($MILLION)
TABLE 61.CHINA CHIPLESS RFID MARKET, BY END USE 2019–2027($MILLION)
TABLE 62.JAPAN CHIPLESS RFID MARKET, BY PRODUCT TYPE 2019–2027($MILLION)
TABLE 63.JAPAN CHIPLESS RFID MARKET, BY FREQUENCY 2019–2027($MILLION)
TABLE 64.JAPAN CHIPLESS RFID MARKET, BY APPLICATION 2019–2027($MILLION)
TABLE 65.JAPAN CHIPLESS RFID MARKET, BY END USE 2019–2027($MILLION)
TABLE 66.INDIA CHIPLESS RFID MARKET, BY PRODUCT TYPE 2019–2027($MILLION)
TABLE 67.INDIA CHIPLESS RFID MARKET, BY FREQUENCY 2019–2027($MILLION)
TABLE 68.INDIA CHIPLESS RFID MARKET, BY APPLICATION 2019–2027($MILLION)
TABLE 69.INDIA CHIPLESS RFID MARKET, BY END USE 2019–2027($MILLION)
TABLE 70.REST OF ASIA-PACIFIC CHIPLESS RFID MARKET, BY PRODUCT TYPE 2019–2027($MILLION)
TABLE 71.REST OF ASIA-PACIFIC CHIPLESS RFID MARKET, BY FREQUENCY 2019–2027($MILLION)
TABLE 72.REST OF ASIA-PACIFIC CHIPLESS RFID MARKET, BY APPLICATION 2019–2027($MILLION)
TABLE 73.REST OF ASIA-PACIFIC CHIPLESS RFID MARKET, BY END USE 2019–2027($MILLION)
TABLE 74.LAMEA CHIPLESS RFID MARKET, BY PRODUCT TYPE 2019–2027($MILLION)
TABLE 75.LAMEA CHIPLESS RFID MARKET, BY FREQUENCY 2019–2027($MILLION)
TABLE 76.LAMEA CHIPLESS RFID MARKET, BY APPLICATION 2019–2027($MILLION)
TABLE 77.LAMEA CHIPLESS RFID MARKET, BY END USE 2019–2027($MILLION)
TABLE 78.LATIN AMERICA CHIPLESS RFID MARKET, BY PRODUCT TYPE 2019–2027($MILLION)
TABLE 79.LATIN AMERICA CHIPLESS RFID MARKET, BY FREQUENCY 2019–2027($MILLION)
TABLE 80.LATIN AMERICA CHIPLESS RFID MARKET, BY APPLICATION 2019–2027($MILLION)
TABLE 81.LATIN AMERICA CHIPLESS RFID MARKET, BY END USE 2019–2027($MILLION)
TABLE 82.MIDDLE EAST CHIPLESS RFID MARKET, BY PRODUCT TYPE 2019–2027($MILLION)
TABLE 83.MIDDLE EAST CHIPLESS RFID MARKET, BY FREQUENCY 2019–2027($MILLION)
TABLE 84.MIDDLE EAST CHIPLESS RFID MARKET, BY APPLICATION 2019–2027($MILLION)
TABLE 85.MIDDLE EAST CHIPLESS RFID MARKET, BY END USE 2019–2027($MILLION)
TABLE 86.AFRICA CHIPLESS RFID MARKET, BY PRODUCT TYPE 2019–2027($MILLION)
TABLE 87.AFRICA CHIPLESS RFID MARKET, BY FREQUENCY 2019–2027($MILLION)
TABLE 88.AFRICA CHIPLESS RFID MARKET, BY APPLICATION 2019–2027($MILLION)
TABLE 89.AFRICA CHIPLESS RFID MARKET, BY END USE 2019–2027($MILLION)
TABLE 90.KEY NEW PRODUCT LAUNCHES (2016-2019)
TABLE 91.KEY ACQUISITIONS (2016-2019)
TABLE 92.KEY COLLABORATION (2016-2019)
TABLE 93.KEY PARTNERSHIP (2016-2019)
TABLE 101.ALIEN TECHNOLOGY.: KEY EXECUTIVES
TABLE 102.ALIEN TECHNOLOGY: COMPANY SNAPSHOT
TABLE 103.ALIEN TECHNOLOGY: OPERATING SEGMENTS
TABLE 104.ALIEN TECHNOLOGY: PRODUCT PORTFOLIO
TABLE 105.ALIEN TECHNOLOGY: KEY STRATEGIC MOVES AND DEVELOPMENTS
TABLE 106.APPLIED WIRELESS IDENTIFICATIONS GROUP, INC.: KEY EXECUTIVES
TABLE 107.APPLIED WIRELESS IDENTIFICATIONS GROUP, INC.: COMPANY SNAPSHOT
TABLE 108.APPLIED WIRELESS IDENTIFICATIONS GROUP, INC.: OPERATING SEGMENTS
TABLE 109.APPLIED WIRELESS IDENTIFICATIONS GROUP, INC.: PRODUCT PORTFOLIO
TABLE 110.AVERY DENNISON CORPORATION: KEY EXECUTIVES
TABLE 111.AVERY DENNISON CORPORATION: COMPANY SNAPSHOT
TABLE 112.AVERY DENNISON CORPORATION: OPERATING SEGMENTS
TABLE 113.AVERY DENNISON CORPORATION: PRODUCT PORTFOLIO
TABLE 114.AVERY DENNISON CORPORATION: KEY STRATEGIC MOVES AND DEVELOPMENTS
TABLE 115.CHECKPOINT SYSTEMS, INC.: KEY EXECUTIVES
TABLE 116.CHECKPOINT SYSTEMS, INC.: COMPANY SNAPSHOT
TABLE 117.CHECKPOINT SYSTEMS, INC.: OPERATING SEGMENTS
TABLE 118.CHECKPOINT SYSTEMS, INC.: PRODUCT PORTFOLIO
TABLE 119.CHECKPOINT SYSTEMS, INC.: KEY STRATEGIC MOVES AND DEVELOPMENTS
TABLE 120.HONEYWELL INTERNATIONAL INC.: KEY EXECUTIVES
TABLE 121.TABLE 20. HONEYWELL INTERNATIONAL INC.: COMPANY SNAPSHOT
TABLE 122.HONEYWELL INTERNATIONAL INC.: OPERATING SEGMENTS
TABLE 123.HONEYWELL INTERNATIONAL INC.: PRODUCT PORTFOLIO
TABLE 124.HONEYWELL INTERNATIONAL INC.: KEY STRATEGIC MOVES AND DEVELOPMENTS
TABLE 125.IDTRONIC GMBH: KEY EXECUTIVES
TABLE 126.IDTRONIC GMBH: COMPANY SNAPSHOT
TABLE 127.IDTRONIC GMBH: OPERATING SEGMENTS
TABLE 128.IDTRONIC GMBH: PRODUCT PORTFOLIO
TABLE 129.IMPINJ, INC.: KEY EXECUTIVES
TABLE 130.IMPINJ, INC.: COMPANY SNAPSHOT
TABLE 131.IMPINJ, INC.: OPERATING SEGMENTS
TABLE 132.IMPINJ, INC.: PRODUCT PORTFOLIO
TABLE 133.IMPINJ, INC.: KEY STRATEGIC MOVES AND DEVELOPMENTS
TABLE 134.INVENGO TECHNOLOGY PTE. LTD.: KEY EXECUTIVES
TABLE 135.INVENGO TECHNOLOGY PTE. LTD.: COMPANY SNAPSHOT
TABLE 136.INVENGO TECHNOLOGY PTE. LTD.: PRODUCT PORTFOLIO
TABLE 137.INVENGO TECHNOLOGY PTE. LTD.: KEY STRATEGIC MOVES AND DEVELOPMENTS
TABLE 138.NXP SEMICONDUCTORS:KEY EXECUTIVES
TABLE 139.NXP SEMICONDUCTORS: COMPANY SNAPSHOT
TABLE 140.NXP SEMICONDUCTORS: OPERATING SEGMENTS
TABLE 141.NXP SEMICONDUCTORS: PRODUCT PORTFOLIO
TABLE 142.ZEBRA TECHNOLOGIES CORP.:KEY EXECUTIVES
TABLE 143.ZEBRA TECHNOLOGIES CORP.: COMPANY SNAPSHOT
TABLE 144.ZEBRA TECHNOLOGIES CORP.: OPERATING SEGMENTS
TABLE 145.ZEBRA TECHNOLOGIES CORP.: PRODUCT PORTFOLIO
TABLE 146.ZEBRA TECHNOLOGIES CORP.: KEY STRATEGIC MOVES AND DEVELOPMENTS
LIST OF FIGURES
FIGURE 01.KEY MARKET SEGMENTS
FIGURE 02.EXECUTIVE SUMMARY
FIGURE 03.EXECUTIVE SUMMARY, BY REGION
FIGURE 04.TOP IMPACTING FACTORS
FIGURE 05.TOP INVESTMENT POCKETS
FIGURE 06.MODERATE TO HIGH BARGAINING POWER OF SUPPLIERS
FIGURE 07.MODERATE THREAT OF NEW ENTRANTS
FIGURE 08.MODERATE THREAT OF SUBSTITUTES
FIGURE 09.MODERATE INTENSITY OF RIVALRY
FIGURE 10.HIGH BARGAINING POWER OF BUYERS
FIGURE 11.PATENT ANALYSIS, BY REGION
FIGURE 12.PATENT ANALYSIS, BY APPLICANT
FIGURE 13.GLOBAL CHIPLESS RFID MARKET, BY PRODUCT TYPE, 2019-2027
FIGURE 14.COMPARATIVE SHARE ANALYSIS OF CHIPLESS RFID MARKET FOR TAG PRODCT TYPE, BY COUNTRY, 2019 & 2027 (%)
FIGURE 15.COMPARATIVE SHARE ANALYSIS OF CHIPLESS RFID MARKET FOR READER PRODCT TYPE, BY COUNTRY, 2019 & 2027 (%)
FIGURE 16.GLOBAL CHIPLESS RFID MARKET, BY FREQUENCY, 2019-2027
FIGURE 17.COMPARATIVE SHARE ANALYSIS OF CHIPLESS RFID MARKET FOR LOW FREQUENCY, BY COUNTRY, 2019 & 2027 (%)
FIGURE 18.COMPARATIVE SHARE ANALYSIS OF CHIPLESS RFID MARKET FOR HIGH FREQUENCY, BY COUNTRY, 2019 & 2027 (%)
FIGURE 19.COMPARATIVE SHARE ANALYSIS OF CHIPLESS RFID MARKET FOR ULTRAHIGH FREQUENCY, BY COUNTRY, 2019 & 2027 (%)
FIGURE 20.GLOBAL CHIPLESS RFID MARKET, BY APPLICATION, 2019-2027
FIGURE 21.COMPARATIVE SHARE ANALYSIS OF CHIPLESS RFID MARKET FOR SMART CARDS, BY COUNTRY, 2019 & 2027 (%)
FIGURE 22.COMPARATIVE SHARE ANALYSIS OF CHIPLESS RFID MARKET FOR SMART TICKETS, BY COUNTRY, 2019 & 2027 (%)
FIGURE 23.COMPARATIVE SHARE ANALYSIS OF CHIPLESS RFID MARKET FOR OTHERS, BY COUNTRY, 2019 & 2027 (%)
FIGURE 24.GLOBAL CHIPLESS RFID MARKET, BY END USER, 2019-2027
FIGURE 25.COMPARATIVE SHARE ANALYSIS OF CHIPLESS RFID MARKET FOR RETAIL, BY COUNTRY, 2019 & 2027 (%)
FIGURE 26.COMPARATIVE SHARE ANALYSIS OF CHIPLESS RFID MARKET FOR HEALTHCARE, BY COUNTRY, 2019 & 2027 (%)
FIGURE 27.COMPARATIVE SHARE ANALYSIS OF CHIPLESS RFID MARKET FOR LOGISTICS AND TRANSPORTATION, BY COUNTRY, 2019 & 2027 (%)
FIGURE 28.COMPARATIVE SHARE ANALYSIS OF CHIPLESS RFID MARKET FOR BFSI, BY COUNTRY, 2019 & 2027 (%)
FIGURE 29.COMPARATIVE SHARE ANALYSIS OF CHIPLESS RFID MARKET FOR OTHERS, BY COUNTRY, 2019 & 2027 (%)
FIGURE 30.GLOBAL CHIPLESS RFID MARKET, BY REGION, 2019-2027
FIGURE 31.NORTH AMERICA CHIPLESS RFID MARKET, BY COUNTRY, 2019-2027
FIGURE 32.U.S. CHIPLESS RFID MARKET, 2019-2027($MILLION)
FIGURE 33.CANADA CHIPLESS RFID MARKET, 2019-2027($MILLION)
FIGURE 34.MEXICO CHIPLESS RFID MARKET, 2019-2027($MILLION)
FIGURE 35.EUROPE CHIPLESS RFID MARKET, BY COUNTRY, 2019-2027
FIGURE 36.UK CHIPLESS RFID MARKET, 2019-2027($MILLION)
FIGURE 37.GERMANY CHIPLESS RFID MARKET, 2019-2027($MILLION)
FIGURE 38.FRANCE CHIPLESS RFID MARKET, 2019-2027($MILLION)
FIGURE 39.REST OF EUROPE CHIPLESS RFID MARKET, 2019-2027($MILLION)
FIGURE 40.ASIA-PACIFIC CHIPLESS RFID MARKET, BY COUNTRY, 2019-2027
FIGURE 41.CHINA CHIPLESS RFID MARKET, 2019-2027($MILLION)
FIGURE 42.JAPAN CHIPLESS RFID MARKET, 2019-2027($MILLION)
FIGURE 43.INDIA CHIPLESS RFID MARKET, 2019-2027($MILLION)
FIGURE 44.REST OF ASIA-PACIFIC CHIPLESS RFID MARKET, 2019-2027($MILLION)
FIGURE 45.LAMEA CHIPLESS RFID MARKET, BY COUNTRY, 2019-2027
FIGURE 46.LATIN AMERICA CHIPLESS RFID MARKET, 2019-2027($MILLION)
FIGURE 47.MIDDLE EAST CHIPLESS RFID MARKET, 2019-2027($MILLION)
FIGURE 48.AFRICA CHIPLESS RFID MARKET, 2019-2027($MILLION)
FIGURE 49.MARKET PLAYER POSITIONING, 2019
FIGURE 50.PRODUCT MAPPING OF TOP 10 PLAYERS
FIGURE 51.COMPETITIVE DASHBOARD
FIGURE 52.COMPETITIVE HEATMAP OF KEY PLAYERS
FIGURE 53.AVERY DENNISON CORPORATION: R&D EXPENDITURE, 2017–2019 ($MILLION)
FIGURE 54.AVERY DENNISON CORPORATION: NET SALES, 2017–2019 ($MILLION)
FIGURE 55.AVERY DENNISON CORPORATION: REVENUE SHARE BY SEGMENT, 2019 (%)
FIGURE 56.AVERY DENNISON CORPORATION: REVENUE SHARE BY REGION, 2019 (%)
FIGURE 57.HONEYWELL INTERNATIONAL INC.: R&D EXPENDITURE, 2017–2019 ($MILLION)
FIGURE 58.HONEYWELL INTERNATIONAL INC.: NET SALES, 2017–2019 ($MILLION)
FIGURE 59.HONEYWELL INTERNATIONAL INC.: REVENUE SHARE BY SEGMENT, 2019 (%)
FIGURE 60.HONEYWELL INTERNATIONAL INC.: REVENUE SHARE BY REGION, 2019 (%)
FIGURE 61.IMPINJ, INC.: R&D EXPENDITURE, 2016–2019 ($MILLION)
FIGURE 62.IMPINJ, INC.: NET SALES, 2016–2019 ($MILLION)
FIGURE 63.IMPINJ, INC.: REVENUE SHARE BY SEGMENT, 2019 (%)
FIGURE 64.IMPINJ, INC.: REVENUE SHARE BY REGION, 2019 (%)
FIGURE 65.NXP SEMICONDUCTORS: R&D EXPENDITURE, 2017–2019 ($MILLION)
FIGURE 66.NXP SEMICONDUCTORS: NET SALES, 2017–2019 ($MILLION)
FIGURE 67.NXP SEMICONDUCTORS: REVENUE SHARE BY SEGMENT, 2019 (%)
FIGURE 68.NXP SEMICONDUCTORS: REVENUE SHARE, BY REGION, 2019 (%)
FIGURE 69.ZEBRA TECHNOLOGIES CORP.: R&D EXPENDITURE, 2017–2019 ($MILLION)
FIGURE 70.ZEBRA TECHNOLOGIES CORP.: NET SALES, 2017–2019 ($MILLION)
FIGURE 71.ZEBRA TECHNOLOGIES CORP.: REVENUE SHARE BY SEGMENT, 2019 (%)
FIGURE 72.ZEBRA TECHNOLOGIES CORP.: REVENUE SHARE BY REGION, 2019 (%)
A chipless RFID system is equipped with a planar encoder (characteristically a printed pattern containing the ID code) & an antenna for communication with the reader. Due to low-cost conductive inks, the cost of the tag can be significantly reduced. The chipless RFID system has benefits over conventional sensors due to its lower radiated power, lower cost, robustness, and longer storage life. Alternatively, chipless RFID system provide identification data & monitor several physical parameters of tagged items without having an active sensor in the circuitry.
The global chipless RFID market is anticipated to witness significant growth over the period of forecast. Factors such as high accuracy, low manufacturing cost, and providing more functions as compared to other alternatives drive the growth of chipless RFID market. However, initially high capital investment is a major restraint to global chipless RFID industry. In addition, growing shift of retailers toward chipless RFID is expected to create opportunities for the chipless RFID industry. Moreover, economically developed nations tend to witness high penetration of chipless RFID technology in various retail segments. Factors such as growing manufacturing sector, incentives in the Union Budget worldwide owing to COVID-19 pandemic, are expected to contribute toward the chipless RFID market growth in the coming years.
The key players of the market focus on introducing technologically advanced products to remain competitive in the market. Product launch, acquisition, collaboration, and partnership are expected to be the prominent strategies adopted by the market players.
Start reading instantly.
This Report and over 68,439+ more Reports, Available with Avenue Library. T&C*.
Enterprise
License/PDF
Library
Membership
*Taxes/Fees, if applicable will be added during checkout. All prices in USD
To ensure high-level data integrity, accurate analysis, and impeccable forecasts
For complete satisfaction
On-demand customization of scope of the report to exactly meet your needs
Targeted market view to provide pertinent information and save time of readers
Get insights on topics that are crucial for your business. Stay abreast of your interest areas.
Get Industry Data AlertsTo ensure high-level data integrity, accurate analysis, and impeccable forecasts
For complete satisfaction
On-demand customization of scope of the report to exactly meet your needs
Targeted market view to provide pertinent information and save time of readers