0
2022
Choline Bitartrate Market

Choline bitartrate Market

by Type (DL, D, L), by Application (Pharmaceutical and Nutritional Supplement, Food and beverage, Baby Food, Others): Global Opportunity Analysis and Industry Forecast, 2021-2031

Report Code: A17003
Jun 2022 | Pages: 255
Tables: 118
Charts: 59
  • Formats*:

  • pdf

    Single User License, Five User
    License & Enterprise User License

  • xls

    Data Pack Excel License

  • ppt

    It comes with the additional cost
    of $2500.00 contact sales.


Choline Bitartrate Market Research, 2031

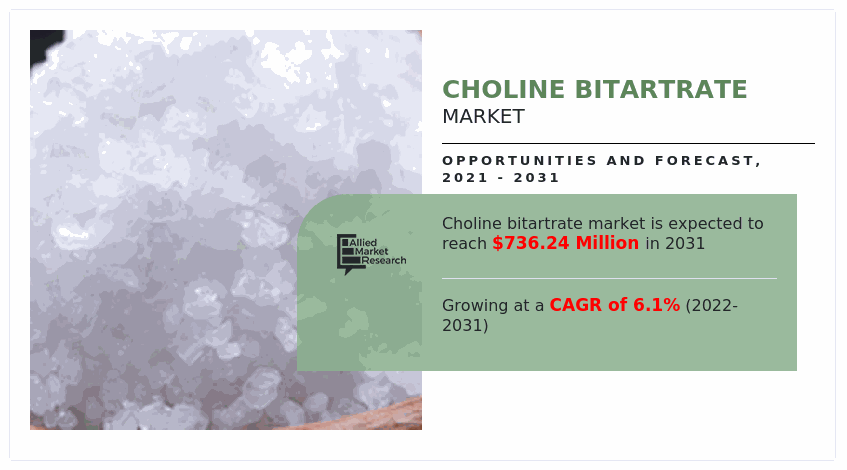
The global choline bitartrate market size was valued at $410.2 million in 2021, and is projected to reach $736.2 million by 2031, growing at a CAGR of 6.1% from 2022 to 2031.

The COVID-19 pandemic has increased demand for choline bitartrate from a wide range of end-use sectors, including pharmaceuticals, dietary supplements, baby food, and animal feed, favorably impacting the global choline bitartrate market. After the development of COVID-19, sales of dietary supplements advertised for immune health increased because many individuals thought that these items might give some protection from SARS-CoV-2 infection and, for those who developed COVID-19, help lessen illness severity. Therefore, the above mentioned factors are predicted to surge the demand for choline bitartrate globally during the COVID-19 pandemic.

Choline bitartrate is a combination of choline and a tartaric acid salt. It absorbs significantly better than pure choline, which is a vital human nutrition. Choline is chemically connected to the vitamin B group. Choline bitartrate and other choline supplements are said to increase athletic performance, lower cholesterol, protect the liver from the effects of alcohol, lower blood pressure, moderate mood swings, improve memory, and treat Alzheimer's disease. Increase in investment in chemicals and their usage surge demand from pharmaceutical & health care, food & beverages, and baby products industry. This is expected to drive the choline bitartrate market growth during the choline bitartrate market forecast period.
Choline Bitartrate Market, Choline Bitartrate Industry, Choline Bitartrate Market Size, Choline Bitartrate Market Share, Choline Bitartrate Market Analysis, Choline Bitartrate Market Trend, Choline Bitartrate Market Growth, Choline Bitartrate Market Forecast

Rise in demand for infant formula, increased demand for fortified food & beverages, and various health benefits of choline bitartrate are the major factors that drive the growth of the global choline bitartrate market. In addition, increase in awareness concerning essential nutrition and rise in inclination toward preventive health care are anticipated to surge the demand for choline bitartrate in the near future. Rise in inclination toward natural food products along with stringent regulation for manufacturing infant formula pose as the major challenge for industry growth.

The choline bitartrate industry is classified into type, application, and region. On the basis of type, the market is segmented into DL, D, and L. On the basis of application, the market is divided into pharmaceutical & nutritional supplement, food & beverage, baby food, and others. Region-wise, the market is analyzed across North America, Europe, Asia-Pacific, and LAMEA. Among the regions, North America held the highest share of the global choline bitartrate market in 2021 owing to increase in demand for baby food and infant formula products. Further, the rise in sales of dietary supplements owing to the hectic routines and stress level of the consumers is anticipated to propel the choline bitartrate market growth during the forecast period.

The key players operating in the global choline bitartrate market include Balchem Inc.; Celtic Chemicals Ltd; Cepham Life Sciences; Fengchen Group Co.,Ltd; Glentham Life Sciences Ltd; MP Biomedicals; Nutragreenlife Biotechnology Co.,Ltd; NutriScience Innovations, LLC; Puyer Group; and TOKYO CHEMICAL INDUSTRY CO., LTD. These companies compete for the share of the market through product launch, joint venture, partnership, and expansion of the production capabilities. For instance, Balchem Inc. announced that the company achieved Non-GMO Project Verification for the VitaCholine brand choline chloride and choline bitartrate ingredient product lines. These certifications are a mark of high quality, safety and transparency in production of the products.
Choline bitartrate Market

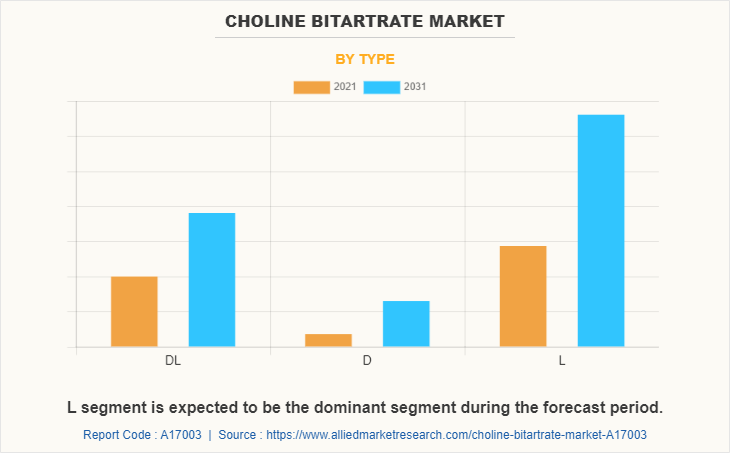
On the basis of type, the L segment dominated the global choline bitartrate market share in terms of revenue, in 2021, owing to developments in the pharmaceuticals and nutraceuticals industry worldwide. L is widely used in the production of tablets, capsules, and powders. It is used in the pharmaceuticals and nutraceuticals industry owing to increase in absorption rate, and maintenance of cellular structure.
Choline bitartrate Market

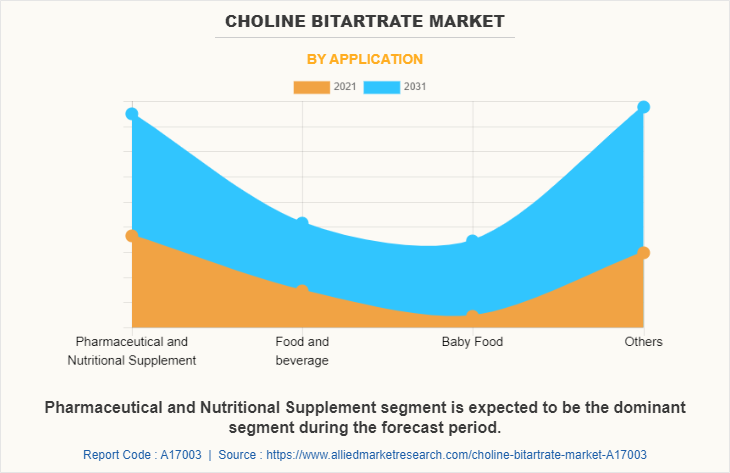
On the basis of application, the pharmaceutical & nutritional supplement segment dominated the global choline bitartrate market in terms of revenue, in 2021, owing to presence of aging population, rise in interest in preventive healthcare, and surge in interest in achieving wellness via healthy food.
Choline bitartrate Market

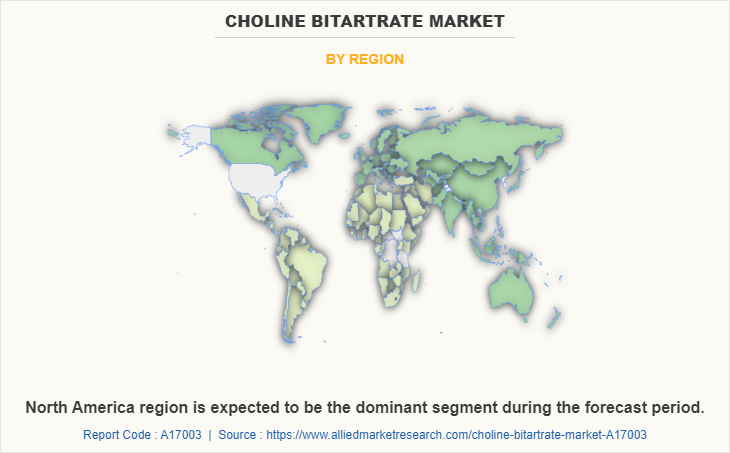
By region, North America dominated the market with the highest revenue share in 2021 owing to increase in demand for baby food and infant formula products. This growth in demand is attributed to increase in disposable incomes, new product innovations, and high birth rate. In addition, surge in working women populace, easy availability, and inability to breastfeed boost the demand for baby food and infant formula products.

COVID-19 Analysis:

The COVID-19 pandemic has increased demand for choline bitartrate from a wide range of end-use sectors, including pharmaceuticals, dietary supplements, baby food, and animal feed, favorably impacting the global choline bitartrate market. After the development of COVID-19, sales of dietary supplements advertised for immune health increased because many individuals thought that these items might give some protection from SARS-CoV-2 infection and, for those who developed COVID-19, help lessen illness severity. Therefore, the above mentioned factors are predicted to surge the demand for choline bitartrate globally during the COVID-19 pandemic.             

Key Benefits For Stakeholders

  • This report provides a quantitative analysis of the market segments, current trends, estimations, and dynamics of the choline bitartrate market analysis from 2021 to 2031 to identify the prevailing choline bitartrate market opportunities.
  • The market research is offered along with information related to key drivers, restraints, and opportunities.
  • Porter's five forces analysis highlights the potency of buyers and suppliers to enable stakeholders make profit-oriented business decisions and strengthen their supplier-buyer network.
  • In-depth analysis of the choline bitartrate market segmentation assists to determine the prevailing market opportunities.
  • Major countries in each region are mapped according to their revenue contribution to the global market.
  • Market player positioning facilitates benchmarking and provides a clear understanding of the present position of the market players.
  • The report includes the analysis of the regional as well as global choline bitartrate market trends, key players, market segments, application areas, and market growth strategies.

Choline bitartrate Market Report Highlights

Aspects Details
By Type
  • DL
  • D
  • L
By Application
  • Baby Food
  • Others
  • Pharmaceutical and Nutritional Supplement
  • Food and beverage
By Region
  • North America  (U.S., Canada, Mexico)
  • Europe  (Germany, France, U.K., Spain, Italy, Rest of Europe)
  • Asia-Pacific  (China, Japan, India, South Korea, Australia, Rest of Asia-Pacific)
  • LAMEA  (Rest of LAMEA, Brazil, Saudi Arabia, South Africa)
Key Market Players Nutragreenlife Biotechnology Co.,Ltd, MP Biomedicals, Cepham Life Sciences, Puyer Group, NutriScience Innovations, LLC, TOKYO CHEMICAL INDUSTRY CO., LTD., Fengchen Group Co.,Ltd, Balchem Inc., Celtic Chemicals Ltd, Glentham Life Sciences Ltd
 
  • CHAPTER 1:INTRODUCTION

    • 1.1.Report description

    • 1.2.Key market segments

    • 1.3.Key benefits to the stakeholders

    • 1.4.Research Methodology

      • 1.4.1.Secondary research

      • 1.4.2.Primary research

      • 1.4.3.Analyst tools and models

  • CHAPTER 2:EXECUTIVE SUMMARY

    • 2.1.Key findings of the study

    • 2.2.CXO Perspective

  • CHAPTER 3:MARKET OVERVIEW

    • 3.1.Market definition and scope

    • 3.2.Key findings

      • 3.2.1.Top investment pockets

    • 3.3.Porter’s five forces analysis

    • 3.4.Top player positioning

    • 3.5.Market dynamics

      • 3.5.1.Drivers

      • 3.5.2.Restraints

      • 3.5.3.Opportunities

    • 3.6.COVID-19 Impact Analysis on the market

    • 3.7.Patent Landscape

    • 3.8.Value Chain Analysis

  • CHAPTER 4: CHOLINE BITARTRATE MARKET, BY TYPE

    • 4.1 Overview

      • 4.1.1 Market size and forecast

    • 4.2 DL

      • 4.2.1 Key market trends, growth factors and opportunities

      • 4.2.2 Market size and forecast, by region

      • 4.2.3 Market analysis by country

    • 4.3 D

      • 4.3.1 Key market trends, growth factors and opportunities

      • 4.3.2 Market size and forecast, by region

      • 4.3.3 Market analysis by country

    • 4.4 L

      • 4.4.1 Key market trends, growth factors and opportunities

      • 4.4.2 Market size and forecast, by region

      • 4.4.3 Market analysis by country

  • CHAPTER 5: CHOLINE BITARTRATE MARKET, BY APPLICATION

    • 5.1 Overview

      • 5.1.1 Market size and forecast

    • 5.2 Pharmaceutical and Nutritional Supplement

      • 5.2.1 Key market trends, growth factors and opportunities

      • 5.2.2 Market size and forecast, by region

      • 5.2.3 Market analysis by country

    • 5.3 Food and beverage

      • 5.3.1 Key market trends, growth factors and opportunities

      • 5.3.2 Market size and forecast, by region

      • 5.3.3 Market analysis by country

    • 5.4 Baby Food

      • 5.4.1 Key market trends, growth factors and opportunities

      • 5.4.2 Market size and forecast, by region

      • 5.4.3 Market analysis by country

    • 5.5 Others

      • 5.5.1 Key market trends, growth factors and opportunities

      • 5.5.2 Market size and forecast, by region

      • 5.5.3 Market analysis by country

  • CHAPTER 6: CHOLINE BITARTRATE MARKET, BY REGION

    • 6.1 Overview

      • 6.1.1 Market size and forecast

    • 6.2 North America

      • 6.2.1 Key trends and opportunities

      • 6.2.2 North America Market size and forecast, by Type

      • 6.2.3 North America Market size and forecast, by Application

      • 6.2.4 North America Market size and forecast, by country

        • 6.2.4.1 U.S.
          • 6.2.4.1.1 Market size and forecast, by Type
          • 6.2.4.1.2 Market size and forecast, by Application
        • 6.2.4.2 Canada
          • 6.2.4.2.1 Market size and forecast, by Type
          • 6.2.4.2.2 Market size and forecast, by Application
        • 6.2.4.3 Mexico
          • 6.2.4.3.1 Market size and forecast, by Type
          • 6.2.4.3.2 Market size and forecast, by Application
    • 6.3 Europe

      • 6.3.1 Key trends and opportunities

      • 6.3.2 Europe Market size and forecast, by Type

      • 6.3.3 Europe Market size and forecast, by Application

      • 6.3.4 Europe Market size and forecast, by country

        • 6.3.4.1 Germany
          • 6.3.4.1.1 Market size and forecast, by Type
          • 6.3.4.1.2 Market size and forecast, by Application
        • 6.3.4.2 France
          • 6.3.4.2.1 Market size and forecast, by Type
          • 6.3.4.2.2 Market size and forecast, by Application
        • 6.3.4.3 U.K.
          • 6.3.4.3.1 Market size and forecast, by Type
          • 6.3.4.3.2 Market size and forecast, by Application
        • 6.3.4.4 Spain
          • 6.3.4.4.1 Market size and forecast, by Type
          • 6.3.4.4.2 Market size and forecast, by Application
        • 6.3.4.5 Italy
          • 6.3.4.5.1 Market size and forecast, by Type
          • 6.3.4.5.2 Market size and forecast, by Application
        • 6.3.4.6 Rest of Europe
          • 6.3.4.6.1 Market size and forecast, by Type
          • 6.3.4.6.2 Market size and forecast, by Application
    • 6.4 Asia-Pacific

      • 6.4.1 Key trends and opportunities

      • 6.4.2 Asia-Pacific Market size and forecast, by Type

      • 6.4.3 Asia-Pacific Market size and forecast, by Application

      • 6.4.4 Asia-Pacific Market size and forecast, by country

        • 6.4.4.1 China
          • 6.4.4.1.1 Market size and forecast, by Type
          • 6.4.4.1.2 Market size and forecast, by Application
        • 6.4.4.2 Japan
          • 6.4.4.2.1 Market size and forecast, by Type
          • 6.4.4.2.2 Market size and forecast, by Application
        • 6.4.4.3 India
          • 6.4.4.3.1 Market size and forecast, by Type
          • 6.4.4.3.2 Market size and forecast, by Application
        • 6.4.4.4 South Korea
          • 6.4.4.4.1 Market size and forecast, by Type
          • 6.4.4.4.2 Market size and forecast, by Application
        • 6.4.4.5 Australia
          • 6.4.4.5.1 Market size and forecast, by Type
          • 6.4.4.5.2 Market size and forecast, by Application
        • 6.4.4.6 Rest of Asia-Pacific
          • 6.4.4.6.1 Market size and forecast, by Type
          • 6.4.4.6.2 Market size and forecast, by Application
    • 6.5 LAMEA

      • 6.5.1 Key trends and opportunities

      • 6.5.2 LAMEA Market size and forecast, by Type

      • 6.5.3 LAMEA Market size and forecast, by Application

      • 6.5.4 LAMEA Market size and forecast, by country

        • 6.5.4.1 Brazil
          • 6.5.4.1.1 Market size and forecast, by Type
          • 6.5.4.1.2 Market size and forecast, by Application
        • 6.5.4.2 Saudi Arabia
          • 6.5.4.2.1 Market size and forecast, by Type
          • 6.5.4.2.2 Market size and forecast, by Application
        • 6.5.4.3 South Africa
          • 6.5.4.3.1 Market size and forecast, by Type
          • 6.5.4.3.2 Market size and forecast, by Application
        • 6.5.4.4 Rest of LAMEA
          • 6.5.4.4.1 Market size and forecast, by Type
          • 6.5.4.4.2 Market size and forecast, by Application
  • CHAPTER 7: COMPANY LANDSCAPE

    • 7.1. Introduction

    • 7.2. Top winning strategies

    • 7.3. Product Mapping of Top 10 Player

    • 7.4. Competitive Dashboard

    • 7.5. Competitive Heatmap

    • 7.6. Key developments

  • CHAPTER 8: COMPANY PROFILES

    • 8.1 Balchem Inc.

      • 8.1.1 Company overview

      • 8.1.2 Company snapshot

      • 8.1.3 Operating business segments

      • 8.1.4 Product portfolio

      • 8.1.5 Business performance

      • 8.1.6 Key strategic moves and developments

    • 8.2 Celtic Chemicals Ltd

      • 8.2.1 Company overview

      • 8.2.2 Company snapshot

      • 8.2.3 Operating business segments

      • 8.2.4 Product portfolio

      • 8.2.5 Business performance

      • 8.2.6 Key strategic moves and developments

    • 8.3 Cepham Life Sciences

      • 8.3.1 Company overview

      • 8.3.2 Company snapshot

      • 8.3.3 Operating business segments

      • 8.3.4 Product portfolio

      • 8.3.5 Business performance

      • 8.3.6 Key strategic moves and developments

    • 8.4 Fengchen Group Co.,Ltd

      • 8.4.1 Company overview

      • 8.4.2 Company snapshot

      • 8.4.3 Operating business segments

      • 8.4.4 Product portfolio

      • 8.4.5 Business performance

      • 8.4.6 Key strategic moves and developments

    • 8.5 Glentham Life Sciences Ltd

      • 8.5.1 Company overview

      • 8.5.2 Company snapshot

      • 8.5.3 Operating business segments

      • 8.5.4 Product portfolio

      • 8.5.5 Business performance

      • 8.5.6 Key strategic moves and developments

    • 8.6 MP Biomedicals

      • 8.6.1 Company overview

      • 8.6.2 Company snapshot

      • 8.6.3 Operating business segments

      • 8.6.4 Product portfolio

      • 8.6.5 Business performance

      • 8.6.6 Key strategic moves and developments

    • 8.7 Nutragreenlife Biotechnology Co.,Ltd

      • 8.7.1 Company overview

      • 8.7.2 Company snapshot

      • 8.7.3 Operating business segments

      • 8.7.4 Product portfolio

      • 8.7.5 Business performance

      • 8.7.6 Key strategic moves and developments

    • 8.8 NutriScience Innovations, LLC

      • 8.8.1 Company overview

      • 8.8.2 Company snapshot

      • 8.8.3 Operating business segments

      • 8.8.4 Product portfolio

      • 8.8.5 Business performance

      • 8.8.6 Key strategic moves and developments

    • 8.9 Puyer Group

      • 8.9.1 Company overview

      • 8.9.2 Company snapshot

      • 8.9.3 Operating business segments

      • 8.9.4 Product portfolio

      • 8.9.5 Business performance

      • 8.9.6 Key strategic moves and developments

    • 8.10 TOKYO CHEMICAL INDUSTRY CO., LTD.

      • 8.10.1 Company overview

      • 8.10.2 Company snapshot

      • 8.10.3 Operating business segments

      • 8.10.4 Product portfolio

      • 8.10.5 Business performance

      • 8.10.6 Key strategic moves and developments

  • LIST OF TABLES

  • TABLE 1. GLOBAL CHOLINE BITARTRATE MARKET, BY TYPE, 2021-2031 ($MILLION)
    TABLE 2. CHOLINE BITARTRATE MARKET SIZE, FOR DL, BY REGION, 2021-2031 ($MILLION)
    TABLE 3. CHOLINE BITARTRATE MARKET FOR DL BY COUNTRY, 2021-2031 ($MILLION)
    TABLE 4. CHOLINE BITARTRATE MARKET SIZE, FOR D, BY REGION, 2021-2031 ($MILLION)
    TABLE 5. CHOLINE BITARTRATE MARKET FOR D BY COUNTRY, 2021-2031 ($MILLION)
    TABLE 6. CHOLINE BITARTRATE MARKET SIZE, FOR L, BY REGION, 2021-2031 ($MILLION)
    TABLE 7. CHOLINE BITARTRATE MARKET FOR L BY COUNTRY, 2021-2031 ($MILLION)
    TABLE 8. GLOBAL CHOLINE BITARTRATE MARKET, BY APPLICATION, 2021-2031 ($MILLION)
    TABLE 9. CHOLINE BITARTRATE MARKET SIZE, FOR PHARMACEUTICAL AND NUTRITIONAL SUPPLEMENT, BY REGION, 2021-2031 ($MILLION)
    TABLE 10. CHOLINE BITARTRATE MARKET FOR PHARMACEUTICAL AND NUTRITIONAL SUPPLEMENT BY COUNTRY, 2021-2031 ($MILLION)
    TABLE 11. CHOLINE BITARTRATE MARKET SIZE, FOR FOOD AND BEVERAGE, BY REGION, 2021-2031 ($MILLION)
    TABLE 12. CHOLINE BITARTRATE MARKET FOR FOOD AND BEVERAGE BY COUNTRY, 2021-2031 ($MILLION)
    TABLE 13. CHOLINE BITARTRATE MARKET SIZE, FOR BABY FOOD, BY REGION, 2021-2031 ($MILLION)
    TABLE 14. CHOLINE BITARTRATE MARKET FOR BABY FOOD BY COUNTRY, 2021-2031 ($MILLION)
    TABLE 15. CHOLINE BITARTRATE MARKET SIZE, FOR OTHERS, BY REGION, 2021-2031 ($MILLION)
    TABLE 16. CHOLINE BITARTRATE MARKET FOR OTHERS BY COUNTRY, 2021-2031 ($MILLION)
    TABLE 17. CHOLINE BITARTRATE MARKET, BY REGION, 2021-2031 ($MILLION)
    TABLE 18. NORTH AMERICA CHOLINE BITARTRATE MARKET, BY TYPE, 2021-2031 ($MILLION)
    TABLE 19. NORTH AMERICA CHOLINE BITARTRATE MARKET, BY APPLICATION, 2021-2031 ($MILLION)
    TABLE 20. NORTH AMERICA CHOLINE BITARTRATE MARKET, BY COUNTRY, 2021-2031 ($MILLION)
    TABLE 21. U.S. CHOLINE BITARTRATE MARKET, BY TYPE, 2021-2031 ($MILLION)
    TABLE 22. U.S. CHOLINE BITARTRATE MARKET, BY APPLICATION, 2021-2031 ($MILLION)
    TABLE 23. CANADA CHOLINE BITARTRATE MARKET, BY TYPE, 2021-2031 ($MILLION)
    TABLE 24. CANADA CHOLINE BITARTRATE MARKET, BY APPLICATION, 2021-2031 ($MILLION)
    TABLE 25. MEXICO CHOLINE BITARTRATE MARKET, BY TYPE, 2021-2031 ($MILLION)
    TABLE 26. MEXICO CHOLINE BITARTRATE MARKET, BY APPLICATION, 2021-2031 ($MILLION)
    TABLE 27. EUROPE CHOLINE BITARTRATE MARKET, BY TYPE, 2021-2031 ($MILLION)
    TABLE 28. EUROPE CHOLINE BITARTRATE MARKET, BY APPLICATION, 2021-2031 ($MILLION)
    TABLE 29. EUROPE CHOLINE BITARTRATE MARKET, BY COUNTRY, 2021-2031 ($MILLION)
    TABLE 30. GERMANY CHOLINE BITARTRATE MARKET, BY TYPE, 2021-2031 ($MILLION)
    TABLE 31. GERMANY CHOLINE BITARTRATE MARKET, BY APPLICATION, 2021-2031 ($MILLION)
    TABLE 32. FRANCE CHOLINE BITARTRATE MARKET, BY TYPE, 2021-2031 ($MILLION)
    TABLE 33. FRANCE CHOLINE BITARTRATE MARKET, BY APPLICATION, 2021-2031 ($MILLION)
    TABLE 34. U.K. CHOLINE BITARTRATE MARKET, BY TYPE, 2021-2031 ($MILLION)
    TABLE 35. U.K. CHOLINE BITARTRATE MARKET, BY APPLICATION, 2021-2031 ($MILLION)
    TABLE 36. SPAIN CHOLINE BITARTRATE MARKET, BY TYPE, 2021-2031 ($MILLION)
    TABLE 37. SPAIN CHOLINE BITARTRATE MARKET, BY APPLICATION, 2021-2031 ($MILLION)
    TABLE 38. ITALY CHOLINE BITARTRATE MARKET, BY TYPE, 2021-2031 ($MILLION)
    TABLE 39. ITALY CHOLINE BITARTRATE MARKET, BY APPLICATION, 2021-2031 ($MILLION)
    TABLE 40. REST OF EUROPE CHOLINE BITARTRATE MARKET, BY TYPE, 2021-2031 ($MILLION)
    TABLE 41. REST OF EUROPE CHOLINE BITARTRATE MARKET, BY APPLICATION, 2021-2031 ($MILLION)
    TABLE 42. ASIA-PACIFIC CHOLINE BITARTRATE MARKET, BY TYPE, 2021-2031 ($MILLION)
    TABLE 43. ASIA-PACIFIC CHOLINE BITARTRATE MARKET, BY APPLICATION, 2021-2031 ($MILLION)
    TABLE 44. ASIA-PACIFIC CHOLINE BITARTRATE MARKET, BY COUNTRY, 2021-2031 ($MILLION)
    TABLE 45. CHINA CHOLINE BITARTRATE MARKET, BY TYPE, 2021-2031 ($MILLION)
    TABLE 46. CHINA CHOLINE BITARTRATE MARKET, BY APPLICATION, 2021-2031 ($MILLION)
    TABLE 47. JAPAN CHOLINE BITARTRATE MARKET, BY TYPE, 2021-2031 ($MILLION)
    TABLE 48. JAPAN CHOLINE BITARTRATE MARKET, BY APPLICATION, 2021-2031 ($MILLION)
    TABLE 49. INDIA CHOLINE BITARTRATE MARKET, BY TYPE, 2021-2031 ($MILLION)
    TABLE 50. INDIA CHOLINE BITARTRATE MARKET, BY APPLICATION, 2021-2031 ($MILLION)
    TABLE 51. SOUTH KOREA CHOLINE BITARTRATE MARKET, BY TYPE, 2021-2031 ($MILLION)
    TABLE 52. SOUTH KOREA CHOLINE BITARTRATE MARKET, BY APPLICATION, 2021-2031 ($MILLION)
    TABLE 53. AUSTRALIA CHOLINE BITARTRATE MARKET, BY TYPE, 2021-2031 ($MILLION)
    TABLE 54. AUSTRALIA CHOLINE BITARTRATE MARKET, BY APPLICATION, 2021-2031 ($MILLION)
    TABLE 55. REST OF ASIA-PACIFIC CHOLINE BITARTRATE MARKET, BY TYPE, 2021-2031 ($MILLION)
    TABLE 56. REST OF ASIA-PACIFIC CHOLINE BITARTRATE MARKET, BY APPLICATION, 2021-2031 ($MILLION)
    TABLE 57. LAMEA CHOLINE BITARTRATE MARKET, BY TYPE, 2021-2031 ($MILLION)
    TABLE 58. LAMEA CHOLINE BITARTRATE MARKET, BY APPLICATION, 2021-2031 ($MILLION)
    TABLE 59. LAMEA CHOLINE BITARTRATE MARKET, BY COUNTRY, 2021-2031 ($MILLION)
    TABLE 60. BRAZIL CHOLINE BITARTRATE MARKET, BY TYPE, 2021-2031 ($MILLION)
    TABLE 61. BRAZIL CHOLINE BITARTRATE MARKET, BY APPLICATION, 2021-2031 ($MILLION)
    TABLE 62. SAUDI ARABIA CHOLINE BITARTRATE MARKET, BY TYPE, 2021-2031 ($MILLION)
    TABLE 63. SAUDI ARABIA CHOLINE BITARTRATE MARKET, BY APPLICATION, 2021-2031 ($MILLION)
    TABLE 64. SOUTH AFRICA CHOLINE BITARTRATE MARKET, BY TYPE, 2021-2031 ($MILLION)
    TABLE 65. SOUTH AFRICA CHOLINE BITARTRATE MARKET, BY APPLICATION, 2021-2031 ($MILLION)
    TABLE 66. REST OF LAMEA CHOLINE BITARTRATE MARKET, BY TYPE, 2021-2031 ($MILLION)
    TABLE 67. REST OF LAMEA CHOLINE BITARTRATE MARKET, BY APPLICATION, 2021-2031 ($MILLION)
    TABLE 68.BALCHEM INC.: COMPANY SNAPSHOT
    TABLE 69.BALCHEM INC.: OPERATING SEGMENTS
    TABLE 70.BALCHEM INC.: PRODUCT PORTFOLIO
    TABLE 71.BALCHEM INC.: NET SALES,
    TABLE 72.BALCHEM INC.: KEY STRATERGIES
    TABLE 73.CELTIC CHEMICALS LTD: COMPANY SNAPSHOT
    TABLE 74.CELTIC CHEMICALS LTD: OPERATING SEGMENTS
    TABLE 75.CELTIC CHEMICALS LTD: PRODUCT PORTFOLIO
    TABLE 76.CELTIC CHEMICALS LTD: NET SALES,
    TABLE 77.CELTIC CHEMICALS LTD: KEY STRATERGIES
    TABLE 78.CEPHAM LIFE SCIENCES: COMPANY SNAPSHOT
    TABLE 79.CEPHAM LIFE SCIENCES: OPERATING SEGMENTS
    TABLE 80.CEPHAM LIFE SCIENCES: PRODUCT PORTFOLIO
    TABLE 81.CEPHAM LIFE SCIENCES: NET SALES,
    TABLE 82.CEPHAM LIFE SCIENCES: KEY STRATERGIES
    TABLE 83.FENGCHEN GROUP CO.,LTD: COMPANY SNAPSHOT
    TABLE 84.FENGCHEN GROUP CO.,LTD: OPERATING SEGMENTS
    TABLE 85.FENGCHEN GROUP CO.,LTD: PRODUCT PORTFOLIO
    TABLE 86.FENGCHEN GROUP CO.,LTD: NET SALES,
    TABLE 87.FENGCHEN GROUP CO.,LTD: KEY STRATERGIES
    TABLE 88.GLENTHAM LIFE SCIENCES LTD: COMPANY SNAPSHOT
    TABLE 89.GLENTHAM LIFE SCIENCES LTD: OPERATING SEGMENTS
    TABLE 90.GLENTHAM LIFE SCIENCES LTD: PRODUCT PORTFOLIO
    TABLE 91.GLENTHAM LIFE SCIENCES LTD: NET SALES,
    TABLE 92.GLENTHAM LIFE SCIENCES LTD: KEY STRATERGIES
    TABLE 93.MP BIOMEDICALS: COMPANY SNAPSHOT
    TABLE 94.MP BIOMEDICALS: OPERATING SEGMENTS
    TABLE 95.MP BIOMEDICALS: PRODUCT PORTFOLIO
    TABLE 96.MP BIOMEDICALS: NET SALES,
    TABLE 97.MP BIOMEDICALS: KEY STRATERGIES
    TABLE 98.NUTRAGREENLIFE BIOTECHNOLOGY CO.,LTD: COMPANY SNAPSHOT
    TABLE 99.NUTRAGREENLIFE BIOTECHNOLOGY CO.,LTD: OPERATING SEGMENTS
    TABLE 100.NUTRAGREENLIFE BIOTECHNOLOGY CO.,LTD: PRODUCT PORTFOLIO
    TABLE 101.NUTRAGREENLIFE BIOTECHNOLOGY CO.,LTD: NET SALES,
    TABLE 102.NUTRAGREENLIFE BIOTECHNOLOGY CO.,LTD: KEY STRATERGIES
    TABLE 103.NUTRISCIENCE INNOVATIONS, LLC: COMPANY SNAPSHOT
    TABLE 104.NUTRISCIENCE INNOVATIONS, LLC: OPERATING SEGMENTS
    TABLE 105.NUTRISCIENCE INNOVATIONS, LLC: PRODUCT PORTFOLIO
    TABLE 106.NUTRISCIENCE INNOVATIONS, LLC: NET SALES,
    TABLE 107.NUTRISCIENCE INNOVATIONS, LLC: KEY STRATERGIES
    TABLE 108.PUYER GROUP: COMPANY SNAPSHOT
    TABLE 109.PUYER GROUP: OPERATING SEGMENTS
    TABLE 110.PUYER GROUP: PRODUCT PORTFOLIO
    TABLE 111.PUYER GROUP: NET SALES,
    TABLE 112.PUYER GROUP: KEY STRATERGIES
    TABLE 113.TOKYO CHEMICAL INDUSTRY CO., LTD.: COMPANY SNAPSHOT
    TABLE 114.TOKYO CHEMICAL INDUSTRY CO., LTD.: OPERATING SEGMENTS
    TABLE 115.TOKYO CHEMICAL INDUSTRY CO., LTD.: PRODUCT PORTFOLIO
    TABLE 116.TOKYO CHEMICAL INDUSTRY CO., LTD.: NET SALES,
    TABLE 117.TOKYO CHEMICAL INDUSTRY CO., LTD.: KEY STRATERGIES
  • LIST OF FIGURES

  • FIGURE 1.CHOLINE BITARTRATE MARKET SEGMENTATION
    FIGURE 2.CHOLINE BITARTRATE MARKET,2021-2031
    FIGURE 3.CHOLINE BITARTRATE MARKET,2021-2031
    FIGURE 4. TOP INVESTMENT POCKETS, BY REGION
    FIGURE 5.PORTER FIVE-1
    FIGURE 6.PORTER FIVE-2
    FIGURE 7.PORTER FIVE-3
    FIGURE 8.PORTER FIVE-4
    FIGURE 9.PORTER FIVE-5
    FIGURE 10.TOP PLAYER POSITIONING
    FIGURE 11.CHOLINE BITARTRATE MARKET:DRIVERS, RESTRAINTS AND OPPORTUNITIES
    FIGURE 12.PATENT ANALYSIS BY COMPANY
    FIGURE 13.PATENT ANALYSIS BY COUNTRY
    FIGURE 14.VALUE CHAIN ANALYSIS
    FIGURE 15.CHOLINE BITARTRATE MARKET,BY TYPE,2021(%)
    FIGURE 16.COMPARATIVE SHARE ANALYSIS OF DL CHOLINE BITARTRATE MARKET,2021-2031(%)
    FIGURE 17.COMPARATIVE SHARE ANALYSIS OF D CHOLINE BITARTRATE MARKET,2021-2031(%)
    FIGURE 18.COMPARATIVE SHARE ANALYSIS OF L CHOLINE BITARTRATE MARKET,2021-2031(%)
    FIGURE 19.CHOLINE BITARTRATE MARKET,BY APPLICATION,2021(%)
    FIGURE 20.COMPARATIVE SHARE ANALYSIS OF PHARMACEUTICAL AND NUTRITIONAL SUPPLEMENT CHOLINE BITARTRATE MARKET,2021-2031(%)
    FIGURE 21.COMPARATIVE SHARE ANALYSIS OF FOOD AND BEVERAGE CHOLINE BITARTRATE MARKET,2021-2031(%)
    FIGURE 22.COMPARATIVE SHARE ANALYSIS OF BABY FOOD CHOLINE BITARTRATE MARKET,2021-2031(%)
    FIGURE 23.COMPARATIVE SHARE ANALYSIS OF OTHERS CHOLINE BITARTRATE MARKET,2021-2031(%)
    FIGURE 24.CHOLINE BITARTRATE MARKET BY REGION,2021
    FIGURE 25.U.S. CHOLINE BITARTRATE MARKET,2021-2031($MILLION)
    FIGURE 26.CANADA CHOLINE BITARTRATE MARKET,2021-2031($MILLION)
    FIGURE 27.MEXICO CHOLINE BITARTRATE MARKET,2021-2031($MILLION)
    FIGURE 28.GERMANY CHOLINE BITARTRATE MARKET,2021-2031($MILLION)
    FIGURE 29.FRANCE CHOLINE BITARTRATE MARKET,2021-2031($MILLION)
    FIGURE 30.U.K. CHOLINE BITARTRATE MARKET,2021-2031($MILLION)
    FIGURE 31.SPAIN CHOLINE BITARTRATE MARKET,2021-2031($MILLION)
    FIGURE 32.ITALY CHOLINE BITARTRATE MARKET,2021-2031($MILLION)
    FIGURE 33.REST OF EUROPE CHOLINE BITARTRATE MARKET,2021-2031($MILLION)
    FIGURE 34.CHINA CHOLINE BITARTRATE MARKET,2021-2031($MILLION)
    FIGURE 35.JAPAN CHOLINE BITARTRATE MARKET,2021-2031($MILLION)
    FIGURE 36.INDIA CHOLINE BITARTRATE MARKET,2021-2031($MILLION)
    FIGURE 37.SOUTH KOREA CHOLINE BITARTRATE MARKET,2021-2031($MILLION)
    FIGURE 38.AUSTRALIA CHOLINE BITARTRATE MARKET,2021-2031($MILLION)
    FIGURE 39.REST OF ASIA-PACIFIC CHOLINE BITARTRATE MARKET,2021-2031($MILLION)
    FIGURE 40.BRAZIL CHOLINE BITARTRATE MARKET,2021-2031($MILLION)
    FIGURE 41.SAUDI ARABIA CHOLINE BITARTRATE MARKET,2021-2031($MILLION)
    FIGURE 42.SOUTH AFRICA CHOLINE BITARTRATE MARKET,2021-2031($MILLION)
    FIGURE 43.REST OF LAMEA CHOLINE BITARTRATE MARKET,2021-2031($MILLION)
    FIGURE 44. TOP WINNING STRATEGIES, BY YEAR
    FIGURE 45. TOP WINNING STRATEGIES, BY DEVELOPMENT
    FIGURE 46. TOP WINNING STRATEGIES, BY COMPANY
    FIGURE 47.PRODUCT MAPPING OF TOP 10 PLAYERS
    FIGURE 48.COMPETITIVE DASHBOARD
    FIGURE 49.COMPETITIVE HEATMAP OF TOP 10 KEY PLAYERS
    FIGURE 50.BALCHEM INC..: NET SALES ,($MILLION)
    FIGURE 51.CELTIC CHEMICALS LTD.: NET SALES ,($MILLION)
    FIGURE 52.CEPHAM LIFE SCIENCES.: NET SALES ,($MILLION)
    FIGURE 53.FENGCHEN GROUP CO.,LTD.: NET SALES ,($MILLION)
    FIGURE 54.GLENTHAM LIFE SCIENCES LTD.: NET SALES ,($MILLION)
    FIGURE 55.MP BIOMEDICALS.: NET SALES ,($MILLION)
    FIGURE 56.NUTRAGREENLIFE BIOTECHNOLOGY CO.,LTD.: NET SALES ,($MILLION)
    FIGURE 57.NUTRISCIENCE INNOVATIONS, LLC.: NET SALES ,($MILLION)
    FIGURE 58.PUYER GROUP.: NET SALES ,($MILLION)
    FIGURE 59.TOKYO CHEMICAL INDUSTRY CO., LTD..: NET SALES ,($MILLION)


According to the opinions of various CXOs of leading companies, the choline bitartrate market is driven by health benefits associated with choline bitartrate and rise in demand for infant formula and dietary supplements.

Moreover, the North America region is projected to register a robust growth owing to increase in demand for baby food and infant formula products. This growth in demand is attributed to increase in disposable incomes, new product innovations, and high birth rate. In addition, rise in working women populace, easy availability and inability to breastfeed boost the demand for baby food and infant formula products.

Further, the presence of large number of manufacturers such as Balchem Inc.; Cepham Life Sciences, and NutriScience Innovations, LLC; and others, is driving the market growth in the region. However, rise in inclination toward natural food products along with stringent regulation for manufacturing infant formula are anticipated to hamper the market growth.


PURCHASE OPTIONS

Call or Email us

U.S.-Canada Toll-free: +1-800-792-5285
Int'l : +1-503-894-6022
Europe : +44-845-528-1300
Email : help@alliedmarketresearch.com
 
FREQUENTLY ASKED QUESTIONS?

A. Rise in demand for infant formula, increased demand for fortified food & beverages, and various health benefits of choline bitartrate are the major factors that drive the growth of the global choline bitartrate market.

A. The global choline bitartrate market was valued at $410.2 million in 2021, and is projected to reach $736.2 million by 2031, registering a CAGR of 6.1% from 2022 to 2031.

A. The key players operating in the global choline bitartrate market include Balchem Inc.; Celtic Chemicals Ltd; Cepham Life Sciences; Fengchen Group Co.,Ltd; Glentham Life Sciences Ltd; MP Biomedicals; Nutragreenlife Biotechnology Co.,Ltd; NutriScience Innovations, LLC; Puyer Group; and TOKYO CHEMICAL INDUSTRY CO., LTD.

A. Pharmaceutical & nutritional supplement industry is projected to increase the demand for choline bitartrate.

A. The segments are covered in choline bitartrate market report are type and application.

Looking for Customization?

 Customization Request

Have a Question?

 Speak with Analyst

Any Confusion?

 Inquire Before Buying

Have a glance of the Report

  Request Sample
RELATED TAGS

Purchase Full Report of
Choline Bitartrate Market

Start reading instantly.
This Report and over 66,804+ more Reports, Available with Avenue Library. T&C*.

  • Online Only
  • $3,456
  • Online cloud access only
  • Restricted print, copy, paste & download
  • Read only
  • Free industry update
    (Within 180 days)
  • Free report update in next update cycle
    (Jun 2023 - Jun 2024)
  • Data Pack
  • $3,840
  • Restricted to one authorized user
  • One print only
  • Available in
    Excel
  • Free industry update
    (Within 180 days)
  •   Free report update in next update cycle
    (Jun 2023 - Jun 2024)
  • Single User
  • $5,769
  • Restricted to one authorized user
  • One print only
  • Available in
    PDF
  • Free industry update
    (Within 180 days)
  •   Free report update in next update cycle
    (Jun 2023 - Jun 2024)
  • Five Users
  • $6,450
  • Limited to five authorized users
  • Print upto five copies
  • Available in
    PDF
  • Free industry update
    (Within 180 days)
  •   Free report update in next update cycle
    (Jun 2023 - Jun 2024)
  • Enterprise
    License/PDF

  • $10,995
  • Unlimited
    within
    company/enterprise
  • Available in Excel & PDF
  • Free industry update
    (Within 180 days)
  •   Free report update in next update cycle
    (Jun 2023 - Jun 2024)
  • Library
    Membership

  • $999 $ 1,175
    Per User/ Per month/ Billed annually
  • Published Content
    E-access
  • Company Profiles
    E-access
  • Newly Added Content Access
  • 10 PDF
    Downloads
  • 5 Excel Data
    Pack Downloads
  • 250 Company Profiles PDF Downloads
  • Buy Now

*Taxes/Fees, if applicable will be added during checkout. All prices in USD

RELATED REPORTS
 

Why Allied Market Research?


Infallible Methodology

To ensure high-level data integrity, accurate analysis, and impeccable forecasts

Analyst Support

For complete satisfaction

Customization

On-demand customization of scope of the report to exactly meet your needs

TARGETED MARKET VIEW

Targeted market view to provide pertinent information and save time of readers

Get fresh content delivered

Get insights on topics that are crucial for your business. Stay abreast of your interest areas.

Get Industry Data Alerts

Why Allied Market Research?

Infallible Methodology

To ensure high-level data integrity, accurate analysis, and impeccable forecasts

Analyst Support

For complete satisfaction

Customization

On-demand customization of scope of the report to exactly meet your needs

TARGETED MARKET VIEW

Targeted market view to provide pertinent information and save time of readers