0
2022
Claims Processing Software Market

Claims Processing Software Market

by Component (Software, Services), by Enterprise Size (Large Enterprises, Small and Medium-sized Enterprises), by End User (Insurance Companies, Insurance Intermediaries, Agents and Brokers, Others): Global Opportunity Analysis and Industry Forecast, 2020-2030

Report Code: A06934
May 2022 | Pages: 211
Tables: 132
Charts: 55
  • Formats*:

  • pdf

    Single User License, Five User
    License & Enterprise User License

  • xls

    Data Pack Excel License

  • ppt

    It comes with the additional cost
    of $2500.00 contact sales.


Claims Processing Software Market Research, 2030

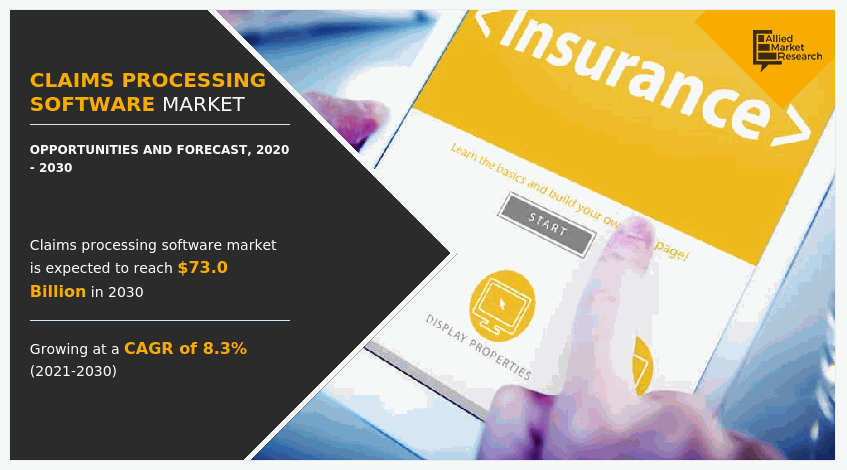
The global claims processing software market size was valued at $33.9 billion in 2020, and is projected to reach $73.0 billion by 2030, growing at a CAGR of 8.3% from 2021 to 2030.

The COVID-19 pandemic impacted the overall economy that resulted in business losses as people were suffering from the virus and businesses were closed down due to the lockdown. This resulted in a huge surge in claims settlement by consumers for managing business losses and claim their health insurance policies.

Claim processing software is a digital platform tailored to needs of insurers. Its primary purpose is to streamline claims to have a fast and efficient outcome.  One of its most notable features is the offering of cloud-based solutions that enable access to the software on any computer with an internet connection. Any insurance company that uses claim processing software will benefit from its ability to manage the entire claim lifecycle from its first filing until it is closed in one centralized location. Claim automation software is developed with efficiency in mind, automating substantial portions of the workflow process.

Claims processing software allows insurance companies to handle every aspect of claims management within one system, allowing easy access to consumer data and improved workflow. In addition, it is used by independent adjusting firms to streamline the claims management process. Thus, this is a major factor that propels the claims processing software market growth. Furthermore, claims processing software eliminates the need for manual methods and reduces errors, saves time, and increases accuracy of data. Therefore, these are some of the factors that drive the market growth. However, startup cost of purchasing necessary insurance claim management software is a major factor that limits the claims processing software market. On the contrary, there is a surge in adoption of claims processing software by insurance firms in developing countries, owing to technological advancements in these countries. In addition, customer preference toward claims processing software, owing to faster claims settlement is expected to create lucrative claims processing software market opportunity in the upcoming years.

By component, the software segment generated highest revenue in 2020. This is attributed to the fact that claim processing software allows for a comprehensive view of claims, making it easier to spot inconsistencies and early detection of potential fraud.  In addition, claims processing software can detect errors much more easily than the human eye. This is attributed to integrated machine learning and artificial intelligence that present accurate information to easily run reports and complete views of status situations. However, the services segment is expected to generate highest growth during the forecast period. This is attributed to the fact that claims processing services enables companies to seamlessly handle any volume of transactions. By efficiently balancing surges in processing requirements, claim processing service providers help healthcare practices to accelerate the time for processing claims. The time saved as a result of this can be better utilized to mitigate problems, improve cash flow, and concentrate on other core goals of an organization.

Region wise, North America generated highest revenue in 2020. This is attributed to the fact that North America has witnessed an increased rate of adoption of cloud-based solutions, owing to increase in digitization in insurance and e-commerce sectors, which drives growth prospects for the regional market significantly during the forecast period. Moreover, Asia-Pacific is attributed to grow significantly during the forecast period. This is attributed to growth in digitization and strong technological advancements in the region.
Claims Processing Software Market, Claims Processing Software Industry, Claims Processing Software Market Size, Claims Processing Software Market Share, Claims Processing Software Market Growth, Claims Processing Software Market Trends, Claims Processing Software Market Analysis, Claims Processing Software Market Forecast, Claims Processing Software Market Opportunity, Claims Processing Software Market Outlook

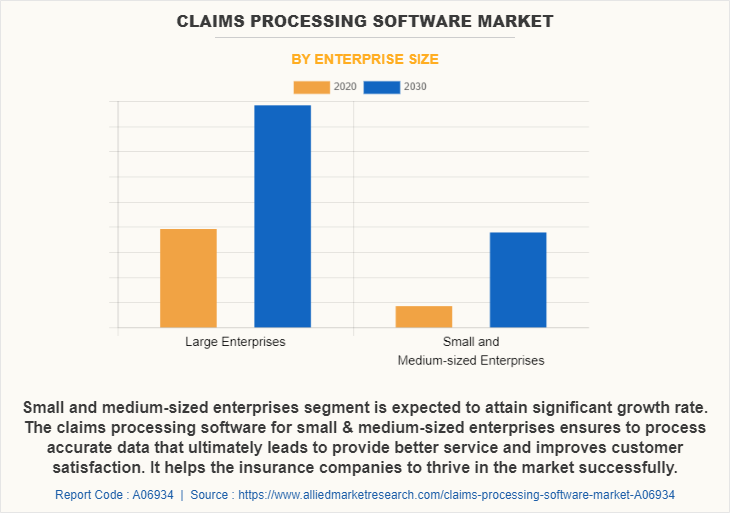
The claims processing software market is segmented on the basis of component, enterprise size, end user and region. By component, it is segmented into software and services. By enterprise size, it is bifurcated into large enterprises and small & medium enterprises. By end user, it is segregated into insurance companies, insurance intermediaries, agents & brokers, and others. By region, it is analyzed across North America, Europe, Asia-Pacific, and LAMEA.
Claims Processing Software Market

Large enterprises segment  acquired the major share of claims processing software market. Large enterprises intend to keep operating costs low in order to maximize profits. Business automation lowers the costs, and that’s one of the ways insurance companies use to gain a competitive advantage in the market.

Claims Processing Software Market
By Region

2030
Asia-pacific 
North America
Europe
LAMEA

Asia-Pacific is expected to exhibit significant growth during the forecast period. many financial institutions in Asia-Pacific are adopting claims processing software for boosting business efficiency, lowering compliance risk exposure, and increasing bureaucratic efficiency of the organization. Therefore, these are the major growth factors for the claims processing software market in the Asia-Pacific region.

Get more information on this report : Request Sample Pages

Asia-Pacific is expected to exhibit significant growth during the forecast period. many financial institutions in Asia-Pacific are adopting claims processing software for boosting business efficiency, lowering compliance risk exposure, and increasing bureaucratic efficiency of the organization. Therefore, these are the major growth factors for the claims automation software market in the Asia-Pacific region.

The report analyzes the profiles of key players operating in the claims processing software market analysis include A1 Enterprise, Duck Creek Technologies, FINEOS, Hyland Software, Inc., Hawksoft, Inc., HIPPAsuite, Newgen Software Technologies Limited, Pegasystems Inc., Quick Silver and VENTIV TECHNOLOGY. These players have adopted various strategies to increase their market penetration and strengthen their position in the claims processing software industry.

Covid-19 Impact Analysis

The COVID-19 pandemic has positively impacted the claims processing software market which is attributed to the fact that consumers of health insurance and general insurance demanded for claims settlement because of ongoing health issues and business losses. This sudden surge in the claim settlement became difficult to manage for the insurance companies and thus, the insurance companies started to adopt claims processing software which could easily handle large amounts of claims at one time. Furthermore, it made the process faster, thus saving time and effort of employees. This, as a result increased the demand for insurance claims management software market during the COVID-19 pandemic.

Top Impacting Factors

Claims Processing Software Increases Productivity

Claims management process can be complex and it is important for insurers to find ways to streamline this process to reduce costs and increase customer satisfaction. By using claims processing platforms, insurers can easily increase their productivity and cut costs. A better claims processing software allows insurers to handle every aspect of claims management within one system, allowing for easy access toward customer data and improved workflow. Everything from inputting claim to negotiating settlements can be done within claims processing software. This software allows to move away from manually filling out forms and managing Excel spreadsheets by eliminating the need for these manual methods altogether. Furthermore, it reduces errors, saves time, and increases accuracy, thus increasing productivity. Therefore, these are the major growth factors for the claims processing software market.

Higher Startup Cost of Implementing Claims Processing Software

One major obstacle to convert from traditional claims processing to claims processing software is the startup cost of purchasing necessary hardware and software. Other start-up costs include training of the entire staff to learn how to enter and use the software. Once the system is in place, the records of all customers must be converted to electronic format, which takes many man hours and is very expensive to complete. Furthermore, since claims processing software requires a computer system, there is a chance that private information may be accessed by unauthorized individuals. A hacked system may reveal parts or all customer information including addresses, birth date, social security numbers, emails, and possibly other sensitive financial information along with their complete history. Therefore, these are the major factors that limit growth of the claims processing software industry.

Key Benefits for Stakeholders

  • This report provides a quantitative analysis of the market segments, current trends, estimations, and dynamics of the claims processing software market share from 2020 to 2030 to identify the prevailing claims processing software market forecast.
  • Porter's five forces analysis highlights the potency of buyers and suppliers to enable stakeholders make profit-oriented business decisions and strengthen their supplier-buyer network.
  • In-depth analysis of the claims processing software market outlook segmentation assists to determine the prevailing market opportunities.
  • The report includes the analysis of the regional as well as global claims processing software market trends, key players, market segments, application areas, and market growth strategies.

Claims Processing Software Market Report Highlights

Aspects Details
By Component
  • Software
  • Services
By Enterprise Size
  • Large Enterprises
  • Small and Medium-sized Enterprises
By END USER
  • Insurance Companies
  • Insurance Intermediaries
  • Agents and Brokers
  • Others
By Region
  • North America 
  • Europe 
  • Asia-Pacific 
  • LAMEA 
Key Market Players Hawksoft, Inc., Newgen Software Technologies Limited, Pegasystems Inc., Hyland Software, Inc., Quick Silver, HIPPAsuite, FINEOS, Duck Creek Technologies, VENTIV TECHNOLOGY, a1 enterprise, inc.
 
  • CHAPTER 1:INTRODUCTION

    • 1.1.Report description

    • 1.2.Key market segments

    • 1.3.Key benefits to the stakeholders

    • 1.4.Research Methodology

      • 1.4.1.Secondary research

      • 1.4.2.Primary research

      • 1.4.3.Analyst tools and models

  • CHAPTER 2:EXECUTIVE SUMMARY

    • 2.1.Key findings of the study

    • 2.2.CXO Perspective

  • CHAPTER 3:MARKET OVERVIEW

    • 3.1.Market definition and scope

    • 3.2.Key findings

      • 3.2.1.Top investment pockets

    • 3.3.Porter’s five forces analysis

    • 3.4.Top player positioning

    • 3.5.Market dynamics

      • 3.5.1.Drivers

      • 3.5.2.Restraints

      • 3.5.3.Opportunities

    • 3.6.COVID-19 Impact Analysis on the market

    • 3.7.Key Regulation Analysis

  • CHAPTER 4: CLAIMS PROCESSING SOFTWARE MARKET, BY COMPONENT

    • 4.1 Overview

      • 4.1.1 Market size and forecast

    • 4.2 Software

      • 4.2.1 Key market trends, growth factors and opportunities

      • 4.2.2 Market size and forecast, by region

      • 4.2.3 Market analysis by country

    • 4.3 Services

      • 4.3.1 Key market trends, growth factors and opportunities

      • 4.3.2 Market size and forecast, by region

      • 4.3.3 Market analysis by country

  • CHAPTER 5: CLAIMS PROCESSING SOFTWARE MARKET, BY ENTERPRISE SIZE

    • 5.1 Overview

      • 5.1.1 Market size and forecast

    • 5.2 Large Enterprises

      • 5.2.1 Key market trends, growth factors and opportunities

      • 5.2.2 Market size and forecast, by region

      • 5.2.3 Market analysis by country

    • 5.3 Small and Medium-sized Enterprises

      • 5.3.1 Key market trends, growth factors and opportunities

      • 5.3.2 Market size and forecast, by region

      • 5.3.3 Market analysis by country

  • CHAPTER 6: CLAIMS PROCESSING SOFTWARE MARKET, BY BY END USER

    • 6.1 Overview

      • 6.1.1 Market size and forecast

    • 6.2 Insurance Companies

      • 6.2.1 Key market trends, growth factors and opportunities

      • 6.2.2 Market size and forecast, by region

      • 6.2.3 Market analysis by country

    • 6.3 Insurance Intermediaries

      • 6.3.1 Key market trends, growth factors and opportunities

      • 6.3.2 Market size and forecast, by region

      • 6.3.3 Market analysis by country

    • 6.4 Agents and Brokers

      • 6.4.1 Key market trends, growth factors and opportunities

      • 6.4.2 Market size and forecast, by region

      • 6.4.3 Market analysis by country

    • 6.5 Others

      • 6.5.1 Key market trends, growth factors and opportunities

      • 6.5.2 Market size and forecast, by region

      • 6.5.3 Market analysis by country

  • CHAPTER 7: CLAIMS PROCESSING SOFTWARE MARKET, BY REGION

    • 7.1 Overview

      • 7.1.1 Market size and forecast

    • 7.2 North America

      • 7.2.1 Key trends and opportunities

      • 7.2.2 North America Market size and forecast, by Component

      • 7.2.3 North America Market size and forecast, by Enterprise Size

      • 7.2.4 North America Market size and forecast, by By End User

      • 7.2.5 North America Market size and forecast, by country

        • 7.2.5.1 U.S.
          • 7.2.5.1.1 Market size and forecast, by Component
          • 7.2.5.1.2 Market size and forecast, by Enterprise Size
          • 7.2.5.1.3 Market size and forecast, by By End User
        • 7.2.5.2 Canada
          • 7.2.5.2.1 Market size and forecast, by Component
          • 7.2.5.2.2 Market size and forecast, by Enterprise Size
          • 7.2.5.2.3 Market size and forecast, by By End User
    • 7.3 Europe

      • 7.3.1 Key trends and opportunities

      • 7.3.2 Europe Market size and forecast, by Component

      • 7.3.3 Europe Market size and forecast, by Enterprise Size

      • 7.3.4 Europe Market size and forecast, by By End User

      • 7.3.5 Europe Market size and forecast, by country

        • 7.3.5.1 United Kingdom
          • 7.3.5.1.1 Market size and forecast, by Component
          • 7.3.5.1.2 Market size and forecast, by Enterprise Size
          • 7.3.5.1.3 Market size and forecast, by By End User
        • 7.3.5.2 Germany
          • 7.3.5.2.1 Market size and forecast, by Component
          • 7.3.5.2.2 Market size and forecast, by Enterprise Size
          • 7.3.5.2.3 Market size and forecast, by By End User
        • 7.3.5.3 France
          • 7.3.5.3.1 Market size and forecast, by Component
          • 7.3.5.3.2 Market size and forecast, by Enterprise Size
          • 7.3.5.3.3 Market size and forecast, by By End User
        • 7.3.5.4 Italy
          • 7.3.5.4.1 Market size and forecast, by Component
          • 7.3.5.4.2 Market size and forecast, by Enterprise Size
          • 7.3.5.4.3 Market size and forecast, by By End User
        • 7.3.5.5 Rest of Europe
          • 7.3.5.5.1 Market size and forecast, by Component
          • 7.3.5.5.2 Market size and forecast, by Enterprise Size
          • 7.3.5.5.3 Market size and forecast, by By End User
    • 7.4 Asia-Pacific

      • 7.4.1 Key trends and opportunities

      • 7.4.2 Asia-Pacific Market size and forecast, by Component

      • 7.4.3 Asia-Pacific Market size and forecast, by Enterprise Size

      • 7.4.4 Asia-Pacific Market size and forecast, by By End User

      • 7.4.5 Asia-Pacific Market size and forecast, by country

        • 7.4.5.1 China
          • 7.4.5.1.1 Market size and forecast, by Component
          • 7.4.5.1.2 Market size and forecast, by Enterprise Size
          • 7.4.5.1.3 Market size and forecast, by By End User
        • 7.4.5.2 Japan
          • 7.4.5.2.1 Market size and forecast, by Component
          • 7.4.5.2.2 Market size and forecast, by Enterprise Size
          • 7.4.5.2.3 Market size and forecast, by By End User
        • 7.4.5.3 India
          • 7.4.5.3.1 Market size and forecast, by Component
          • 7.4.5.3.2 Market size and forecast, by Enterprise Size
          • 7.4.5.3.3 Market size and forecast, by By End User
        • 7.4.5.4 South Korea
          • 7.4.5.4.1 Market size and forecast, by Component
          • 7.4.5.4.2 Market size and forecast, by Enterprise Size
          • 7.4.5.4.3 Market size and forecast, by By End User
        • 7.4.5.5 Rest Of Asia Pacific
          • 7.4.5.5.1 Market size and forecast, by Component
          • 7.4.5.5.2 Market size and forecast, by Enterprise Size
          • 7.4.5.5.3 Market size and forecast, by By End User
    • 7.5 LAMEA

      • 7.5.1 Key trends and opportunities

      • 7.5.2 LAMEA Market size and forecast, by Component

      • 7.5.3 LAMEA Market size and forecast, by Enterprise Size

      • 7.5.4 LAMEA Market size and forecast, by By End User

      • 7.5.5 LAMEA Market size and forecast, by country

        • 7.5.5.1 Latin America
          • 7.5.5.1.1 Market size and forecast, by Component
          • 7.5.5.1.2 Market size and forecast, by Enterprise Size
          • 7.5.5.1.3 Market size and forecast, by By End User
        • 7.5.5.2 Middle East
          • 7.5.5.2.1 Market size and forecast, by Component
          • 7.5.5.2.2 Market size and forecast, by Enterprise Size
          • 7.5.5.2.3 Market size and forecast, by By End User
        • 7.5.5.3 Africa
          • 7.5.5.3.1 Market size and forecast, by Component
          • 7.5.5.3.2 Market size and forecast, by Enterprise Size
          • 7.5.5.3.3 Market size and forecast, by By End User
  • CHAPTER 8: COMPANY LANDSCAPE

    • 8.1. Introduction

    • 8.2. Top winning strategies

    • 8.3. Product Mapping of Top 10 Player

    • 8.4. Competitive Dashboard

    • 8.5. Competitive Heatmap

    • 8.6. Key developments

  • CHAPTER 9: COMPANY PROFILES

    • 9.1 Duck Creek Technologies

      • 9.1.1 Company overview

      • 9.1.2 Company snapshot

      • 9.1.3 Operating business segments

      • 9.1.4 Product portfolio

      • 9.1.5 Business performance

      • 9.1.6 Key strategic moves and developments

    • 9.2 FINEOS

      • 9.2.1 Company overview

      • 9.2.2 Company snapshot

      • 9.2.3 Operating business segments

      • 9.2.4 Product portfolio

      • 9.2.5 Business performance

      • 9.2.6 Key strategic moves and developments

    • 9.3 Hyland Software, Inc.

      • 9.3.1 Company overview

      • 9.3.2 Company snapshot

      • 9.3.3 Operating business segments

      • 9.3.4 Product portfolio

      • 9.3.5 Business performance

      • 9.3.6 Key strategic moves and developments

    • 9.4 Hawksoft, Inc.

      • 9.4.1 Company overview

      • 9.4.2 Company snapshot

      • 9.4.3 Operating business segments

      • 9.4.4 Product portfolio

      • 9.4.5 Business performance

      • 9.4.6 Key strategic moves and developments

    • 9.5 HIPPAsuite

      • 9.5.1 Company overview

      • 9.5.2 Company snapshot

      • 9.5.3 Operating business segments

      • 9.5.4 Product portfolio

      • 9.5.5 Business performance

      • 9.5.6 Key strategic moves and developments

    • 9.6 Newgen Software Technologies Limited

      • 9.6.1 Company overview

      • 9.6.2 Company snapshot

      • 9.6.3 Operating business segments

      • 9.6.4 Product portfolio

      • 9.6.5 Business performance

      • 9.6.6 Key strategic moves and developments

    • 9.7 Pegasystems Inc.

      • 9.7.1 Company overview

      • 9.7.2 Company snapshot

      • 9.7.3 Operating business segments

      • 9.7.4 Product portfolio

      • 9.7.5 Business performance

      • 9.7.6 Key strategic moves and developments

    • 9.8 Quick Silver

      • 9.8.1 Company overview

      • 9.8.2 Company snapshot

      • 9.8.3 Operating business segments

      • 9.8.4 Product portfolio

      • 9.8.5 Business performance

      • 9.8.6 Key strategic moves and developments

    • 9.9 VENTIV TECHNOLOGY

      • 9.9.1 Company overview

      • 9.9.2 Company snapshot

      • 9.9.3 Operating business segments

      • 9.9.4 Product portfolio

      • 9.9.5 Business performance

      • 9.9.6 Key strategic moves and developments

    • 9.10 a1 enterprise, inc.

      • 9.10.1 Company overview

      • 9.10.2 Company snapshot

      • 9.10.3 Operating business segments

      • 9.10.4 Product portfolio

      • 9.10.5 Business performance

      • 9.10.6 Key strategic moves and developments

  • LIST OF TABLES

  • TABLE 1. GLOBAL CLAIMS PROCESSING SOFTWARE MARKET, BY COMPONENT, 2020-2030,($MILLION)
    TABLE 2. CLAIMS PROCESSING SOFTWARE MARKET REVENUE, FOR SOFTWARE, BY REGION , 2020-2030,($MILLION)
    TABLE 3. CLAIMS PROCESSING SOFTWARE MARKET FOR SOFTWARE BY COUNTRY, 2020-2030,($MILLION)
    TABLE 4. CLAIMS PROCESSING SOFTWARE MARKET REVENUE, FOR SERVICES, BY REGION , 2020-2030,($MILLION)
    TABLE 5. CLAIMS PROCESSING SOFTWARE MARKET FOR SERVICES BY COUNTRY, 2020-2030,($MILLION)
    TABLE 6. GLOBAL CLAIMS PROCESSING SOFTWARE MARKET, BY ENTERPRISE SIZE, 2020-2030,($MILLION)
    TABLE 7. CLAIMS PROCESSING SOFTWARE MARKET REVENUE, FOR LARGE ENTERPRISES, BY REGION , 2020-2030,($MILLION)
    TABLE 8. CLAIMS PROCESSING SOFTWARE MARKET FOR LARGE ENTERPRISES BY COUNTRY, 2020-2030,($MILLION)
    TABLE 9. CLAIMS PROCESSING SOFTWARE MARKET REVENUE, FOR SMALL AND MEDIUM-SIZED ENTERPRISES, BY REGION , 2020-2030,($MILLION)
    TABLE 10. CLAIMS PROCESSING SOFTWARE MARKET FOR SMALL AND MEDIUM-SIZED ENTERPRISES BY COUNTRY, 2020-2030,($MILLION)
    TABLE 11. GLOBAL CLAIMS PROCESSING SOFTWARE MARKET, BY BY END USER, 2020-2030,($MILLION)
    TABLE 12. CLAIMS PROCESSING SOFTWARE MARKET REVENUE, FOR INSURANCE COMPANIES, BY REGION , 2020-2030,($MILLION)
    TABLE 13. CLAIMS PROCESSING SOFTWARE MARKET FOR INSURANCE COMPANIES BY COUNTRY, 2020-2030,($MILLION)
    TABLE 14. CLAIMS PROCESSING SOFTWARE MARKET REVENUE, FOR INSURANCE INTERMEDIARIES, BY REGION , 2020-2030,($MILLION)
    TABLE 15. CLAIMS PROCESSING SOFTWARE MARKET FOR INSURANCE INTERMEDIARIES BY COUNTRY, 2020-2030,($MILLION)
    TABLE 16. CLAIMS PROCESSING SOFTWARE MARKET REVENUE, FOR AGENTS AND BROKERS, BY REGION , 2020-2030,($MILLION)
    TABLE 17. CLAIMS PROCESSING SOFTWARE MARKET FOR AGENTS AND BROKERS BY COUNTRY, 2020-2030,($MILLION)
    TABLE 18. CLAIMS PROCESSING SOFTWARE MARKET REVENUE, FOR OTHERS, BY REGION , 2020-2030,($MILLION)
    TABLE 19. CLAIMS PROCESSING SOFTWARE MARKET FOR OTHERS BY COUNTRY, 2020-2030,($MILLION)
    TABLE 20. CLAIMS PROCESSING SOFTWARE MARKET, BY REGION, 2020-2030,($MILLION)
    TABLE 21. NORTH AMERICA CLAIMS PROCESSING SOFTWARE MARKET, BY COMPONENT, 2020-2030,($MILLION)
    TABLE 22. NORTH AMERICA CLAIMS PROCESSING SOFTWARE MARKET, BY ENTERPRISE SIZE, 2020-2030,($MILLION)
    TABLE 23. NORTH AMERICA CLAIMS PROCESSING SOFTWARE MARKET, BY BY END USER, 2020-2030,($MILLION)
    TABLE 24. NORTH AMERICA CLAIMS PROCESSING SOFTWARE MARKET, BY COUNTRY, 2020-2030,($MILLION)
    TABLE 25. U.S. CLAIMS PROCESSING SOFTWARE MARKET, BY COMPONENT, 2020-2030,($MILLION)
    TABLE 26. U.S. CLAIMS PROCESSING SOFTWARE MARKET, BY ENTERPRISE SIZE, 2020-2030,($MILLION)
    TABLE 27. U.S. CLAIMS PROCESSING SOFTWARE MARKET, BY BY END USER, 2020-2030,($MILLION)
    TABLE 28. CANADA CLAIMS PROCESSING SOFTWARE MARKET, BY COMPONENT, 2020-2030,($MILLION)
    TABLE 29. CANADA CLAIMS PROCESSING SOFTWARE MARKET, BY ENTERPRISE SIZE, 2020-2030,($MILLION)
    TABLE 30. CANADA CLAIMS PROCESSING SOFTWARE MARKET, BY BY END USER, 2020-2030,($MILLION)
    TABLE 31. EUROPE CLAIMS PROCESSING SOFTWARE MARKET, BY COMPONENT, 2020-2030,($MILLION)
    TABLE 32. EUROPE CLAIMS PROCESSING SOFTWARE MARKET, BY ENTERPRISE SIZE, 2020-2030,($MILLION)
    TABLE 33. EUROPE CLAIMS PROCESSING SOFTWARE MARKET, BY BY END USER, 2020-2030,($MILLION)
    TABLE 34. EUROPE CLAIMS PROCESSING SOFTWARE MARKET, BY COUNTRY, 2020-2030,($MILLION)
    TABLE 35. UNITED KINGDOM CLAIMS PROCESSING SOFTWARE MARKET, BY COMPONENT, 2020-2030,($MILLION)
    TABLE 36. UNITED KINGDOM CLAIMS PROCESSING SOFTWARE MARKET, BY ENTERPRISE SIZE, 2020-2030,($MILLION)
    TABLE 37. UNITED KINGDOM CLAIMS PROCESSING SOFTWARE MARKET, BY BY END USER, 2020-2030,($MILLION)
    TABLE 38. GERMANY CLAIMS PROCESSING SOFTWARE MARKET, BY COMPONENT, 2020-2030,($MILLION)
    TABLE 39. GERMANY CLAIMS PROCESSING SOFTWARE MARKET, BY ENTERPRISE SIZE, 2020-2030,($MILLION)
    TABLE 40. GERMANY CLAIMS PROCESSING SOFTWARE MARKET, BY BY END USER, 2020-2030,($MILLION)
    TABLE 41. FRANCE CLAIMS PROCESSING SOFTWARE MARKET, BY COMPONENT, 2020-2030,($MILLION)
    TABLE 42. FRANCE CLAIMS PROCESSING SOFTWARE MARKET, BY ENTERPRISE SIZE, 2020-2030,($MILLION)
    TABLE 43. FRANCE CLAIMS PROCESSING SOFTWARE MARKET, BY BY END USER, 2020-2030,($MILLION)
    TABLE 44. ITALY CLAIMS PROCESSING SOFTWARE MARKET, BY COMPONENT, 2020-2030,($MILLION)
    TABLE 45. ITALY CLAIMS PROCESSING SOFTWARE MARKET, BY ENTERPRISE SIZE, 2020-2030,($MILLION)
    TABLE 46. ITALY CLAIMS PROCESSING SOFTWARE MARKET, BY BY END USER, 2020-2030,($MILLION)
    TABLE 47. REST OF EUROPE CLAIMS PROCESSING SOFTWARE MARKET, BY COMPONENT, 2020-2030,($MILLION)
    TABLE 48. REST OF EUROPE CLAIMS PROCESSING SOFTWARE MARKET, BY ENTERPRISE SIZE, 2020-2030,($MILLION)
    TABLE 49. REST OF EUROPE CLAIMS PROCESSING SOFTWARE MARKET, BY BY END USER, 2020-2030,($MILLION)
    TABLE 50. ASIA-PACIFIC CLAIMS PROCESSING SOFTWARE MARKET, BY COMPONENT, 2020-2030,($MILLION)
    TABLE 51. ASIA-PACIFIC CLAIMS PROCESSING SOFTWARE MARKET, BY ENTERPRISE SIZE, 2020-2030,($MILLION)
    TABLE 52. ASIA-PACIFIC CLAIMS PROCESSING SOFTWARE MARKET, BY BY END USER, 2020-2030,($MILLION)
    TABLE 53. ASIA-PACIFIC CLAIMS PROCESSING SOFTWARE MARKET, BY COUNTRY, 2020-2030,($MILLION)
    TABLE 54. CHINA CLAIMS PROCESSING SOFTWARE MARKET, BY COMPONENT, 2020-2030,($MILLION)
    TABLE 55. CHINA CLAIMS PROCESSING SOFTWARE MARKET, BY ENTERPRISE SIZE, 2020-2030,($MILLION)
    TABLE 56. CHINA CLAIMS PROCESSING SOFTWARE MARKET, BY BY END USER, 2020-2030,($MILLION)
    TABLE 57. JAPAN CLAIMS PROCESSING SOFTWARE MARKET, BY COMPONENT, 2020-2030,($MILLION)
    TABLE 58. JAPAN CLAIMS PROCESSING SOFTWARE MARKET, BY ENTERPRISE SIZE, 2020-2030,($MILLION)
    TABLE 59. JAPAN CLAIMS PROCESSING SOFTWARE MARKET, BY BY END USER, 2020-2030,($MILLION)
    TABLE 60. INDIA CLAIMS PROCESSING SOFTWARE MARKET, BY COMPONENT, 2020-2030,($MILLION)
    TABLE 61. INDIA CLAIMS PROCESSING SOFTWARE MARKET, BY ENTERPRISE SIZE, 2020-2030,($MILLION)
    TABLE 62. INDIA CLAIMS PROCESSING SOFTWARE MARKET, BY BY END USER, 2020-2030,($MILLION)
    TABLE 63. SOUTH KOREA CLAIMS PROCESSING SOFTWARE MARKET, BY COMPONENT, 2020-2030,($MILLION)
    TABLE 64. SOUTH KOREA CLAIMS PROCESSING SOFTWARE MARKET, BY ENTERPRISE SIZE, 2020-2030,($MILLION)
    TABLE 65. SOUTH KOREA CLAIMS PROCESSING SOFTWARE MARKET, BY BY END USER, 2020-2030,($MILLION)
    TABLE 66. REST OF ASIA PACIFIC CLAIMS PROCESSING SOFTWARE MARKET, BY COMPONENT, 2020-2030,($MILLION)
    TABLE 67. REST OF ASIA PACIFIC CLAIMS PROCESSING SOFTWARE MARKET, BY ENTERPRISE SIZE, 2020-2030,($MILLION)
    TABLE 68. REST OF ASIA PACIFIC CLAIMS PROCESSING SOFTWARE MARKET, BY BY END USER, 2020-2030,($MILLION)
    TABLE 69. LAMEA CLAIMS PROCESSING SOFTWARE MARKET, BY COMPONENT, 2020-2030,($MILLION)
    TABLE 70. LAMEA CLAIMS PROCESSING SOFTWARE MARKET, BY ENTERPRISE SIZE, 2020-2030,($MILLION)
    TABLE 71. LAMEA CLAIMS PROCESSING SOFTWARE MARKET, BY BY END USER, 2020-2030,($MILLION)
    TABLE 72. LAMEA CLAIMS PROCESSING SOFTWARE MARKET, BY COUNTRY, 2020-2030,($MILLION)
    TABLE 73. LATIN AMERICA CLAIMS PROCESSING SOFTWARE MARKET, BY COMPONENT, 2020-2030,($MILLION)
    TABLE 74. LATIN AMERICA CLAIMS PROCESSING SOFTWARE MARKET, BY ENTERPRISE SIZE, 2020-2030,($MILLION)
    TABLE 75. LATIN AMERICA CLAIMS PROCESSING SOFTWARE MARKET, BY BY END USER, 2020-2030,($MILLION)
    TABLE 76. MIDDLE EAST CLAIMS PROCESSING SOFTWARE MARKET, BY COMPONENT, 2020-2030,($MILLION)
    TABLE 77. MIDDLE EAST CLAIMS PROCESSING SOFTWARE MARKET, BY ENTERPRISE SIZE, 2020-2030,($MILLION)
    TABLE 78. MIDDLE EAST CLAIMS PROCESSING SOFTWARE MARKET, BY BY END USER, 2020-2030,($MILLION)
    TABLE 79. AFRICA CLAIMS PROCESSING SOFTWARE MARKET, BY COMPONENT, 2020-2030,($MILLION)
    TABLE 80. AFRICA CLAIMS PROCESSING SOFTWARE MARKET, BY ENTERPRISE SIZE, 2020-2030,($MILLION)
    TABLE 81. AFRICA CLAIMS PROCESSING SOFTWARE MARKET, BY BY END USER, 2020-2030,($MILLION)
    TABLE 82.DUCK CREEK TECHNOLOGIES: COMPANY SNAPSHOT
    TABLE 83.DUCK CREEK TECHNOLOGIES: OPERATING SEGMENTS
    TABLE 84.DUCK CREEK TECHNOLOGIES: PRODUCT PORTFOLIO
    TABLE 85.DUCK CREEK TECHNOLOGIES: NET SALES,
    TABLE 86.DUCK CREEK TECHNOLOGIES: KEY STRATERGIES
    TABLE 87.FINEOS: COMPANY SNAPSHOT
    TABLE 88.FINEOS: OPERATING SEGMENTS
    TABLE 89.FINEOS: PRODUCT PORTFOLIO
    TABLE 90.FINEOS: NET SALES,
    TABLE 91.FINEOS: KEY STRATERGIES
    TABLE 92.HYLAND SOFTWARE, INC.: COMPANY SNAPSHOT
    TABLE 93.HYLAND SOFTWARE, INC.: OPERATING SEGMENTS
    TABLE 94.HYLAND SOFTWARE, INC.: PRODUCT PORTFOLIO
    TABLE 95.HYLAND SOFTWARE, INC.: NET SALES,
    TABLE 96.HYLAND SOFTWARE, INC.: KEY STRATERGIES
    TABLE 97.HAWKSOFT, INC.: COMPANY SNAPSHOT
    TABLE 98.HAWKSOFT, INC.: OPERATING SEGMENTS
    TABLE 99.HAWKSOFT, INC.: PRODUCT PORTFOLIO
    TABLE 100.HAWKSOFT, INC.: NET SALES,
    TABLE 101.HAWKSOFT, INC.: KEY STRATERGIES
    TABLE 102.HIPPASUITE: COMPANY SNAPSHOT
    TABLE 103.HIPPASUITE: OPERATING SEGMENTS
    TABLE 104.HIPPASUITE: PRODUCT PORTFOLIO
    TABLE 105.HIPPASUITE: NET SALES,
    TABLE 106.HIPPASUITE: KEY STRATERGIES
    TABLE 107.NEWGEN SOFTWARE TECHNOLOGIES LIMITED: COMPANY SNAPSHOT
    TABLE 108.NEWGEN SOFTWARE TECHNOLOGIES LIMITED: OPERATING SEGMENTS
    TABLE 109.NEWGEN SOFTWARE TECHNOLOGIES LIMITED: PRODUCT PORTFOLIO
    TABLE 110.NEWGEN SOFTWARE TECHNOLOGIES LIMITED: NET SALES,
    TABLE 111.NEWGEN SOFTWARE TECHNOLOGIES LIMITED: KEY STRATERGIES
    TABLE 112.PEGASYSTEMS INC.: COMPANY SNAPSHOT
    TABLE 113.PEGASYSTEMS INC.: OPERATING SEGMENTS
    TABLE 114.PEGASYSTEMS INC.: PRODUCT PORTFOLIO
    TABLE 115.PEGASYSTEMS INC.: NET SALES,
    TABLE 116.PEGASYSTEMS INC.: KEY STRATERGIES
    TABLE 117.QUICK SILVER: COMPANY SNAPSHOT
    TABLE 118.QUICK SILVER: OPERATING SEGMENTS
    TABLE 119.QUICK SILVER: PRODUCT PORTFOLIO
    TABLE 120.QUICK SILVER: NET SALES,
    TABLE 121.QUICK SILVER: KEY STRATERGIES
    TABLE 122.VENTIV TECHNOLOGY: COMPANY SNAPSHOT
    TABLE 123.VENTIV TECHNOLOGY: OPERATING SEGMENTS
    TABLE 124.VENTIV TECHNOLOGY: PRODUCT PORTFOLIO
    TABLE 125.VENTIV TECHNOLOGY: NET SALES,
    TABLE 126.VENTIV TECHNOLOGY: KEY STRATERGIES
    TABLE 127.A1 ENTERPRISE, INC.: COMPANY SNAPSHOT
    TABLE 128.A1 ENTERPRISE, INC.: OPERATING SEGMENTS
    TABLE 129.A1 ENTERPRISE, INC.: PRODUCT PORTFOLIO
    TABLE 130.A1 ENTERPRISE, INC.: NET SALES,
    TABLE 131.A1 ENTERPRISE, INC.: KEY STRATERGIES
  • LIST OF FIGURES

  • FIGURE 1.CLAIMS PROCESSING SOFTWARE MARKET SEGMENTATION
    FIGURE 2.CLAIMS PROCESSING SOFTWARE MARKET,2020-2030
    FIGURE 3.CLAIMS PROCESSING SOFTWARE MARKET,2020-2030
    FIGURE 4. TOP INVESTMENT POCKETS, BY REGION
    FIGURE 5.PORTER FIVE-1
    FIGURE 6.PORTER FIVE-2
    FIGURE 7.PORTER FIVE-3
    FIGURE 8.PORTER FIVE-4
    FIGURE 9.PORTER FIVE-5
    FIGURE 10.TOP PLAYER POSITIONING
    FIGURE 11.CLAIMS PROCESSING SOFTWARE MARKET:DRIVERS, RESTRAINTS AND OPPORTUNITIES
    FIGURE 12.KEY REGULATION ANALYSIS
    FIGURE 13.CLAIMS PROCESSING SOFTWARE MARKET,BY COMPONENT,2020(%)
    FIGURE 14.COMPARATIVE SHARE ANALYSIS OF SOFTWARE CLAIMS PROCESSING SOFTWARE MARKET,2020-2030(%)
    FIGURE 15.COMPARATIVE SHARE ANALYSIS OF SERVICES CLAIMS PROCESSING SOFTWARE MARKET,2020-2030(%)
    FIGURE 16.CLAIMS PROCESSING SOFTWARE MARKET,BY ENTERPRISE SIZE,2020(%)
    FIGURE 17.COMPARATIVE SHARE ANALYSIS OF LARGE ENTERPRISES CLAIMS PROCESSING SOFTWARE MARKET,2020-2030(%)
    FIGURE 18.COMPARATIVE SHARE ANALYSIS OF SMALL AND MEDIUM-SIZED ENTERPRISES CLAIMS PROCESSING SOFTWARE MARKET,2020-2030(%)
    FIGURE 19.CLAIMS PROCESSING SOFTWARE MARKET,BY BY END USER,2020(%)
    FIGURE 20.COMPARATIVE SHARE ANALYSIS OF INSURANCE COMPANIES CLAIMS PROCESSING SOFTWARE MARKET,2020-2030(%)
    FIGURE 21.COMPARATIVE SHARE ANALYSIS OF INSURANCE INTERMEDIARIES CLAIMS PROCESSING SOFTWARE MARKET,2020-2030(%)
    FIGURE 22.COMPARATIVE SHARE ANALYSIS OF AGENTS AND BROKERS CLAIMS PROCESSING SOFTWARE MARKET,2020-2030(%)
    FIGURE 23.COMPARATIVE SHARE ANALYSIS OF OTHERS CLAIMS PROCESSING SOFTWARE MARKET,2020-2030(%)
    FIGURE 24.CLAIMS PROCESSING SOFTWARE MARKET BY REGION,2020
    FIGURE 25.U.S. CLAIMS PROCESSING SOFTWARE MARKET,2020-2030($MILLION)
    FIGURE 26.CANADA CLAIMS PROCESSING SOFTWARE MARKET,2020-2030($MILLION)
    FIGURE 27.UNITED KINGDOM CLAIMS PROCESSING SOFTWARE MARKET,2020-2030($MILLION)
    FIGURE 28.GERMANY CLAIMS PROCESSING SOFTWARE MARKET,2020-2030($MILLION)
    FIGURE 29.FRANCE CLAIMS PROCESSING SOFTWARE MARKET,2020-2030($MILLION)
    FIGURE 30.ITALY CLAIMS PROCESSING SOFTWARE MARKET,2020-2030($MILLION)
    FIGURE 31.REST OF EUROPE CLAIMS PROCESSING SOFTWARE MARKET,2020-2030($MILLION)
    FIGURE 32.CHINA CLAIMS PROCESSING SOFTWARE MARKET,2020-2030($MILLION)
    FIGURE 33.JAPAN CLAIMS PROCESSING SOFTWARE MARKET,2020-2030($MILLION)
    FIGURE 34.INDIA CLAIMS PROCESSING SOFTWARE MARKET,2020-2030($MILLION)
    FIGURE 35.SOUTH KOREA CLAIMS PROCESSING SOFTWARE MARKET,2020-2030($MILLION)
    FIGURE 36.REST OF ASIA PACIFIC CLAIMS PROCESSING SOFTWARE MARKET,2020-2030($MILLION)
    FIGURE 37.LATIN AMERICA CLAIMS PROCESSING SOFTWARE MARKET,2020-2030($MILLION)
    FIGURE 38.MIDDLE EAST CLAIMS PROCESSING SOFTWARE MARKET,2020-2030($MILLION)
    FIGURE 39.AFRICA CLAIMS PROCESSING SOFTWARE MARKET,2020-2030($MILLION)
    FIGURE 40. TOP WINNING STRATEGIES, BY YEAR
    FIGURE 41. TOP WINNING STRATEGIES, BY DEVELOPMENT
    FIGURE 42. TOP WINNING STRATEGIES, BY COMPANY
    FIGURE 43.PRODUCT MAPPING OF TOP 10 PLAYERS
    FIGURE 44.COMPETITIVE DASHBOARD
    FIGURE 45.COMPETITIVE HEATMAP OF TOP 10 KEY PLAYERS
    FIGURE 46.DUCK CREEK TECHNOLOGIES.: NET SALES ,($MILLION)
    FIGURE 47.FINEOS.: NET SALES ,($MILLION)
    FIGURE 48.HYLAND SOFTWARE, INC..: NET SALES ,($MILLION)
    FIGURE 49.HAWKSOFT, INC..: NET SALES ,($MILLION)
    FIGURE 50.HIPPASUITE.: NET SALES ,($MILLION)
    FIGURE 51.NEWGEN SOFTWARE TECHNOLOGIES LIMITED.: NET SALES ,($MILLION)
    FIGURE 52.PEGASYSTEMS INC..: NET SALES ,($MILLION)
    FIGURE 53.QUICK SILVER.: NET SALES ,($MILLION)
    FIGURE 54.VENTIV TECHNOLOGY.: NET SALES ,($MILLION)
    FIGURE 55.A1 ENTERPRISE, INC..: NET SALES ,($MILLION)


Claims processing is an important business function for insurance companies, public entities, and risk managers. The claims have to be handled timely to ensure quick settlement leading to customer satisfaction. Claims processing software is beneficial as it helps to effectively manage and analyze information pertaining to claims. Claims processing software helps to automate entire system of claims management by reducing settlement time and enhancing customer service. It provides faster and intuitive access to claims data records, which help in making effective decisions. Moreover, claim processing software can help insurance companies and risk managers to reduce exposure, increase employee productivity, reduce claim processing cycle time, and provide better customer service. Moreover, it helps enhance quality of service, which gives a competitive edge over other companies.

Furthermore, market players in the claims processing software market are adopting key strategies such as partnership and product launch to further enhance their offerings and improve customer service. For instance, Whatfix, global leader in the digital adoption platforms (DAP) space, announced a new partnership with Duck Creek Technologies, a leader in property and casualty (P&C) insurance software-as-a-service (SaaS) solutions. The partnership aims to enhance user experience claims handlers of for insurance carriers using Duck Creek Claims, while accelerating claims processing time and saving compliance costs. Whatfix's Digital Adoption Platform (DAP) integrates seamlessly with Duck Creek Claims to provide contextual information within the platform, enabling users to navigate claims processes without leaving the application. Adjusters get access to claims-specific solutions, including ready-to-use templates on state-specific help tips & smart nudges. This saves time, reduces costs, increases productivity, and in effect, provides a better customer experience. Low-code authoring environment and ability to merge existing knowledge repositories improves operational efficiency of learning and development teams. Therefore, these factors provide major lucrative opportunities for growth of the global claims processing software market.

Some of the key players profiled in the report include A1 Enterprise, Duck Creek Technologies, FINEOS, Hyland Software, Inc., Hawksoft, Inc., HIPPAsuite, Newgen Software Technologies Limited, Pegasystems Inc., Quick Silver, and VENTIV TECHNOLOGY. These players have adopted various strategies to increase their market penetration and strengthen their position in the industry.

PURCHASE OPTIONS

Call or Email us

U.S.-Canada Toll-free: +1-800-792-5285
Int'l : +1-503-894-6022
Europe : +44-845-528-1300
Email : help@alliedmarketresearch.com
 
FREQUENTLY ASKED QUESTIONS?

A. Market players in the claims processing software market are adopting key strategies such as partnership and product launch to further enhance their offerings and improve customer service, which is becoming major trends in the market.

A. Insurance companies segment accounted for the highest revenue in claims procesing software market. Insurance claims management software helps insurance companies to manage and evaluate insurance claims. They allow insurance companies to manage the claims process with automated workflows, ensuring that all claim details are recorded within a centralized system.

A. North America accounted for the major share of claims procesing software market. Most insurance companies in the U.S. are adopting digital services to handle claims of the customers. Therefore, the claims processing software is increasingly used by companies to serve their customers. Moreover, health insurance claims are increasing in the U.S. and therefore, customers demand a robust claims settlement procedure.

A. The global claims processing software market size was valued at $33,894.3 million in 2020, and is projected to reach $73,046.1 million by 2030, registering a CAGR of 8.3% from 2021 to 2030.

A. Leading market players such A1 Enterprise, HIPPAsuite, Pegasystems Inc., and Duck Creek Technologies hold majority of the market share. However, other players in the market are also coming up with new strategies and partnering, collaborating, and expanding their business, which is further anticipated to boost the market growth in the future.

Looking for Customization?

 Customization Request

Have a Question?

 Speak with Analyst

Any Confusion?

 Inquire Before Buying

Have a glance of the Report

  Request Sample
RELATED TAGS

Purchase Full Report of
Claims Processing Software Market

Start reading instantly.
This Report and over 66,944+ more Reports, Available with Avenue Library. T&C*.

  • Online Only
  • $3,456
  • Online cloud access only
  • Restricted print, copy, paste & download
  • Read only
  • Free industry update
    (Within 180 days)
  • Free report update in next update cycle
    (May 2023 - May 2024)
  • Data Pack
  • $3,840
  • Restricted to one authorized user
  • One print only
  • Available in
    Excel
  • Free industry update
    (Within 180 days)
  •   Free report update in next update cycle
    (May 2023 - May 2024)
  • Single User
  • $5,769
  • Restricted to one authorized user
  • One print only
  • Available in
    PDF
  • Free industry update
    (Within 180 days)
  •   Free report update in next update cycle
    (May 2023 - May 2024)
  • Five Users
  • $6,450
  • Limited to five authorized users
  • Print upto five copies
  • Available in
    PDF
  • Free industry update
    (Within 180 days)
  •   Free report update in next update cycle
    (May 2023 - May 2024)
  • Enterprise
    License/PDF

  • $10,995
  • Unlimited
    within
    company/enterprise
  • Available in Excel & PDF
  • Free industry update
    (Within 180 days)
  •   Free report update in next update cycle
    (May 2023 - May 2024)
  • Library
    Membership

  • $999 $ 1,175
    Per User/ Per month/ Billed annually
  • Published Content
    E-access
  • Company Profiles
    E-access
  • Newly Added Content Access
  • 10 PDF
    Downloads
  • 5 Excel Data
    Pack Downloads
  • 250 Company Profiles PDF Downloads
  • Buy Now

*Taxes/Fees, if applicable will be added during checkout. All prices in USD

RELATED REPORTS
 

Why Allied Market Research?


Infallible Methodology

To ensure high-level data integrity, accurate analysis, and impeccable forecasts

Analyst Support

For complete satisfaction

Customization

On-demand customization of scope of the report to exactly meet your needs

TARGETED MARKET VIEW

Targeted market view to provide pertinent information and save time of readers

Get fresh content delivered

Get insights on topics that are crucial for your business. Stay abreast of your interest areas.

Get Industry Data Alerts

Why Allied Market Research?

Infallible Methodology

To ensure high-level data integrity, accurate analysis, and impeccable forecasts

Analyst Support

For complete satisfaction

Customization

On-demand customization of scope of the report to exactly meet your needs

TARGETED MARKET VIEW

Targeted market view to provide pertinent information and save time of readers