
Cleaning Chemicals Market Research, 2033
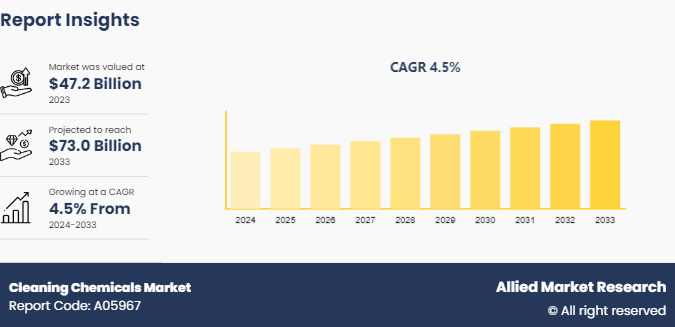
The global cleaning chemicals market was valued at $47.2 billion in 2023, and is projected to reach $73.0 billion by 2033, growing at a CAGR of 4.5% from 2024 to 2033.
Market Introduction and Definition
Cleaning chemicals are substances used to remove dirt, stains, bad smells, and clutter from surfaces. These chemicals are formulated with active ingredients that break down and eliminate contaminants, making surfaces hygienic and aesthetically pleasing. They play a crucial role in maintaining cleanliness and hygiene in various environments, ranging from homes and workplaces to industrial settings. Cleaning chemicals can be broadly classified into several categories, including detergents, disinfectants, degreasers, and specialty cleaners, each designed for specific applications.
In household settings, cleaning chemicals are essential for maintaining a clean and healthy living environment. Common household cleaners include all-purpose cleaners, which are versatile and can be used on multiple surfaces such as countertops, floors, and walls. Disinfectants, such as bleach and alcohol-based solutions, are vital for sanitizing kitchens and bathrooms, eliminating bacteria and viruses that can cause illness. Glass cleaners, typically containing ammonia, are used to keep windows and mirrors streak-free. Additionally, specialized products like oven cleaners and toilet bowl cleaners address more challenging cleaning tasks.
Industrial and commercial cleaning demands robust and effective cleaning chemicals due to the scale and nature of dirt and contaminants present. In these settings, degreasers are commonly used to remove heavy grease and oil from machinery and equipment. Solvent-based cleaners are utilized in manufacturing processes to clean parts and surfaces. Disinfectants and sanitizers are essential in healthcare facilities, food processing plants, and hospitality industries to ensure a sterile environment and prevent the spread of pathogens. Floor care products, including strippers, sealers, and polishes, are crucial for maintaining large floor areas in commercial buildings.
Key Takeaways
- The cleaning chemicals industry covers 20 countries. The research includes a segment analysis of each country in terms of value for the projected period.
- The study integrated high-quality data, professional opinions and analysis, and critical independent perspectives. The research approach is intended to provide a balanced view of the global cleaning chemicals market overview and to assist stakeholders in making educated decisions to achieve their growth objectives.
- Over 1,700 product literature, annual reports, industry statements, and other comparable materials from major industry participants were reviewed to gain a better understanding of the cleaning chemicals market size.
- The cleaning chemicals market share is highly fragmented, with several players including CLARIANT, BASF SE, Dow, DuPont, Ecolab, Evonik, Pilot Chemical Corp, Unilever Professional India, Reckitt Benckiser Group PLC, and The Clorox Company. Also tracked key strategies such as acquisitions, product launches, mergers, and expansion of the players operating in the cleaning chemicals market growth.
Market Segmentation
The cleaning chemicals market is segmented into ingredient type, product type, application, and region. On the basis of ingredient type, the market is divided into surfactants, solvent, PH regulators, chelating agents, and others. On the basis of product type, the market is classified into general purpose cleaners, sanitizers and disinfectants, metal cleaners, laundry cleaning, and others. By application, the market is categorized into manufacturing and commercial offices, retail and foodservice, medical, automotive, and others. Region-wise, it is analyzed across North America, Europe, Asia-Pacific, and LAMEA.
Key Market Dynamics
Increase in demand for healthcare sector is expected to driver the growth of cleaning chemicals market. Hospitals, clinics, and other healthcare facilities have stringent cleanliness protocols to prevent infections and maintain a sterile environment. In healthcare settings, the risk of healthcare-associated infections (HAIs) necessitates the use of high-quality cleaning chemicals. These infections can have severe consequences, including prolonged hospital stays, increased medical costs, and higher mortality rates. To mitigate these risks, healthcare facilities invest significantly in effective cleaning solutions. The demand for products such as surface disinfectants, hand sanitizers, and surgical instrument cleaners has surged, reflecting the critical role these chemicals play in maintaining hygiene.
Moreover, the expansion of healthcare infrastructure in emerging economies contributes to the rising demand for cleaning chemicals. Governments and private sectors in these regions are increasingly investing in healthcare facilities, aiming to improve healthcare accessibility and quality. This growth is coupled with a heightened focus on infection control and hygiene standards, further driving the need for cleaning chemicals. In 2021, U.S. healthcare spending reached $4.3 trillion, averaging approximately $12, 900 per person. This marks an increase of nearly 3.0 percent compared to the previous year. Both public and private sector healthcare expenditures rose during this period. Specifically, spending through private health insurance increased by 5.8 percent, amounting to $1.2 trillion of the total. This growth was primarily driven by higher expenditures on medical goods and services, including cleaning chemicals.

However, high costs of eco-friendly cleaning chemicals products is expected to restrain the growth of the cleaning chemicals market during the forecast period. The raw materials used in sustainable cleaning solutions are often more expensive. Eco-friendly products typically use plant-based or biodegradable ingredients, which can be costlier to source and process than synthetic chemicals. For instance, natural surfactants derived from renewable resources such as coconut oil or corn can be significantly more expensive than petrochemical-based surfactants. the production processes for eco-friendly products tend to be more complex and costly. These products often require specialized manufacturing techniques to ensure that they meet environmental standards and perform effectively without harmful chemicals. This can involve additional investments in research and development (R&D) , quality control, and certification processes. Certifications such as EcoLogo, Green Seal, or USDA Organic add to the cost but are necessary to validate the eco-friendliness of the products.
Furthermore, integration of cleaning chemicals with smart technologies and IoT devices is expected to provide lucrative opportunities in the market. The integration of cleaning chemicals with smart technologies and IoT (Internet of Things) devices represents a significant advancement in the cleaning industry, offering innovative solutions that enhance efficiency, effectiveness, and user convenience. This development is particularly valuable in commercial and industrial applications, where maintaining high standards of cleanliness and hygiene is critical. Automated dispensers, smart cleaning systems, and real-time monitoring of cleaning efficiency are just a few examples of how digital and smart solutions are revolutionizing the market.
One of the most prominent innovations in this domain is the automated dispenser. These devices are designed to release a precise amount of cleaning chemical, ensuring optimal usage and minimizing waste. Automated dispensers can be programmed to dispense chemicals at specific times or in response to certain triggers, such as the presence of dirt or the detection of high foot traffic areas. This automation not only ensures consistent cleaning but also significantly reduces the manual effort required, allowing staff to focus on other important tasks. In commercial settings such as hospitals, hotels, and offices, where cleanliness is paramount, automated dispensers ensure that cleaning protocols are adhered to rigorously, enhancing overall hygiene and safety.
Regional Market Outlook
Region-wise, it is analyzed across North America, Europe, Asia-Pacific, and LAMEA. In North America, the cleaning chemicals market is driven by the stringent regulatory environment and a heightened awareness of hygiene and sanitation. The United States and Canada are the primary consumers, with a diverse range of products used across various sectors including residential, commercial, and industrial.
The Asia-Pacific region is experiencing rapid growth in the cleaning chemicals market, driven by increasing urbanization, industrialization, and rising disposable incomes. Countries such as China, India, Japan, and South Korea are significant contributors to this growth. The market is diverse, spanning residential, commercial, and industrial sectors, with a burgeoning demand for products like disinfectants, floor cleaners, and industrial degreasers. The COVID-19 pandemic has notably boosted the consumption of cleaning chemicals, particularly in the healthcare and hospitality sectors.

Competitive Analysis
Key market players in the cleaning chemicals market include CLARIANT, BASF SE, Dow, DuPont, Ecolab, Evonik, Pilot Chemical Corp, Unilever Professional India, Reckitt Benckiser Group PLC, and The Clorox Company.
Industry Trends
- In February 2022, Clariant launched Vita, a series of 100% bio-based polyethylene glycols (PEGs) and surfactants designed to aid in climate change mitigation. These innovative surfactants and PEGs are produced using ethylene oxide obtained solely from bioethanol derived from sugar cane or maize. Vita products are utilized across multiple end-user segments, including metal cleaning chemicals.
- In February 2022, Henkel introduced a new dishwashing liquid range, Pril Stark & Natürlich, which emphasizes natural ingredients and sustainable packaging. This product line includes a refillable pump dispenser made entirely from recycled plastic. Additionally, the refill pouches use 70 percent less plastic compared to the pump dispensers. The formula itself boasts 93% natural ingredients, including food-certified colorants and fragrances.
- In April 2022, J.R. Watkins introduced their clean and powerful Foaming Dish Soap in select Target stores across California. This soap is made with plant-based cleansing agents, including coconut, and is hypoallergenic and dermatologically tested. It is free from sulfates, parabens, triclosan, and petroleum-based ingredients.
- In April 2024, the Kansas and Missouri Departments of Agriculture, in partnership with the U.S. Environmental Protection Agency (EPA) , ordered 17 grocery stores in the Kansas City area to stop the sale and distribution of certain Fabuloso household disinfectants, as well as other disinfection products, further boosting the cleaning chemicals market.
Historic Trends of Cleaning Chemicals Market
- 1960s, cleaning chemicals were primarily focused on basic functions, such as disinfecting and removing stains. The use of chlorine bleach and ammonia was common due to their effectiveness in killing bacteria and removing tough stains.
- The 1970s and 1980s saw a growing awareness of the environmental impact of cleaning chemicals. The emergence of the environmental movement led to the development of more environmentally friendly products. Biodegradable surfactants and phosphate-free detergents became more prevalent as concerns about water pollution and ecological damage increased. Additionally, the concept of "green cleaning" began to take shape, although it was not yet widely adopted.
- In the 2010s the trend of environmental consciousness, with a focus on sustainability and transparency. The use of plant-based ingredients and the reduction of single-use plastics in packaging became key trends. There was also a rise in the use of technology in cleaning products, such as smart dispensers and advanced formulations that improve efficiency.
- The 2020s have been marked by an increased emphasis on health and safety, partly driven by the COVID-19 pandemic. The demand for disinfectants and sanitizers surged, and cleaning chemicals with antiviral properties became highly sought after. There has been a strong push towards reducing harmful chemicals and improving product sustainability.
Key Sources Referred
- Occupational Safety and Health Administration
- The International Trade Administration
- U.S. Environmental Protection Agency
- International Energy Agency
- California Air Resources Board
- Department of Energy
- SAE International
- Infineon Technologies AG
Key Benefits For Stakeholders
- This report provides a quantitative analysis of the market segments, current trends, estimations, and dynamics of the cleaning chemicals market analysis from 2024 to 2033 to identify the prevailing cleaning chemicals market opportunities.
- The market research is offered along with information related to key drivers, restraints, and opportunities.
- Porter's five forces analysis highlights the potency of buyers and suppliers to enable stakeholders make profit-oriented business decisions and strengthen their supplier-buyer network.
- In-depth analysis of the cleaning chemicals market segmentation assists to determine the prevailing market opportunities.
- Major countries in each region are mapped according to their revenue contribution to the global market.
- Market player positioning facilitates benchmarking and provides a clear understanding of the present position of the market players.
- The report includes the analysis of the regional as well as global cleaning chemicals market trends, key players, market segments, application areas, and market growth strategies.
Cleaning Chemicals Market Report Highlights
| Aspects | Details |
| Market Size By 2033 | USD 73.0 Billion |
| Growth Rate | CAGR of 4.5% |
| Forecast period | 2024 - 2033 |
| Report Pages | 300 |
| By Ingredient Type |
|
| By Product Type |
|
| By Application |
|
| By Region |
|
| Key Market Players | Dow, DuPont, Unilever Professional India, The Clorox Company, Pilot Chemical Corp, Ecolab, Evonik, BASF SE, CLARIANT, Reckitt Benckiser Group PLC |
Key market players in the cleaning chemicals market include CLARIANT, BASF SE, Dow, DuPont, Ecolab, Evonik, Pilot Chemical Corp, Unilever Professional India, Reckitt Benckiser Group PLC, and The Clorox Company.
The global cleaning chemicals market was valued at $47.2 billion in 2023, and is projected to reach $73.0 billion by 2033, growing at a CAGR of 4.5% from 2024 to 2033.
Asia-Pacific is the largest region for cleaning chemicals market.
Manufacturing and commercial offices is the leading application of cleaning chemicals market.
Integration of cleaning chemicals with smart technologies and IoT devices are the upcoming trends of cleaning chemicals market.
Loading Table Of Content...

