
Cleanroom Technology In Healthcare Market Research, 2032
The global cleanroom technology in healthcare market size was valued at $5.2 billion in 2022, and is projected to reach $8.6 billion by 2032, growing at a CAGR of 5.2% from 2023 to 2032. Factors such as surge in demand for cleanroom technologies, recent innovations in cleanroom technology and technological advancements in cleanroom technologies are driving the market growth. Cleanroom technologies have evolved in recent years as a result of growing concerns about building materials contamination, regulatory requirements, operational performance, and increased demand for modular cleanrooms. For instance, one of the most significant innovations is the integration of Artificial Intelligence (AI) and Machine Learning (ML). With AI and ML algorithms, smart sensors can be analyzed, and clean room conditions can be optimized in real-time.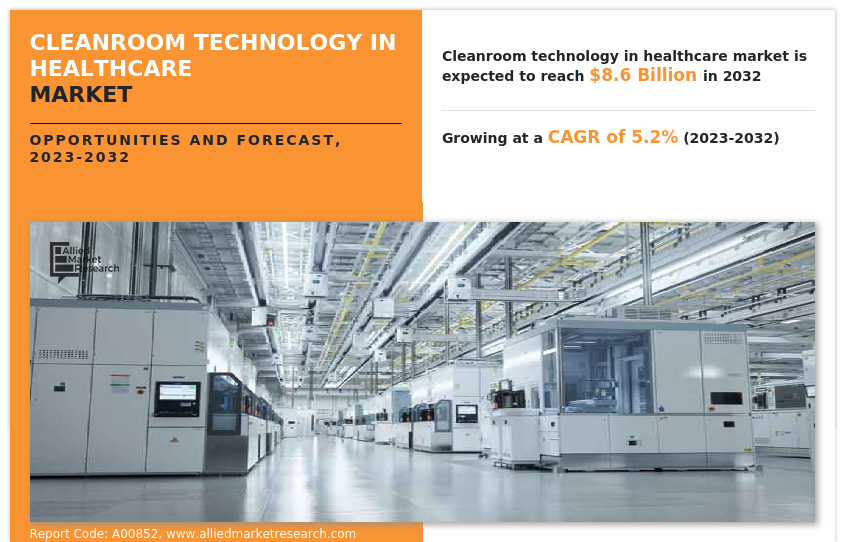
Key Takeaways:
By component, the cleanroom consumables segment dominated the global market in 2022.
The cleanroom equipment segment is anticipated to be the fastest-growing segment during the forecast period.
By end user, the pharmaceutical and biotechnology industry segment dominated the market in terms of revenue in 2022.
The medical device industry segment is anticipated to be the fastest growing segment during the forecast period.
The North America region held the largest cleanroom technology in healthcare market share in terms of revenue in 2022.
Cleanrooms are highly regulated environments designed to filter and remove contaminants from the air, including dust, bacteria, and aerosols, to maintain a high level of cleanliness. They are essential settings for manufacture of a variety of sensitive products, such as medications, and medical devices, and are divided into categories based on the amount of particulate matter that can be permitted in the air. In addition, they are highly regulated, with precise control over temperature, airflow, and humidity to guarantee the ideal conditions for manufacturing and research procedures.
To clean and decontaminate the air entering the cleanroom, external air is drawn in and filtered through a filter system. Specialized filters, such as HEPA and ULPA, are used to ensure that the incoming air is cleaned and decontaminated in accordance with the system's specifications. After the air has been filtered, it is released into the controlled atmosphere of the cleanroom, where it is processed until it is of exceptional purity and free from contaminants. If any contaminants are present, the air is either returned to the outside air or recirculated through the filter system, beginning a new purification cycle.
Market Dynamics
Pharmaceutical companies, biotechnology companies, and many other healthcare facilities have seen a steady increase in the need for quality and product safety in their products. This has resulted in increased need for controlled environments to avoid contamination and to maintain product integrity. In addition, regulatory agencies and quality standards require manufacturers to maintain a high level of purity and quality in the products. As a result, cleanroom technologies have become increasingly popular in pharmaceutical and biotechnology industries. This boost the cleanroom technology in healthcare market size.
Also, cleanrooms are also a vital component of the operating room and surgical suite, where a sterile atmosphere is a necessity. A sterile environment reduces the likelihood of surgical site infections and complications. With rise of modern medical procedures, such as organ transplants, cleanroom facilities play an important role in maintaining a sterile environment and minimizing postoperative complications. Thus, surge in adoption of cleanroom technology in healthcare facilities such as hospitals and clinics is also contributing to the cleanroom technology in healthcare market share.
In addition, hospitals and clinics are among the first to adopt cleanroom technology due to the urgent need to improve infection control, ensure patient safety, and maintain a clean and controlled environment. A polluted environment can cause serious health issues, especially for patients with weakened immune systems. This propels cleanroom technology in healthcare market growth.
However, high initial installation cost of cleanrooms and complex maintenance and ongoing operational cost may act as restraints to the market growth. Cleanrooms have specialized infrastructure, stringent design and construction, and other regulatory compliance, which demands a higher cost of installation. This is a significant challenge to manufacturers and researchers in developed as well as developing regions, which may hinder the market growth. In addition, the routine maintenance of the cleanroom requires continuous energy and operational expenses, which can strain budgets, which may hinder the cleanroom technology in healthcare market growth.
However, technological advancements in cleanroom technologies are anticipated to boost the market during the forecast period. Integration of robotics allows cleanrooms to run with less human intervention, thus eliminating the possibility of contamination. AI in cleanroom technologies is also gaining traction, as they allow for real-time visibility and control of cleanroom environments.
Automation and robotics also increase efficiency and productivity in cleanrooms, leading to higher quality products. Such technological advances in cleanroom technologies are anticipated to increase the adoption of cleanroom around the globe, which will boost the market during the forecast period.
Moreover, advancements in filtration technologies are also increasing its adoption in cleanrooms. For instance, in March 2020, Camfil introduced Megalam EnerGuard, a new range of HEPA/ULPA filtration solutions. This is an advancement in HEPA filtration technology designed and developed to provide high-quality air filtration and decrease the cost of operation in industries operating cleanrooms. Such advancements in cleanroom related products are increasing their adoption and demand in the market.
In the wake of the global recession, the cleanroom industry has been affected by several sectors, including pharmaceuticals and medical technology, as well as biotechnology. Installation and maintenance of cleanrooms are costly, which has caused many companies to opt for energy-saving solutions, particularly in western economies. The cleanroom industry has experienced a moderate impact from the economic downturns in the U.S. and the European Union. Cleanroom manufacturers are now offering more cost-efficient designs while maintaining high standards.
Despite the economic downturn, cleanroom numbers are steadily increasing in the U.S. Also, the European countries are witnessing increase in sales of cleanroom technologies. Demand is also recovering in emerging markets, such as India and China. This will offer lucrative business opportunities for cleanroom technologies in the near future.
Segmental Overview
The cleanroom technology in healthcare market is segmented on the basis of component, end user, and region. On the basis of components, the market is segmented into cleanroom equipment and cleanroom consumables. The equipment segment is further segmented into heating ventilation and air conditioning system (HVAC), cleanroom air filters, air shower and diffuser, laminar air flow unit, and others. Also, the consumables segment is further segmented into cleanroom gloves, cleanroom wipes, cleaning products, cleanroom apparels, and others.
By end user, the market is segmented into pharmaceutical and biotechnology industry, medical device industry, and others. By region, the market is analyzed across North America (U.S., Canada, and Mexico), Europe (Germany, France, UK, Italy, Spain, and rest of Europe), Asia-Pacific (Japan, China, Australia, India, South Korea, and rest of Asia-Pacific), and LAMEA (Brazil, South Africa, Saudi Arabia, and Rest of LAMEA).
By Component
On the basis of component, the cleanroom consumables segment dominated the global market in 2022 and is anticipated to maintain its dominance during the forecast period. As cleanroom technologies become more popular in industries such as pharmaceuticals and healthcare, there is a growing need for more cleanrooms. The more cleanrooms there are, the more consumables are needed to maintain the cleanliness and functionality of the environment.
Also, contamination control is a key concern in cleanroom settings. With increased awareness of the effects of contamination on the quality and safety of products, there is increased focus on the use of consumables to avoid contamination in production and research environments. This drives the growth of the consumables segment.
However, the cleanroom equipment segment is anticipated to grow at the fastest rate during the forecast period. Cleanroom equipment manufacturers are constantly innovating to make their products more efficient and functional. These innovations improve the effectiveness and reliability of cleanroom equipment, leading to increase in demand for updated products. In addition, COVID-19 has raised awareness of the need for clean and regulated environments, especially in the healthcare and research sectors. Cleanroom equipment (air filtration systems, protective barriers, and others) is critical to infection control and safety, which is anticipated to drive the market in coming years.

By End User
By end user, the pharmaceutical and biotechnology segment dominated the market in terms of revenue in 2022. Cleanroom technologies play an important role in the advancement of biotechnology, which is responsible for the development of cutting-edge therapies and vaccines, as well as bio-pharmaceutical products. It also plays an important role in preserving the integrity of biotechnology products. For this purpose, the cleanroom technology providers increasingly provide bespoke solutions that meet the unique needs of pharmaceutical and biotechnology companies. This factor is driving the pharmaceuticals and biotechnology industry segment growth.
On the other hand, the medical device industry segment is anticiapted to be the fastest growing segment during the forecast period. The growth is mainly attributed to the rising number of medtech industries and adoption of cleanrooms by these companies for regulatory complaince.

By Region
The cleanroom technology in healthcare industry is analyzed across North America, Europe, Asia-Pacific, and LAMEA. North America dominated the market in terms of revenue in 2022, driven by several factors that contribute to its expansion and opportunities. North America has strict regulatory agencies, like the U.S. Food and Drug Administration (FDA), which enforce high standards of hygiene and quality in the pharmaceutical, biotechnology and healthcare sectors. The presence of key players in this region offering a wide range of products also propels the market for cleanroom technologies.
However, the Asia-Pacific region is anticipated to be the fastest growing segment during the cleanroom technology in healthcare market forecast. The growth is mainly due to the developing healthcare infrastructure, rising healthcare expenditure, surge in awareness about advancements in cleanrooms and large number of research and development activities in this region.

Competition Analysis
Competition analysis and profiles of the major players in the cleanroom technology in healthcare industry, such as DuPont de Nemours, Inc., Kimberly-Clark Corporation, Exyte Group, Taikisha Ltd., Terra Universal, Inc., Labconco Corporation, Clean Rooms International, Inc., Modular Cleanrooms, Inc., Clean Air Products Inc. and COLANDIS GmbH. Other key players in the market include Cleanroom Industries Sdn Bhd, Pharmintech Turnkey Solutions Pvt. Ltd., JOA, ACH Engineering, and others. Major players have adopted product launch and agreement as a key developmental strategy to improve the product portfolio and gain a strong foothold in the cleanroom technology in healthcare market.
Recent Product Launch in the Cleanroom Technology in Healthcare Market
In July 2023, Labconco Corporation launched the Nexus Horizontal Clean Bench, the first laminar flow hood of its kind with complete onboard intelligence.
Recent Agreement in the Cleanroom Technology in Healthcare Market
In October 2022, Labconco Corporation announced an agreement with Erlab Inc., a global leader in air filtration technology, under which Labconco will continue to feature Erlab components on their filtered fume hoods.
Key Benefits For Stakeholders
- This report provides a quantitative analysis of the market segments, current trends, estimations, and dynamics of the cleanroom technology in healthcare market analysis from 2022 to 2032 to identify the prevailing market opportunities.
- The market research is offered along with information related to key drivers, restraints, and opportunities.
- Porter's five forces analysis highlights the potency of buyers and suppliers to enable stakeholders make profit-oriented business decisions and strengthen their supplier-buyer network.
- In-depth analysis of the cleanroom technology in healthcare market segmentation assists to determine the prevailing cleanroom technology in healthcare market opportunity.
- Major countries in each region are mapped according to their revenue contribution to the global market.
- Market player positioning facilitates benchmarking and provides a clear understanding of the present position of the market players.
- The report includes the analysis of the regional as well as global cleanroom technology in healthcare market trends, key players, market segments, application areas, and market growth strategies.
Cleanroom Technology In Healthcare Market Report Highlights
| Aspects | Details |
| Market Size By 2032 | USD 8.6 billion |
| Growth Rate | CAGR of 5.2% |
| Forecast period | 2022 - 2032 |
| Report Pages | 179 |
| By End User |
|
| By Component |
|
| By Region |
|
| Key Market Players | Exyte Group, Clean Air Products Inc., Taikisha Ltd., Labconco Corporation, Clean Rooms International, Inc., DuPont de Nemours, Inc., Kimberly-Clark Corporation, COLANDIS GmbH, Modular Cleanrooms, Inc., Terra Universal, Inc. |
Analyst Review
The cleanroom technologies in healthcare market presents several opportunities and challenges. Cleanroom technologies encompass a range of specialized techniques, equipment, and environments designed to maintain exceptionally clean and controlled conditions with low levels of particulate and microbial contamination. These technologies are vital for applications in healthcare, where the utmost sterility, precision, and contamination control are required.
In addition, cleanrooms have become an integral part of a wide range of industries, and it is important to understand the drivers behind their growth in demand to make informed decisions. The regulatory environment around the world is becoming increasingly stringent, particularly in sectors such as pharmaceuticals, biotechnology, and healthcare. Regulators, such as the Food and Drug Administration (FDA) in the U.S. and the European Medicines Agency (EMA) in Europe, have established stringent standards for the quality of products, their safety, and cleanliness of products. Cleanrooms play a key role in ensuring that these standards are met and maintained, which leads to the expansion of the market.
Furthermore, the North America region dominated the market in terms of revenue in 2022, whereas the Asia-Pacific region is anticipated to be the fastest growing region during the forecast period. The growth in demand is also owing to the technological advancements in cleanroom technologies and its adoption in these regions.
The base year is 2022 in cleanroom technology in healthcare market.
The forecast period for cleanroom technology in healthcare market is 2023 to 2032.
The total market value of cleanroom technology in healthcare market is $5.2 billion in 2022.
The market value of cleanroom technology in healthcare market in 2032 is $8.6 billion.
Major players that operate in the cleanroom technology in healthcare market are DuPont de Nemours, Inc., Kimberly-Clark Corporation, Exyte Group, Taikisha Ltd., Terra Universal, Inc., Labconco Corporation, Clean Rooms International, Inc., Modular Cleanrooms, Inc., Clean Air Products Inc., and COLANDIS GmbH.
The consumables segment dominated the market in 2022, as there is a frequent need for cleanroom consumables for efficiently managing the cleanrooms. Consumables such as cleanroom apparels, cleanroom gloves, cleanroom wipes, and others are required on a daily basis for working in cleanrooms and hence, there is a high demand for these consumables in the market.
Key factors driving the growth of the cleanroom technology in healthcare market includes Surge in demand for cleanroom technologies, recent innovations in cleanroom technology and surge in adoption of cleanroom technology in healthcare facilities.
Asia-pacific region is anticipated to be the fastest growing region during the forecast period. The growth in this region is mainly due to the rising R&D activities related to cell and gene therapies.
Loading Table Of Content...
Loading Research Methodology...

