Report Code: A03960 | Sep 2017 | Pages: 180 | ||
Tables: 70 | Charts: 92 |
|
Pandemic disrupted the entire world and affected many industries.
Get detailed COVID-19 impact analysis on the Cloud Enterprise Application Software Market
Request Now !The global cloud enterprise application software market was valued at $55,988 million in 2016, and is expected to reach $144,111 million by 2023, growing at a CAGR of 14.6% from 2017 to 2023. Enterprise application is a business application, which is useful for enterprises to integrate their business functionalities to achieve high efficiency and productivity. Cloud-based deployment platform has given a significant boost to the enterprise application software during last few years. The report encompasses study of different cloud enterprise application software by solutions such as CRM, ERP, SCM, BI, BPM, CMS, EAM, Web conferencing, and others. Furthermore, it focuses on adoption of cloud-based enterprise application software in various industry verticals such as manufacturing, healthcare, retail, oil & gas, BFSI, telecom, and others.
The global cloud enterprise application software market is segmented on the basis of solution, industry vertical, and geography. Based on solution, the market is segmented into customer relationship management (CRM), enterprise resource planning (ERP), supply chain management (SCM), Web conferencing, business intelligence (BI), business process management (BPM), content management system (CMS), enterprise asset management (EAM), and others. By industry vertical, it is classified into manufacturing & services, BFSI, healthcare, retail, government, oil & gas, telecom, and others. Geographically, cloud enterprise application software market is analyzed across North America, Europe, Asia-Pacific, and LAMEA.
The major factors that drive the growth of the global cloud enterprise application software market are increase in adoption of cloud-based solutions, inclination of companies towards customer-centric approach, and realization of competitive advantages achieved through implementation of enterprise application software, rapid changes in business models, and emerging trends of cloud.
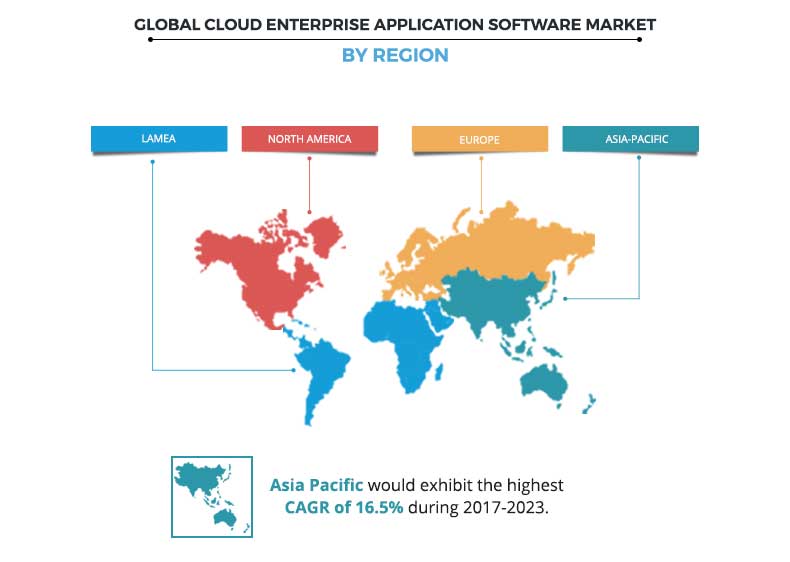
The North American cloud enterprise application software market generated the highest revenue in 2016, owing to increase in adoption of cloud-based solutions, presence of a large number of enterprises, and rise in adoption of IoT. The Asia-Pacific cloud enterprise application software market is expected to grow at the highest CAGR, owing to increase in penetration of internet and surge in adoption of ERP application in the government agencies. Furthermore, SMEs in the region have developing technological infrastructure, which fosters the adoption of cloud-based enterprise applications.
The key players operating in the cloud enterprise application software industry include Oracle, IBM, Microsoft, SAP, HP, QAD Inc., IFS AB, Epicor Software Corp., Infor, and Salesforce.com. These players have expanded their market presence by adopting various business strategies such as acquisition, geographical expansion, product development, strategic alliance, and collaboration.
Top Investment Pockets
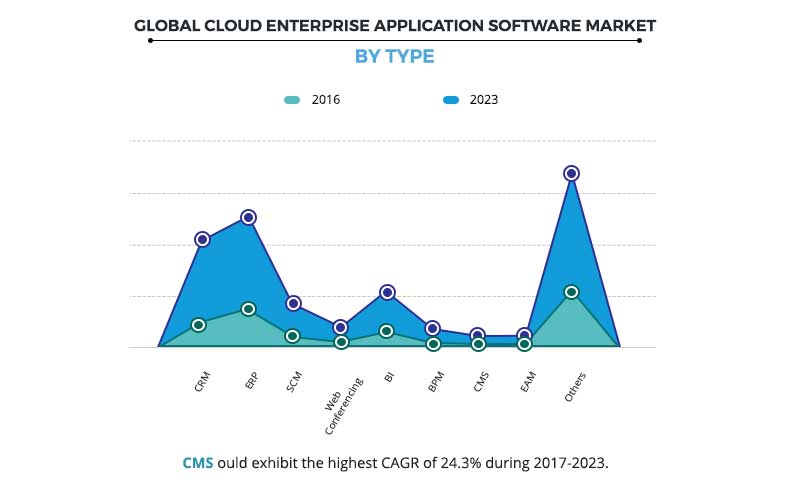
The following graph signifies the growth potential of the global cloud enterprise application software market by solution. It is observed that the market growth is driven by the others segment (includes human resource management, environmental resources management, management information system, decision support system, Business continuity planning, collaboration, IT service management, enterprise application integration, and enterprise forms automation), which occupied the largest market share in 2016. However, major growth is observed in the content management system (CMS) sector where cloud enterprise application software solutions are expected to witness considerable adoption in the near future.
Segmentation
By Solution
Large number of companies operating in the global cloud enterprise application software market offer specific enterprise application solutions as per the requirements of end-user industries. Selection of enterprise application depends upon factors such as need of enterprise, business size, functional areas, and expected benefits to organizations. Major enterprise application available in the market are CRM, ERP, SCM, BI, BPM, CMS, EAM, and Web conferencing.
Enterprise Resource Planning (ERP)
Companies are adopting cloud ERP applications to optimize their business functions and IT process. Social media and its integration with cloud ERP application are expected to provide potential growth opportunities for ERP vendors. Employees in the organization use smart phones and tablets, leading to a higher demand for smartphone enabled ERP solutions, which are being deployed on cloud-based platform. Numerous companies are expanding their global presence, which is further anticipated to provide growth opportunity for the cloud ERP solution vendors to cater to the increasing demands for ERP from end-user industries.
By Geography
North America
Companies are increasingly investing in the IT sector to implement enterprise application for proper work process. Adoption of enterprise application leads to enhanced business performance. However, adoption of enterprise application depends on business requirement, as it reduces operational costs and helps the organization to perform multiple tasks at a time. Cloud-based enterprise application has witnessed high adoption in North America, owing to established telecommunication infrastructure in the country such as the U.S. In addition, to leverage the businesses and to enhance the customer experience, enterprises have adopted enterprise application, which fueled the market growth.
Key Benefits:
Cloud Enterprise Application Software Market Report Highlights
Aspects | Details |
---|---|
By Solution |
|
By Industry Vertical |
|
By Geography |
|
Key Market Players | INFOR, SAP SE, MICROSOFT CORPORATION, SALESFORCE.COM, ORACLE CORPORATION, HP, IBM CORPORATION, IFS AB, EPICOR SOFTWARE CORP., QAD INC. |
CHAPTER 1 INTRODUCTION
1.1. REPORT DESCRIPTION
1.2. KEY BENEFITS
1.3. KEY MARKET SEGMENTS
1.4. RESEARCH METHODOLOGY
1.4.1. Primary research
1.4.2. Secondary research
1.4.3. Analyst tools and models
1.4.4. Market segmentation
CHAPTER 2 EXECUTIVE SUMMARY
2.1. CXO PERSPECTIVE
CHAPTER 3 MARKET OVERVIEW
3.1. MARKET DEFINITION AND SCOPE
3.2. KEY FINDINGS
3.2.1. Top winning strategies
3.2.2. Top investment pockets
3.2.3. Top impacting factors
3.3. PORTER’S FIVE FORCES
3.3.1. Bargaining power of buyers
3.3.2. Bargaining power of suppliers
3.3.3. Degree of competition
3.3.4. Threat of new entrants
3.3.5. Threat of substitute
3.4. MARKET PLAYER POSITIONING
3.5. MARKET DYNAMICS
3.5.1. Drivers
3.5.1.1. High adoption of cloud-based solutions
3.5.1.2. Inclination of companies towards customer-centric approach
3.5.1.3. Growing realization of competitive advantages achieved through implementation of enterprise application software
3.5.2. Restraints
3.5.2.1. High-costs associated with the services
3.5.2.2. Data security concerns
3.5.3. Opportunities
3.5.3.1. Rapid changes in business models
3.5.3.2. Emerging trends of cloud
CHAPTER 4 GLOBAL CLOUD ENTERPRISE APPLICATION SOFTWARE MARKET, BY SOLUTION
4.1. OVERVIEW
4.2. CUSTOMER RELATIONSHIP MANAGEMENT (CRM)
4.2.1. Key market trends
4.2.2. Key growth factors and opportunities
4.2.3. Market size and forecast, by region
4.3. ENTERPRISE RESOURCE PLANNING (ERP)
4.3.1. Key market trends
4.3.2. Key growth factors and opportunities
4.3.3. Market size and forecast, by region
4.4. SUPPLY CHAIN MANAGEMENT (SCM)
4.4.1. Key market trends
4.4.2. Key growth factors and opportunities
4.4.3. Market size and forecast, by region
4.5. WEB CONFERENCING
4.5.1. Key market trends
4.5.2. Key growth factors and opportunities
4.5.3. Market size and forecast, by region
4.6. BUSINESS INTELLIGENCE (BI)
4.6.1. Key market trends
4.6.2. Key growth factors and opportunities
4.6.3. Market size and forecast, by region
4.7. BUSINESS PROCESS MANAGEMENT (BPM)
4.7.1. Key market trends
4.7.2. Key growth factors and opportunities
4.7.3. Market size and forecast, by region
4.8. CONTENT MANAGEMENT SYSTEM (CMS)
4.8.1. Key market trends
4.8.2. Key growth factors and opportunities
4.8.3. Market size and forecast, by region
4.9. ENTERPRISE ASSET MANAGEMENT (EAM)
4.9.1. Key market trends
4.9.2. Key growth factors and opportunities
4.9.3. Market size and forecast, by region
4.10. OTHERS
4.10.1. Key market trends
4.10.2. Key growth factors and opportunities
4.10.3. Market size and forecast, by region
CHAPTER 5 GLOBAL CLOUD ENTERPRISE APPLICATION SOFTWARE MARKET, BY INDUSTRY VERTICAL
5.1. OVERVIEW
5.2. MANUFACTURING AND SERVICES
5.2.1. Key market trends
5.2.2. Key growth factors and opportunities
5.2.3. Market size and forecast
5.3. BANKING, FINANCIAL SERVICES, AND INSURANCE (BFSI)
5.3.1. Key market trends
5.3.2. Key growth factors and opportunities
5.3.3. Market size and forecast
5.4. HEALTHCARE
5.4.1. Key market trends
5.4.2. Key growth factors and opportunities
5.4.3. Market size and forecast
5.5. RETAIL
5.5.1. Key market trends
5.5.2. Key growth factors and opportunities
5.5.3. Market size and forecast
5.6. GOVERNMENT
5.6.1. Key market trends
5.6.2. Key growth factors and opportunities
5.6.3. Market size and forecast
5.7. OIL & GAS
5.7.1. Key market trends
5.7.2. Key growth factors and opportunities
5.7.3. Market size and forecast
5.8. TELECOM
5.8.1. Key market trends
5.8.2. Key growth factors and opportunities
5.8.3. Market size and forecast
5.9. OTHERS
5.9.1. Key market trends
5.9.2. Key growth factors and opportunities
5.9.3. Market size and forecast
CHAPTER 6 CLOUD ENTERPRISE APPLICATION SOFTWARE MARKET, BY GEOGRAPHY
6.1. OVERVIEW
6.2. NORTH AMERICA
6.2.1. Key trends
6.2.2. Key growth factors and opportunities
6.2.3. Market size and forecast, by solution
6.2.4. Market size and forecast, by industry vertical
6.2.5. Market size and forecast, by country
6.2.6. U.S.
6.2.6.1. Market size and forecast, by solution
6.2.6.2. Market size and forecast, by industry vertical
6.2.7. Canada
6.2.7.1. Market size and forecast, by solution
6.2.7.2. Market size and forecast, by industry vertical
6.2.8. Mexico
6.2.8.1. Market size and forecast, by solution
6.2.8.2. Market size and forecast, by industry vertical
6.3. EUROPE
6.3.1. Key market trends
6.3.2. Key growth factors and opportunities
6.3.3. Market size and forecast, by solution
6.3.4. Market size and forecast, by industry vertical
6.3.5. Market size and forecast, by country
6.3.6. UK
6.3.6.1. Market size and forecast, by solution
6.3.6.2. Market size and forecast, by industry vertical
6.3.7. Germany
6.3.7.1. Market size and forecast, by solution
6.3.7.2. Market size and forecast, by industry vertical
6.3.8. France
6.3.8.1. Market size and forecast, by solution
6.3.8.2. Market size and forecast, by industry vertical
6.3.9. Rest of Europe
6.3.9.1. Market size and forecast, by solution
6.3.9.2. Market size and forecast, by industry vertical
6.4. ASIA-PACIFIC
6.4.1. Key market trends
6.4.2. Key growth factors and opportunities
6.4.3. Market size and forecast, by solution
6.4.4. Market size and forecast, by industry vertical
6.4.5. Market size and forecast, by country
6.4.6. China
6.4.6.1. Market size and forecast, by solution
6.4.6.2. Market size and forecast, by industry vertical
6.4.7. India
6.4.7.1. Market size and forecast, by solution
6.4.7.2. Market size and forecast, by industry vertical
6.4.8. Japan
6.4.8.1. Market size and forecast, by solution
6.4.8.2. Market size and forecast, by industry vertical
6.4.9. Rest of Asia-Pacific
6.4.9.1. Market size and forecast, by solution
6.4.9.2. Market size and forecast, by industry vertical
6.5. LAMEA
6.5.1. Key market trends
6.5.2. Key growth factors and opportunities
6.5.3. Market size and forecast, by solution
6.5.4. Market size and forecast, by industry vertical
6.5.5. Market size and forecast, by country
6.5.6. Latin America
6.5.6.1. Market size and forecast, by solution
6.5.6.2. Market size and forecast, by industry vertical
6.5.7. Middle East
6.5.7.1. Market size and forecast, by solution
6.5.7.2. Market size and forecast, by industry vertical
6.5.8. Africa
6.5.8.1. Market size and forecast, by solution
6.5.8.2. Market size and forecast, by industry vertical
CHAPTER 7 COMPANY PROFILES
7.1. ORACLE CORPORATION
7.1.1. Company overview
7.1.2. Company snapshot
7.1.3. Business performance
7.1.4. Key strategic moves & developments
7.2. IBM CORPORATION
7.2.1. Company overview
7.2.2. Company snapshot
7.2.3. Business performance
7.2.4. Key strategic moves & developments
7.3. MICROSOFT CORPORATION
7.3.1. Company overview
7.3.2. Company snapshot
7.3.3. Business performance
7.3.4. Key strategic moves & developments
7.4. SAP SE
7.4.1. Company overview
7.4.2. Company snapshot
7.4.3. Business performance
7.4.4. Key strategic moves & developments
7.5. HP
7.5.1. Company overview
7.5.2. Company snapshot
7.5.3. Business performance
7.5.4. Key strategic moves & developments
7.6. QAD INC.
7.6.1. Company overview
7.6.2. Company snapshot
7.6.3. Business performance
7.6.4. Key strategic moves & developments
7.7. IFS AB
7.7.1. Company overview
7.7.2. Company snapshot
7.7.3. Business performance
7.7.4. Key strategic moves & developments
7.8. EPICOR SOFTWARE CORP.
7.8.1. Company overview
7.8.2. Company snapshot
7.8.3. Business performance
7.8.4. Key strategic moves & developments
7.9. INFOR
7.9.1. Company overview
7.9.2. Company snapshot
7.9.3. Business performance
7.9.4. Key strategic moves & developments
7.10. SALESFORCE.COM
7.10.1. Company overview
7.10.2. Company snapshot
7.10.3. Business performance
7.10.4. Key strategic moves & developments
LIST OF TABLES
TABLE 1. GLOBAL CLOUD ENTERPRISE APPLICATION SOFTWARE MARKET, BY SOLUTION, 2016-2023 ($MILLION)
TABLE 2. GLOBAL CLOUD ENTERPRISE APPLICATION SOFTWARE MARKET FOR CRM, BY REGION, 2016-2023 ($MILLION)
TABLE 3. GLOBAL CLOUD ENTERPRISE APPLICATION SOFTWARE MARKET FOR ERP, BY REGION, 2016-2023 ($MILLION)
TABLE 4. GLOBAL CLOUD ENTERPRISE APPLICATION SOFTWARE MARKET FOR SCM, BY REGION, 2016-2023 ($MILLION)
TABLE 5. GLOBAL CLOUD ENTERPRISE APPLICATION SOFTWARE MARKET FOR WEB CONFERENCING, BY REGION, 2016-2023 ($MILLION)
TABLE 6. GLOBAL CLOUD ENTERPRISE APPLICATION SOFTWARE MARKET FOR BI, BY REGION, 2016-2023 ($MILLION)
TABLE 7. GLOBAL CLOUD ENTERPRISE APPLICATION SOFTWARE MARKET FOR BPM, BY REGION, 2016-2023 ($MILLION)
TABLE 8. GLOBAL CLOUD ENTERPRISE APPLICATION SOFTWARE MARKET FOR CMS, BY REGION, 2016-2023 ($MILLION)
TABLE 9. GLOBAL CLOUD ENTERPRISE APPLICATION SOFTWARE MARKET FOR EAM, BY REGION, 2016-2023 ($MILLION)
TABLE 10. GLOBAL CLOUD ENTERPRISE APPLICATION SOFTWARE MARKET FOR OTHERS, BY REGION, 2016-2023 ($MILLION)
TABLE 11. GLOBAL CLOUD ENTERPRISE APPLICATION SOFTWARE MARKET, BY INDUSTRY VERTICAL, 2016-2023 ($MILLION)
TABLE 12. GLOBAL CLOUD ENTERPRISE APPLICATION SOFTWARE MARKET FOR MANUFACTURING AND SERVICES, BY REGION, 2016-2023 ($MILLION)
TABLE 13. GLOBAL CLOUD ENTERPRISE APPLICATION SOFTWARE MARKET FOR BFSI, BY REGION, 2016-2023 ($MILLION)
TABLE 14. GLOBAL CLOUD ENTERPRISE APPLICATION SOFTWARE MARKET FOR HEALTHCARE, BY REGION, 2016-2023 ($MILLION)
TABLE 15. GLOBAL CLOUD ENTERPRISE APPLICATION SOFTWARE MARKET FOR RETAIL, BY REGION, 2016-2023 ($MILLION)
TABLE 16. GLOBAL CLOUD ENTERPRISE APPLICATION SOFTWARE MARKET FOR GOVERNMENT, BY REGION, 2016-2023 ($MILLION)
TABLE 17. GLOBAL CLOUD ENTERPRISE APPLICATION SOFTWARE MARKET FOR OIL & GAS, BY REGION, 2016-2023 ($MILLION)
TABLE 18. GLOBAL CLOUD ENTERPRISE APPLICATION SOFTWARE MARKET FOR TELECOM, BY REGION, 2016-2023 ($MILLION)
TABLE 19. GLOBAL CLOUD ENTERPRISE APPLICATION SOFTWARE MARKET FOR OTHERS, BY REGION, 2016-2023 ($MILLION)
TABLE 20. CLOUD ENTERPRISE APPLICATION SOFTWARE MARKET, BY REGION, 2016-2023 ($MILLION)
TABLE 21. NORTH AMERICA CLOUD ENTERPRISE APPLICATION SOFTWARE MARKET, BY SOLUTION, 2016-2023 ($MILLION)
TABLE 22. NORTH AMERICA CLOUD ENTERPRISE APPLICATION SOFTWARE MARKET, BY INDUSTRY VERTICAL, 2016-2023 ($MILLION)
TABLE 23. NORTH AMERICA CLOUD ENTERPRISE APPLICATION SOFTWARE MARKET, BY COUNTRY, 2016-2023 ($MILLION)
TABLE 24. U.S. CLOUD ENTERPRISE APPLICATION SOFTWARE MARKET, BY SOLUTION, 2016-2023 ($MILLION)
TABLE 25. U.S. CLOUD ENTERPRISE APPLICATION SOFTWARE MARKET, BY INDUSTRY VERTICAL, 2016-2023 ($MILLION)
TABLE 26. CANADA CLOUD ENTERPRISE APPLICATION SOFTWARE MARKET, BY SOLUTION, 2016-2023 ($MILLION)
TABLE 27. CANADA CLOUD ENTERPRISE APPLICATION SOFTWARE MARKET, BY INDUSTRY VERTICAL, 2016-2023 ($MILLION)
TABLE 28. MEXICO CLOUD ENTERPRISE APPLICATION SOFTWARE MARKET, BY SOLUTION, 2016-2023 ($MILLION)
TABLE 29. MEXICO CLOUD ENTERPRISE APPLICATION SOFTWARE MARKET, BY INDUSTRY VERTICAL, 2016-2023 ($MILLION)
TABLE 30. EUROPE CLOUD ENTERPRISE APPLICATION SOFTWARE MARKET, BY SOLUTION, 2016-2023 ($MILLION)
TABLE 31. EUROPE CLOUD ENTERPRISE APPLICATION SOFTWARE MARKET, BY INDUSTRY VERTICAL, 2016-2023 ($MILLION)
TABLE 32. EUROPE CLOUD ENTERPRISE APPLICATION SOFTWARE MARKET, BY COUNTRY, 2016-2023 ($MILLION)
TABLE 33. UK CLOUD ENTERPRISE APPLICATION SOFTWARE MARKET, BY SOLUTION, 2016-2023 ($MILLION)
TABLE 34. UK CLOUD ENTERPRISE APPLICATION SOFTWARE MARKET, BY INDUSTRY VERTICAL, 2016-2023 ($MILLION)
TABLE 35. GERMANY CLOUD ENTERPRISE APPLICATION SOFTWARE MARKET, BY SOLUTION, 2016-2023 ($MILLION)
TABLE 36. GERMANY CLOUD ENTERPRISE APPLICATION SOFTWARE MARKET, BY INDUSTRY VERTICAL, 2016-2023 ($MILLION)
TABLE 37. FRANCE CLOUD ENTERPRISE APPLICATION SOFTWARE MARKET, BY SOLUTION, 2016-2023 ($MILLION)
TABLE 38. FRANCE CLOUD ENTERPRISE APPLICATION SOFTWARE MARKET, BY INDUSTRY VERTICAL, 2016-2023 ($MILLION)
TABLE 39. REST OF EUROPE CLOUD ENTERPRISE APPLICATION SOFTWARE MARKET, BY SOLUTION, 2016-2023 ($MILLION)
TABLE 40. REST OF EUROPE CLOUD ENTERPRISE APPLICATION SOFTWARE MARKET, BY INDUSTRY VERTICAL, 2016-2023 ($MILLION)
TABLE 41. ASIA-PACIFIC CLOUD ENTERPRISE APPLICATION SOFTWARE MARKET, BY SOLUTION, 2016-2023 ($MILLION)
TABLE 42. ASIA-PACIFIC CLOUD ENTERPRISE APPLICATION SOFTWARE MARKET, BY INDUSTRY VERTICAL, 2016-2023 ($MILLION)
TABLE 43. ASIA-PACIFIC CLOUD ENTERPRISE APPLICATION SOFTWARE MARKET, BY COUNTRY, 2016-2023 ($MILLION)
TABLE 44. CHINA CLOUD ENTERPRISE APPLICATION SOFTWARE MARKET, BY SOLUTION, 2016-2023 ($MILLION)
TABLE 45. CHINA CLOUD ENTERPRISE APPLICATION SOFTWARE MARKET, BY INDUSTRY VERTICAL, 2016-2023 ($MILLION)
TABLE 46. INDIA CLOUD ENTERPRISE APPLICATION SOFTWARE MARKET, BY SOLUTION, 2016-2023 ($MILLION)
TABLE 47. INDIA CLOUD ENTERPRISE APPLICATION SOFTWARE MARKET, BY INDUSTRY VERTICAL, 2016-2023 ($MILLION)
TABLE 48. JAPAN CLOUD ENTERPRISE APPLICATION SOFTWARE MARKET, BY SOLUTION, 2016-2023 ($MILLION)
TABLE 49. JAPAN CLOUD ENTERPRISE APPLICATION SOFTWARE MARKET, BY INDUSTRY VERTICAL, 2016-2023 ($MILLION)
TABLE 50. REST OF ASIA-PACIFIC CLOUD ENTERPRISE APPLICATION SOFTWARE MARKET, BY SOLUTION, 2016-2023 ($MILLION)
TABLE 51. REST OF ASIA-PACIFIC CLOUD ENTERPRISE APPLICATION SOFTWARE MARKET, BY INDUSTRY VERTICAL, 2016-2023 ($MILLION)
TABLE 52. LAMEA CLOUD ENTERPRISE APPLICATION SOFTWARE MARKET, BY SOLUTION, 2016-2023 ($MILLION)
TABLE 53. LAMEA CLOUD ENTERPRISE APPLICATION SOFTWARE MARKET, BY INDUSTRY VERTICAL, 2016-2023 ($MILLION)
TABLE 54. LAMEA CLOUD ENTERPRISE APPLICATION SOFTWARE MARKET, BY COUNTRY, 2016-2023 ($MILLION)
TABLE 55. LATIN AMERICA CLOUD ENTERPRISE APPLICATION SOFTWARE MARKET, BY SOLUTION, 2016-2023 ($MILLION)
TABLE 56. LATIN AMERICA CLOUD ENTERPRISE APPLICATION SOFTWARE MARKET, BY INDUSTRY VERTICAL, 2016-2023 ($MILLION)
TABLE 57. MIDDLE EAST CLOUD ENTERPRISE APPLICATION SOFTWARE MARKET, BY SOLUTION, 2016-2023 ($MILLION)
TABLE 58. MIDDLE EAST CLOUD ENTERPRISE APPLICATION SOFTWARE MARKET, BY INDUSTRY VERTICAL, 2016-2023 ($MILLION)
TABLE 59. AFRICA CLOUD ENTERPRISE APPLICATION SOFTWARE MARKET, BY SOLUTION, 2016-2023 ($MILLION)
TABLE 60. AFRICA CLOUD ENTERPRISE APPLICATION SOFTWARE MARKET, BY INDUSTRY VERTICAL, 2016-2023 ($MILLION)
TABLE 61. COMPANY SNAPSHOT: ORACLE CORPORATION
TABLE 62. COMPANY SNAPSHOT: IBM CORPORATION
TABLE 63. COMPANY SNAPSHOT: MICROSOFT CORPORATION
TABLE 64. COMPANY SNAPSHOT: SAP SE
TABLE 65. COMPANY SNAPSHOT: HP
TABLE 66. COMPANY SNAPSHOT: QAD INC.
TABLE 67. COMPANY SNAPSHOT: IFS AB
TABLE 68. COMPANY SNAPSHOT: EPICOR SOFTWARE CORP.
TABLE 69. COMPANY SNAPSHOT: INFOR
TABLE 70. COMPANY SNAPSHOT: SALESFORCE.COM
LIST OF FIGURES
FIGURE 1. MARKET SEGMENTATION: CLOUD ENTERPRISE APPLICATION SOFTWARE MARKET
FIGURE 2. TOP WINNING STRATEGIES, 2013-2017 (%)
FIGURE 3. TOP WINNING STRATEGIES, 2013-2017
FIGURE 4. TOP INVESTMENT POCKETS
FIGURE 5. TOP IMPACTING FACTORS
FIGURE 6. PORTER’S FIVE FORCES ANALYSIS
FIGURE 7. BARGAINING POWER OF BUYERS
FIGURE 8. BARGAINING POWER OF SUPPLIERS
FIGURE 9. DEGREE OF COMPETITION
FIGURE 10. THREAT OF NEW ENTRANTS
FIGURE 11. THREAT OF SUBSTITUTES
FIGURE 12. MARKET PLAYER POSITIONING, 2015
FIGURE 13. DRIVERS
FIGURE 14. RESTRAINTS
FIGURE 15. OPPORTUNITIES
FIGURE 16. COMPARATIVE SHARE ANALYSIS OF CLOUD ENTERPRISE APPLICATION SOFTWARE MARKET, BY SOLUTION, 2016 & 2023 (%)
FIGURE 17. COMPARATIVE SHARE ANALYSIS OF CLOUD ENTERPRISE APPLICATION SOFTWARE MARKET FOR CRM, BY REGION, 2016 & 2023 (%)
FIGURE 18. GLOBAL CLOUD ENTERPRISE APPLICATION SOFTWARE MARKET FOR CRM, 2016-2023 ($MILLION)
FIGURE 19. COMPARATIVE SHARE ANALYSIS OF CLOUD ENTERPRISE APPLICATION SOFTWARE MARKET FOR ERP, BY REGION, 2016 & 2023 (%)
FIGURE 20. GLOBAL CLOUD ENTERPRISE APPLICATION SOFTWARE MARKET FOR ERP, 2016-2023 ($MILLION)
FIGURE 21. COMPARATIVE SHARE ANALYSIS OF CLOUD ENTERPRISE APPLICATION SOFTWARE MARKET FOR SCM, BY REGION, 2016 & 2023 (%)
FIGURE 22. GLOBAL CLOUD ENTERPRISE APPLICATION SOFTWARE MARKET FOR SCM, 2016-2023 ($MILLION)
FIGURE 23. COMPARATIVE SHARE ANALYSIS OF CLOUD ENTERPRISE APPLICATION SOFTWARE MARKET FOR WEB CONFERENCING, BY REGION, 2016 & 2023 (%)
FIGURE 24. GLOBAL CLOUD ENTERPRISE APPLICATION SOFTWARE MARKET FOR WEB CONFERENCING, 2016-2023 ($MILLION)
FIGURE 25. COMPARATIVE SHARE ANALYSIS OF CLOUD ENTERPRISE APPLICATION SOFTWARE MARKET FOR BI, BY REGION, 2016 & 2023 (%)
FIGURE 26. GLOBAL CLOUD ENTERPRISE APPLICATION SOFTWARE MARKET FOR BI, 2016-2023 ($MILLION)
FIGURE 27. COMPARATIVE SHARE ANALYSIS OF CLOUD ENTERPRISE APPLICATION SOFTWARE MARKET FOR BPM BY REGION, 2016 & 2023 (%)
FIGURE 28. GLOBAL CLOUD ENTERPRISE APPLICATION SOFTWARE MARKET FOR BPM, 2016-2023 ($MILLION)
FIGURE 29. COMPARATIVE SHARE ANALYSIS OF CLOUD ENTERPRISE APPLICATION SOFTWARE MARKET FOR CMS, BY REGION, 2016 & 2023 (%)
FIGURE 30. GLOBAL CLOUD ENTERPRISE APPLICATION SOFTWARE MARKET FOR CMS, 2016-2023 ($MILLION)
FIGURE 31. COMPARATIVE SHARE ANALYSIS OF CLOUD ENTERPRISE APPLICATION SOFTWARE MARKET FOR EAM, BY REGION, 2016 & 2023 (%)
FIGURE 32. GLOBAL CLOUD ENTERPRISE APPLICATION SOFTWARE MARKET FOR EAM, 2016-2023 ($MILLION)
FIGURE 33. COMPARATIVE SHARE ANALYSIS OF CLOUD ENTERPRISE APPLICATION SOFTWARE MARKET FOR OTHERS, BY REGION, 2016 & 2023 (%)
FIGURE 34. GLOBAL CLOUD ENTERPRISE APPLICATION SOFTWARE MARKET FOR OTHERS, 2016-2023 ($MILLION)
FIGURE 35. COMPARATIVE SHARE ANALYSIS OF CLOUD ENTERPRISE APPLICATION SOFTWARE, BY INDUSTRY VERTICAL, 2016 & 2023 (%)
FIGURE 36. COMPARATIVE SHARE ANALYSIS OF CLOUD ENTERPRISE APPLICATION SOFTWARE MARKET FOR MANUFACTURING AND SERVICES, BY REGION, 2016 & 2023 (%)
FIGURE 37. GLOBAL CLOUD ENTERPRISE APPLICATION SOFTWARE MARKET FOR MANUFACTURING AND SERVICES, 2016-2023 ($MILLION)
FIGURE 38. COMPARATIVE SHARE ANALYSIS OF CLOUD ENTERPRISE APPLICATION SOFTWARE MARKET FOR BFSI, BY REGION, 2016 & 2023 (%)
FIGURE 39. GLOBAL CLOUD ENTERPRISE APPLICATION SOFTWARE MARKET FOR BFSI, 2016-2023 ($MILLION)
FIGURE 40. COMPARATIVE SHARE ANALYSIS OF CLOUD ENTERPRISE APPLICATION SOFTWARE MARKET FOR HEALTHCARE, BY REGION, 2016 & 2023 (%)
FIGURE 41. GLOBAL CLOUD ENTERPRISE APPLICATION SOFTWARE MARKET FOR HEALTHCARE, 2016-2023 ($MILLION)
FIGURE 42. COMPARATIVE SHARE ANALYSIS OF CLOUD ENTERPRISE APPLICATION SOFTWARE MARKET FOR RETAIL, BY REGION, 2016 & 2023 (%)
FIGURE 43. GLOBAL CLOUD ENTERPRISE APPLICATION SOFTWARE MARKET FOR RETAIL, 2016-2023 ($MILLION)
FIGURE 44. COMPARATIVE SHARE ANALYSIS OF CLOUD ENTERPRISE APPLICATION SOFTWARE MARKET FOR GOVERNMENT, BY REGION, 2016 & 2023 (%)
FIGURE 45. GLOBAL CLOUD ENTERPRISE APPLICATION SOFTWARE MARKET FOR GOVERNMENT, 2016-2023 ($MILLION)
FIGURE 46. COMPARATIVE SHARE ANALYSIS OF CLOUD ENTERPRISE APPLICATION SOFTWARE MARKET FOR OIL & GAS, BY REGION, 2016 & 2023 (%)
FIGURE 47. GLOBAL CLOUD ENTERPRISE APPLICATION SOFTWARE MARKET FOR OIL & GAS, 2016-2023 ($MILLION)
FIGURE 48. COMPARATIVE SHARE ANALYSIS OF CLOUD ENTERPRISE APPLICATION SOFTWARE MARKET FOR TELECOM, BY REGION, 2016 & 2023 (%)
FIGURE 49. GLOBAL CLOUD ENTERPRISE APPLICATION SOFTWARE MARKET FOR TELECOM, 2016-2023 ($MILLION)
FIGURE 50. COMPARATIVE SHARE ANALYSIS OF CLOUD ENTERPRISE APPLICATION SOFTWARE MARKET FOR OTHERS, BY REGION, 2016 & 2023 (%)
FIGURE 51. GLOBAL CLOUD ENTERPRISE APPLICATION SOFTWARE MARKET FOR OTHERS, 2016-2023 ($MILLION)
FIGURE 52. GLOBAL CLOUD ENTERPRISE APPLICATION SOFTWARE MARKET BY GEOGRAPHY, MARKET SHARE (2016) AND CAGR (2017-2023, %)
FIGURE 53. COMPARATIVE SHARE ANALYSIS OF NORTH AMERICA CLOUD ENTERPRISE APPLICATION SOFTWARE MARKET, BY SOLUTION, 2016 & 2023 (%)
FIGURE 54. COMPARATIVE SHARE ANALYSIS OF NORTH AMERICA CLOUD ENTERPRISE APPLICATION SOFTWARE MARKET, BY INDUSTRY VERTICAL, 2016 & 2023 (%)
FIGURE 55. COMPARATIVE SHARE ANALYSIS OF NORTH AMERICA CLOUD ENTERPRISE APPLICATION SOFTWARE MARKET, BY COUNTRY, 2016 & 2023 (%)
FIGURE 56. NORTH AMERICA CLOUD ENTERPRISE APPLICATION SOFTWARE MARKET, 2016-2023 ($MILLION)
FIGURE 57. U.S. CLOUD ENTERPRISE APPLICATION SOFTWARE MARKET, 2016-2023 ($MILLION)
FIGURE 58. CANADA CLOUD ENTERPRISE APPLICATION SOFTWARE MARKET, 2016-2023 ($MILLION)
FIGURE 59. MEXICO CLOUD ENTERPRISE APPLICATION SOFTWARE MARKET, 2016-2023 ($MILLION)
FIGURE 60. COMPARATIVE SHARE ANALYSIS OF EUROPE CLOUD ENTERPRISE APPLICATION SOFTWARE MARKET, BY SOLUTION, 2016 & 2023 (%)
FIGURE 61. COMPARATIVE SHARE ANALYSIS OF EUROPE CLOUD ENTERPRISE APPLICATION SOFTWARE MARKET, BY INDUSTRY VERTICAL, 2016 & 2023 (%)
FIGURE 62. COMPARATIVE SHARE ANALYSIS OF EUROPE CLOUD ENTERPRISE APPLICATION SOFTWARE MARKET, BY COUNTRY, 2016 & 2023 (%)
FIGURE 63. EUROPE CLOUD ENTERPRISE APPLICATION SOFTWARE MARKET, 2016-2023 ($MILLION)
FIGURE 64. UK CLOUD ENTERPRISE APPLICATION SOFTWARE MARKET, 2016-2023 ($MILLION)
FIGURE 65. GERMANY CLOUD ENTERPRISE APPLICATION SOFTWARE MARKET, 2016-2023 ($MILLION)
FIGURE 66. FRANCE CLOUD ENTERPRISE APPLICATION SOFTWARE MARKET, 2016-2023 ($MILLION)
FIGURE 67. REST OF EUROPE CLOUD ENTERPRISE APPLICATION SOFTWARE MARKET, 2016-2023 ($MILLION)
FIGURE 68. COMPARATIVE SHARE ANALYSIS OF ASIA-PACIFIC CLOUD ENTERPRISE APPLICATION SOFTWARE MARKET, BY SOLUTION, 2016 & 2023 (%)
FIGURE 69. COMPARATIVE SHARE ANALYSIS OF ASIA-PACIFIC CLOUD ENTERPRISE APPLICATION SOFTWARE MARKET, BY INDUSTRY VERTICAL, 2016 & 2023 (%)
FIGURE 70. COMPARATIVE SHARE ANALYSIS OF ASIA-PACIFIC CLOUD ENTERPRISE APPLICATION SOFTWARE MARKET, BY COUNTRY, 2016 & 2023 (%)
FIGURE 71. ASIA-PACIFIC CLOUD ENTERPRISE APPLICATION SOFTWARE MARKET, 2016-2023 ($MILLION)
FIGURE 72. CHINA CLOUD ENTERPRISE APPLICATION SOFTWARE MARKET, 2016-2023 ($MILLION)
FIGURE 73. INDIA CLOUD ENTERPRISE APPLICATION SOFTWARE MARKET, 2016-2023 ($MILLION)
FIGURE 74. JAPAN CLOUD ENTERPRISE APPLICATION SOFTWARE MARKET, 2016-2023 ($MILLION)
FIGURE 75. REST OF ASIA-PACIFIC CLOUD ENTERPRISE APPLICATION SOFTWARE MARKET, 2016-2023 ($MILLION)
FIGURE 76. COMPARATIVE SHARE ANALYSIS OF LAMEA CLOUD ENTERPRISE APPLICATION SOFTWARE MARKET, BY SOLUTION, 2016 & 2023 (%)
FIGURE 77. COMPARATIVE SHARE ANALYSIS OF LAMEA CLOUD ENTERPRISE APPLICATION SOFTWARE MARKET, BY INDUSTRY VERTICAL, 2016 & 2023 (%)
FIGURE 78. COMPARATIVE SHARE ANALYSIS OF LAMEA CLOUD ENTERPRISE APPLICATION SOFTWARE MARKET, BY COUNTRY, 2016 & 2023 (%)
FIGURE 79. LAMEA CLOUD ENTERPRISE APPLICATION SOFTWARE MARKET, 2016-2023 ($MILLION)
FIGURE 80. LATIN AMERICA CLOUD ENTERPRISE APPLICATION SOFTWARE MARKET, 2016-2023 ($MILLION)
FIGURE 81. MIDDLE EAST CLOUD ENTERPRISE APPLICATION SOFTWARE MARKET, 2016-2023 ($MILLION)
FIGURE 82. AFRICA CLOUD ENTERPRISE APPLICATION SOFTWARE MARKET, 2016-2023 ($MILLION)
FIGURE 83. ORACLE CORPORATION: FINANCIAL PERFORMANCE
FIGURE 84. IBM CORPORATION: FINANCIAL PERFORMANCE
FIGURE 85. MICROSOFT CORPORATION: FINANCIAL PERFORMANCE
FIGURE 86. SAP SE: FINANCIAL PERFORMANCE
FIGURE 87. HP: FINANCIAL PERFORMANCE
FIGURE 88. QAD INC.: FINANCIAL PERFORMANCE
FIGURE 89. IFS AB: FINANCIAL PERFORMANCE
FIGURE 90. EPICOR SOFTWARE CORP.: FINANCIAL PERFORMANCE
FIGURE 91. INFOR: FINANCIAL PERFORMANCE
FIGURE 92. SALESFORCE.COM: FINANCIAL PERFORMANCE
Cloud enterprise application software is used to meet the needs of an organization as an entity rather than individual users. Such organizations include businesses, clubs, charities, schools, governments, and others. Adoption of cloud deployment has gained significant acceptance among end users owing to various factors such as cost, customization, and integration with third-party application. Cloud-based enterprise applications are preferred by end users when they have low budget and less in-house IT infrastructure. Organizations implement cloud enterprise application software to ensure higher profitability and increase their working capital. Adoption of enterprise application allows the companies to integrate their operations with suppliers, channel partners, and customers. However, selection of appropriate enterprise application differs in accordance to business outfits and process. Cloud-enabled enterprise application (SaaS model) has witnessed high adoption as compared to the conventional on-premise enterprise application, owing to cost-effective advantages of SaaS model such as salability, flexibility, customization, and long-term viability.
The global cloud enterprise application software market size is expected to reach $80,849 million by 2023, owing high adoption of cloud-based solutions, change in organization structure & work management, and introduction of novel solutions by the key players. In addition, increase in demand for service outsourcing, high internet penetration in Asia-Pacific, and rise in demand for IoT among end use are expected to offer significant growth opportunities for the cloud enterprise application software market.
In 2016, North America cloud enterprise application software market generated the highest revenue, owing to its technologically advanced infrastructure and presence of the large number of organizations well equipped to adopt cloud enterprise application software. Asia-Pacific cloud enterprise application software market is expected to grow at the highest CAGR during the forecast period, owing to developing technological infrastructure, higher ICT spending, and high internet penetration in the region.
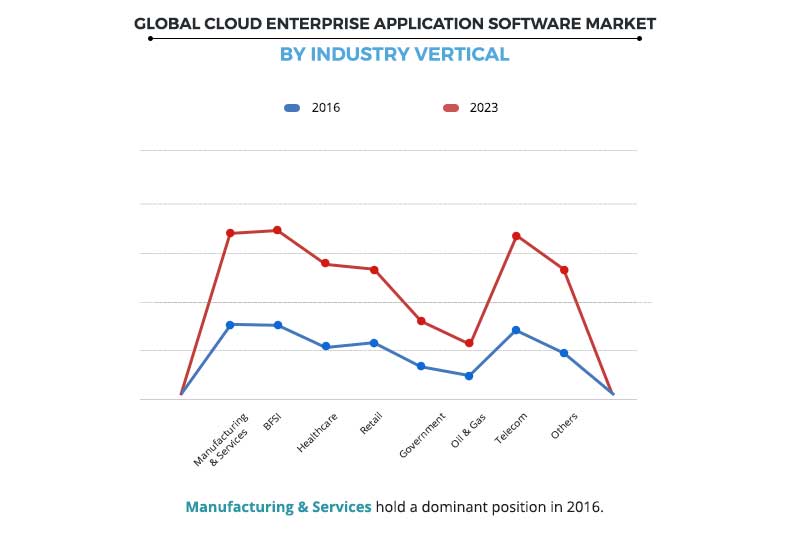
Manufacturing & services is the largest consumer of cloud enterprise application software products, followed by BFSI segment. Furthermore, the others (aerospace & defense, travel & hospitality, chemicals, media & entertainment) segment is expected to witness the highest growth rate. As per solutions, others segment contributed highest share of the overall revenue followed by enterprise resource planning (ERP). However, content management system (CMS) segment is expected to register highest CAGR in the cloud enterprise application software market during the forecast period.
The key market players in the global cloud enterprise application software industry have adopted various strategies, such as product launches, partnerships, business expansions, promotional activities, and strategic alliances to increase awareness about newer technologies and increase their presence across various verticals.
Â
Start reading instantly.
This Report and over 66,905+ more Reports, Available with Avenue Library. T&C*.
Enterprise
License/PDF
Library
Membership
*Taxes/Fees, if applicable will be added during checkout. All prices in USD
To ensure high-level data integrity, accurate analysis, and impeccable forecasts
For complete satisfaction
On-demand customization of scope of the report to exactly meet your needs
Targeted market view to provide pertinent information and save time of readers
Get insights on topics that are crucial for your business. Stay abreast of your interest areas.
Get Industry Data AlertsTo ensure high-level data integrity, accurate analysis, and impeccable forecasts
For complete satisfaction
On-demand customization of scope of the report to exactly meet your needs
Targeted market view to provide pertinent information and save time of readers