Report Code: A12118 | Sep 2021 | Pages: 250 | ||
Tables: 168 | Charts: 68 |
|
Pandemic disrupted the entire world and affected many industries.
Get detailed COVID-19 impact analysis on the Cobalt Alloy Powder Market
Request Now !
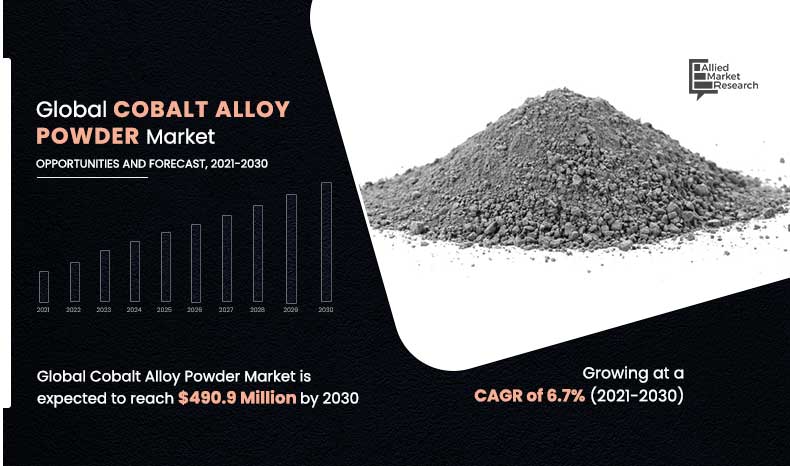
The global cobalt alloy powder market size was valued at $259.1 million in 2020, and cobalt alloy powder market forecast projected to reach $490.9 million by 2030, with global market forecast expected at a CAGR of 6.7% from 2021 to 2030.
Cobalt alloy powder is a type of the powder which is combination of cobalt and other metal elements in a particular ratio to produce high quality parts. The increasing installation of cooling, heating, refrigeration systems in the commercial and industrial sector is one of the major driving factors for the growth of the cobalt alloy powder market. Cobalt alloy powder is also used for fastening of pipe fittings, heat exchangers, radiators, axles, and others. Cobalt alloy powder is also used to join parts of the automotive and bicycle such as frames and rims. The increasing demand for automotive in the commercial and industrial sector is driving the demand for brazing process. The above-mentioned applications will provide ample opportunities for the growth of cobalt alloy powder market during the forecast period. The increasing demand for highly efficient metalworking process among the developing and developed countries is driving the growth of the market. The broad range of materials available when utilizing MIM and increase in awareness among the people and government towards the greenhouse gas emission from the traditional metalworking process is also driving the demand for the growth of the cobalt alloy powder market. It is considered as green technology due to significant reduction in wastage compared to “traditional” manufacturing methods such as 5 axis CNC machining and also does not generate toxic gases such as formaldehyde, chlorinated solvents, and burn off wax, which can lead to greenhouse gas emissions. The above-mentioned application and demand are the major factors fostering the growth of the cobalt alloy powder market.
The high cost of the cobalt raw material for the production of cobalt alloy powder market and the uneven distribution of mineral resources across the globe is one of the restraining factors. The health hazards due to exposure of the cobalt in the mining and manufacturing and the environmental impact of cobalt mining due to release of nitrogen dioxide and carbon dioxide during mining and refining are hampering the development of the market.
The increase in innovation and demand for coating and welding material to manufacture aerospace, automotive, and military products will increase the demand for cobalt alloy powder materials. The increasing demand for EV’s in the modern society and increasing awareness regarding the depletion of material resources across the globe led to the development of green technologies such as 3D printing, cold spraying process will provide ample opportunities for the growth of market.
The global cobalt alloy powder market is segmented on the basis of product, application and region.
On the basis of product, the global cobalt alloy powder market is segmented into Co-Cr alloy powder, Co-Cr-Mo alloy powder, Co-Cr-Ni alloy powder, and others. The application introduced in the study includes additive manufacturing & 3D printing, brazing, metal injection molding, plasma and thermal spray applications, and others.
Region wise, the market is studied across North America, Europe, Asia-Pacific, and LAMEA. Presently, North America accounts for the largest share of the market.
The major companies profiled in this report include Eramet, Freeport Cobalt Americas LLC, Minara Resources Pty Ltd., Mitsui, Norilsk Nickel, Sandvik Materials Technology, Shepherd chemical company, Sherritt International, Sumitomo Corporation, and Umicore- Cobalt & Specialty Materials. Due to rapidly increasing demand for coatings and application of additive manufacturing in the industrial manufacturing led the key manufacturers expand their production capacities in order to meet market demand across the globe. Additional growth strategies such as mergers, acquisition, and business expansion strategies, are also adopted to attain key developments in the cobalt alloy powder market trends.
North America dominates the cobalt alloy powder market. The cobalt alloy powder is used as a coating feedstock to manufacture the industrial tools and parts for the aircraft and the presence of aerospace manufacturing giants in this region will drive the growth of the cobalt alloy powder market. U.S. is estimated to have about 1 million tons of cobalt deposits and most of these resources are in Minnesota. In addition to this other important occurrences are in Alaska, California, Idaho, Michigan, Oregon, and Pennsylvania. In 2019, the total cobalt production in Canada amounted to around 3,336 metric tons during this year. Newfoundland and Labrador produced around 904 metric tons of cobalt in 2019 which is often used as part of batteries, catalyst, and alloys. The increase in the military related investments by the U.S government in the development of air-force and naval forces to protect its huge national interests across the globe which will drive the demand for cobalt alloy powder market. The rapid innovation in automotive and electrical sector will also drive the demand for this market. The increase in the need for heat exchanger and steam based equipment in the Canada is also driving the demand for cobalt alloy powder materials. In addition to this, the presence of aerospace companies in this region and heavy investment by private sectors to develop space resources is also one of the driving factors for the growth of the cobalt alloy powder market.
The Co-Cr alloy powder dominates the cobalt alloy powder market. Cobalt-chrome is a metal alloy powder of cobalt and chromium which is gray powder or solid in other forms. It has a variety of applications as additive in paint and other coating, in solid fuels and cements, as pigments in printing and packaging and dietary supplements in food processing. In addition to this it is also used in the production of industrial tools due to its properties such as heat resistance, wear and corrosion resistance. Its corrosion resistance is better than that of stainless steel and can be applied in the biomedical applications due to its biocompatibility. The increasing demand for biocompatibility in medical sector to manufacture many medical implants is driving the demand for the cobalt alloy powder market. The need for high wear resistance in the automotive, aerospace, and in the production of industrial tools is also major factor driving the growth of the cobalt-chromium alloy powder market. The increase in the awareness among the people towards the health care and the increasing demand for the dental and orthopedic implants is also driving the growth of the market. The above mentioned applications and innovations in the transportation will provide ample opportunities for the growth of cobalt alloy powder market.
The additive manufacturing & 3D printing dominates the Cobalt alloy powder market due to the wide range of applications in the aerospace, automotive, biomedical devices, dental, consumer electronics, and defense industries. It is a process of fabricating objects by building materials by adding layers with the help of 3D modeling software. It is also known as additive manufacturing as the process adds the raw materials instead of subtracting. This process differs from traditional manufacturing techniques such as casting, and molding where materials are subtracted. This process can save material waste and energy, it cost much less for prototyping compared to other ways of manufacturing. The increase in demand for environmental control systems ducting, and custom aircraft interior components, rocket engines and UAV components has fostered the demand for additive manufacturing. The above mentioned applications and the government projects and investment in the field of National Defense will provide ample opportunities for the growth of cobalt alloy powder market.
COVID-19 had a wide range of consequences which has negative impact on most of the industries. The ban transportation sector in order to curb the spread of virus has hampered the supply chain for many industries. The decline in the demand for cobalt alloy powder based products by manufacturing industries due to loss of man power and shut down of industries has negative impact on the development of the market. The increasing awareness among the regarding health issues caused during the mining and production of cobalt alloy powders have certain impact on the future market. The increase in the demand for eco-friendly and their advantages in the daily life among the people will increase the demand for cobalt alloy powder coating market in the future.
Key benefits for stakeholders
Key Market Segments
By Product
By Application
By Region
Cobalt Alloy Powder Market Report Highlights
Aspects | Details |
---|---|
By PRODUCT |
|
By APPLICATION |
|
By Region |
|
Key Market Players | MITSUI CHEMICALS, Minara Resources Pty Ltd., Shepherd chemical company, ERAMET, Umicore- Cobalt & Specialty Materials, Freeport Cobalt Americas LLC, Sumitomo Corporation, Sherritt International, Norilsk Nickel, Sandvik Materials Technology |
CHAPTER 1: INTRODUCTION
1.1. Report description
1.2. Key benefits for stakeholders
1.3. Key market segments
1.4. Research methodology
1.4.1. Secondary research
1.4.2. Primary research
1.5. Analyst tools and models
CHAPTER 2: EXECUTIVE SUMMARY
2.1. Key findings of the study
2.2. CXO perspective
CHAPTER 3: MARKET OVERVIEW
3.1. Market definition and scope
3.2. Key findings
3.2.1. Top investment pockets
3.3. Porter’s five forces analysis
3.4. Market dynamics
3.4.1. Drivers
3.4.1.1. The increase in demand of cobalt in automotive and tooling industry
3.4.1.2. Increasing demand for coating materials in the automotive and the rapid development of 3D printing
3.4.2. Restraint
3.4.2.1. Exposure to cobalt dust is hazardous to health and environment which restrains the development of market globally
3.4.3. Opportunity
3.4.3.1. Rapid innovation in the variety of process in the manufacturing industry
3.5. Pricing analysis
3.6. Value chain analysis
3.7. Impact of key regulations on the global cobalt alloy powder market
3.8. Impact of COVID-19 on the global cobalt alloy powder market
CHAPTER 4: COBALT ALLOY POWDER MARKET, BY PRODUCT
4.1. Overview
4.1.1. Market size and forecast
4.2. CoCr alloy powder
4.2.1. Key market trends, growth factors, and opportunities
4.2.2. Market size and forecast, by region
4.2.3. Comparative share analysis, by country
4.3. CoCrMo alloy powder
4.3.1. Key market trends, growth factors, and opportunities
4.3.2. Market size and forecast, by region
4.3.3. Comparative share analysis, by country
4.4. CoCrNi alloy powder
4.4.1. Key market trends, growth factors, and opportunities
4.4.2. Market size and forecast, by region
4.4.3. Comparative share analysis, by country
4.5. Others
4.5.1. Key market trends, growth factors, and opportunities
4.5.2. Market size and forecast, by region
4.5.3. Comparative share analysis, by country
CHAPTER 5: COBALT ALLOY POWDER MARKET, BY APPLICATION
5.1. Overview
5.1.1. Market size and forecast
5.2. Additive manufacturing and 3D printing
5.2.1. Key market trends, growth factors, and opportunities
5.2.2. Market size and forecast, by region
5.2.3. Comparative share analysis, by country
5.3. Metal injection molding
5.3.1. Key market trends, growth factors, and opportunities
5.3.2. Market size and forecast, by region
5.3.3. Comparative share analysis, by country
5.4. Plasma and thermal spray applications
5.4.1. Key market trends, growth factors, and opportunities
5.4.2. Market size and forecast, by region
5.4.3. Comparative share analysis, by country
5.5. Brazing
5.5.1. Key market trends, growth factors, and opportunities
5.5.2. Market size and forecast, by region
5.5.3. Comparative share analysis, by country
CHAPTER 6: COBALT ALLOY POWDER MARKET, BY REGION
6.1. Overview
6.1.1. Market size and forecast, by region
6.2. North America
6.2.1. Key market trends, growth factors, and opportunities
6.2.2. Market size and forecast, by product
6.2.3. Market size and forecast, by application
6.2.4. Market analysis, by country
6.2.5. U.S.
6.2.5.1. Market size and forecast, by product
6.2.5.2. Market size and forecast, by application
6.2.6. Canada
6.2.6.1. Market size and forecast, by product
6.2.6.2. Market size and forecast, by application
6.2.7. Mexico
6.2.7.1. Market size and forecast, by product
6.2.7.2. Market size and forecast, by application
6.3. Europe
6.3.1. Key market trends, growth factors, and opportunities
6.3.2. Market size and forecast, by product
6.3.3. Market size and forecast, by application
6.3.4. Market analysis, by country
6.3.5. UK
6.3.5.1. Market size and forecast, by product
6.3.5.2. Market size and forecast, by application
6.3.6. Germany
6.3.6.1. Market size and forecast, by product
6.3.6.2. Market size and forecast, by application
6.3.7. France
6.3.7.1. Market size and forecast, by product
6.3.7.2. Market size and forecast, by application
6.3.8. Spain
6.3.8.1. Market size and forecast, by product
6.3.8.2. Market size and forecast, by application
6.3.9. Italy
6.3.9.1. Market size and forecast, by product
6.3.9.2. Market size and forecast, by application
6.3.10. Rest of Europe
6.3.10.1. Market size and forecast, by product
6.3.10.2. Market size and forecast, by application
6.4. Asia-Pacific
6.4.1. Key market trends, growth factors, and opportunities
6.4.2. Market size and forecast, by product
6.4.3. Market size and forecast, by application
6.4.4. Market analysis, by country
6.4.5. China
6.4.5.1. Market size and forecast, by product
6.4.5.2. Market size and forecast, by application
6.4.6. Japan
6.4.6.1. Market size and forecast, by product
6.4.6.2. Market size and forecast, by application
6.4.7. India
6.4.7.1. Market size and forecast, by product
6.4.7.2. Market size and forecast, by application
6.4.8. South Korea
6.4.8.1. Market size and forecast, by product
6.4.8.2. Market size and forecast, by application
6.4.9. Rest of Asia-Pacific
6.4.9.1. Market size and forecast, by product
6.4.9.2. Market size and forecast, by application
6.5. LAMEA
6.5.1. Key market trends, growth factors, and opportunities
6.5.2. Market size and forecast, by product
6.5.3. Market size and forecast, by application
6.5.4. Market analysis, by country
6.5.5. Brazil
6.5.5.1. Market size and forecast, by product
6.5.5.2. Market size and forecast, by application
6.5.6. Saudi Arabia
6.5.6.1. Market size and forecast, by product
6.5.6.2. Market size and forecast, by application
6.5.7. South Africa
6.5.7.1. Market size and forecast, by product
6.5.7.2. Market size and forecast, by application
6.5.8. Rest of LAMEA
6.5.8.1. Market size and forecast, by product
6.5.8.2. Market size and forecast, by application
CHAPTER 7: COMPETITIVE LANDSCAPE
7.1. Introduction
7.1.1. Market player positioning, 2020
7.2. Top winning strategies
7.2.1. Top winning strategies, by year
7.2.2. Top winning strategies, by development
7.2.3. Top winning strategies, by company
7.3. Product mapping of top 10 player
7.4. Competitive dashboard
7.5. Competitive heatmap
7.6. Key developments
7.6.1. Other developments
CHAPTER 8: COMPANY PROFILES
8.1. ERAMET
8.1.1. Company overview
8.1.2. Key executives
8.1.3. Company snapshot
8.1.4. Operating business segments
8.1.5. Product portfolio
8.1.6. Business performance
8.1.7. Key strategic moves and developments
8.2. Freeport Cobalt Americas LLC
8.2.1. Company overview
8.2.2. Key executives
8.2.3. Company snapshot
8.2.4. Product portfolio
8.3. Minara Resources Pty Ltd.
8.3.1. Company overview
8.3.2. Key executives
8.3.3. Company snapshot
8.3.4. Product portfolio
8.4. MITSUI CHEMICALS
8.4.1. Company overview
8.4.2. Key executives
8.4.3. Company snapshot
8.4.4. Operating business segments
8.4.5. Product portfolio
8.4.6. R&D expenditure
8.4.7. Business performance
8.5. Norilsk Nickel
8.5.1. Company overview
8.5.2. Key executives
8.5.3. Company snapshot
8.5.4. Operating business segments
8.5.5. Product portfolio
8.5.6. Business performance
8.6. Sandvik Materials Technology
8.6.1. Company overview
8.6.2. Key executives
8.6.3. Company snapshot
8.6.4. Operating business segments
8.6.5. Product portfolio
8.6.6. R&D expenditure
8.6.7. Business performance
8.6.8. Key strategic moves and developments
8.7. Shepherd chemical company
8.7.1. Company overview
8.7.2. Key executives
8.7.3. Company snapshot
8.7.4. Product portfolio
8.7.5. Key strategic moves and developments
8.8. Sherritt International
8.8.1. Company overview
8.8.2. Key executives
8.8.3. Company snapshot
8.8.4. Operating business segments
8.8.5. Product portfolio
8.8.6. Business performance
8.9. Sumitomo Corporation
8.9.1. Company overview
8.9.2. Key executives
8.9.3. Company snapshot
8.9.4. Operating business segments
8.9.5. Product portfolio
8.9.6. Business performance
8.10. Umicore- Cobalt & Specialty Materials
8.10.1. Company overview
8.10.2. Key executives
8.10.3. Company snapshot
8.10.4. Operating business segments
8.10.5. Product portfolio
8.10.6. R&D expenditure
8.10.7. Business performance
8.10.8. Key strategic moves and developments
LIST OF TABLES
TABLE 01. PRICING ANALYSIS, BY PRODUCT, 2020–2030 ($/TONS)
TABLE 02. PRICING ANALYSIS, BY REGION, 2020–2030 ($/TONS)
TABLE 03. COBALT ALLOY POWDER MARKET, BY PRODUCT, 2020–2030 (TONS)
TABLE 04. COBALT ALLOY POWDER MARKET, BY PRODUCT, 2020–2030 ($MILLION)
TABLE 05. COBALT ALLOY POWDER MARKET FOR COCR ALLOY POWDER, BY REGION, 2020–2030 (TONS)
TABLE 06. COBALT ALLOY POWDER MARKET FOR COCR ALLOY POWDER, BY REGION, 2020–2030 ($MILLION)
TABLE 07. COBALT ALLOY POWDER MARKET FOR COCRMO ALLOY POWDER, BY REGION, 2020–2030 (TONS)
TABLE 08. COBALT ALLOY POWDER MARKET FOR COCRMO ALLOY POWDER, BY REGION, 2020–2030 ($MILLION)
TABLE 09. COBALT ALLOY POWDER MARKET FOR COCRNI ALLOY POWDER, BY REGION, 2020–2030 (TONS)
TABLE 10. COBALT ALLOY POWDER MARKET FOR COCRNI ALLOY POWDER, BY REGION, 2020–2030 ($MILLION)
TABLE 11. COBALT ALLOY POWDER MARKET FOR OTHERS, BY REGION, 2020–2030 (TONS)
TABLE 12. COBALT ALLOY POWDER MARKET FOR OTHERS, BY REGION, 2020–2030 ($MILLION)
TABLE 13. COBALT ALLOY POWDER MARKET, BY APPLICATION, 2020–2030 (TONS)
TABLE 14. COBALT ALLOY POWDER MARKET, BY APPLICATION, 2020–2030 ($MILLION)
TABLE 15. COBALT ALLOY POWDER MARKET FOR ADDITIVE MANUFACTURING AND 3D PRINTING, BY REGION, 2020–2030 (TONS)
TABLE 16. COBALT ALLOY POWDER MARKET FOR ADDITIVE MANUFACTURING AND 3D PRINTING, BY REGION, 2020–2030 ($MILLION)
TABLE 17. COBALT ALLOY POWDER MARKET FOR METAL INJECTION MOLDING, BY REGION, 2020–2030 (TONS)
TABLE 18. COBALT ALLOY POWDER MARKET FOR METAL INJECTION MOLDING, BY REGION, 2020–2030 ($MILLION)
TABLE 19. COBALT ALLOY POWDER MARKET FOR PLASMA AND THERMAL SPRAY APPLICATIONS, BY REGION, 2020–2030 (TONS)
TABLE 20. COBALT ALLOY POWDER MARKET FOR PLASMA AND THERMAL SPRAY APPLICATIONS, BY REGION, 2020–2030 ($MILLION)
TABLE 21. COBALT ALLOY POWDER MARKET FOR BRAZING, BY REGION, 2020–2030 (TONS)
TABLE 22. COBALT ALLOY POWDER MARKET FOR BRAZING, BY REGION, 2020–2030 ($MILLION)
TABLE 23. COBALT ALLOY POWDER MARKET, BY REGION, 2020-2030 (TONS)
TABLE 24. COBALT ALLOY POWDER MARKET, BY REGION, 2020-2030 ($MILLION)
TABLE 25. NORTH AMERICA COBALT ALLOY POWDER MARKET, BY PRODUCT, 2020-2030 (TONS)
TABLE 26. NORTH AMERICA COBALT ALLOY POWDER MARKET, BY PRODUCT, 2020-2030 ($MILLION)
TABLE 27. NORTH AMERICA COBALT ALLOY POWDER MARKET, BY APPLICATION, 2020-2030 (TONS)
TABLE 28. NORTH AMERICA COBALT ALLOY POWDER MARKET, BY APPLICATION, 2020-2030 ($MILLION)
TABLE 29. NORTH AMERICA COBALT ALLOY POWDER MARKET, BY COUNTRY, 2020-2030 (TONS)
TABLE 30. NORTH AMERICA COBALT ALLOY POWDER MARKET, BY COUNTRY, 2020-2030 ($MILLION)
TABLE 31. U.S. COBALT ALLOY POWDER MARKET, BY PRODUCT, 2020-2030 (TONS)
TABLE 32. U.S. COBALT ALLOY POWDER MARKET, BY PRODUCT, 2020-2030 ($MILLION)
TABLE 33. U.S. COBALT ALLOY POWDER MARKET, BY APPLICATION, 2020-2030 (TONS)
TABLE 34. U.S. COBALT ALLOY POWDER MARKET, BY APPLICATION, 2020-2030 ($MILLION)
TABLE 35. CANADA COBALT ALLOY POWDER MARKET, BY PRODUCT, 2020-2030 (TONS)
TABLE 36. CANADA COBALT ALLOY POWDER MARKET, BY PRODUCT, 2020-2030 ($MILLION)
TABLE 37. CANADA COBALT ALLOY POWDER MARKET, BY APPLICATION, 2020-2030 (TONS)
TABLE 38. CANADA COBALT ALLOY POWDER MARKET, BY APPLICATION, 2020-2030 ($MILLION)
TABLE 39. MEXICO COBALT ALLOY POWDER MARKET, BY PRODUCT, 2020-2030 (TONS)
TABLE 40. MEXICO COBALT ALLOY POWDER MARKET, BY PRODUCT, 2020-2030 ($MILLION)
TABLE 41. MEXICO COBALT ALLOY POWDER MARKET, BY APPLICATION, 2020-2030 (TONS)
TABLE 42. MEXICO COBALT ALLOY POWDER MARKET, BY APPLICATION, 2020-2030 ($MILLION)
TABLE 43. EUROPE COBALT ALLOY POWDER MARKET, BY PRODUCT, 2020-2030 (TONS)
TABLE 44. EUROPE COBALT ALLOY POWDER MARKET, BY PRODUCT, 2020-2030 ($MILLION)
TABLE 45. EUROPE COBALT ALLOY POWDER MARKET, BY APPLICATION, 2020-2030 (TONS)
TABLE 46. EUROPE COBALT ALLOY POWDER MARKET, BY APPLICATION, 2020-2030 ($MILLION)
TABLE 47. EUROPE COBALT ALLOY POWDER MARKET, BY COUNTRY, 2020-2030 (TONS)
TABLE 48. EUROPE COBALT ALLOY POWDER MARKET, BY COUNTRY, 2020-2030 ($MILLION)
TABLE 49. UK COBALT ALLOY POWDER MARKET, BY PRODUCT, 2020-2030 (TONS)
TABLE 50. UK COBALT ALLOY POWDER MARKET, BY PRODUCT, 2020-2030 ($MILLION)
TABLE 51. UK COBALT ALLOY POWDER MARKET, BY APPLICATION, 2020-2030 (TONS)
TABLE 52. UK COBALT ALLOY POWDER MARKET, BY APPLICATION, 2020-2030 ($MILLION)
TABLE 53. GERMANY COBALT ALLOY POWDER MARKET, BY PRODUCT, 2020-2030 (TONS)
TABLE 54. GERMANY COBALT ALLOY POWDER MARKET, BY PRODUCT, 2020-2030 ($MILLION)
TABLE 55. GERMANY COBALT ALLOY POWDER MARKET, BY APPLICATION, 2020-2030 (TONS)
TABLE 56. GERMANY COBALT ALLOY POWDER MARKET, BY APPLICATION, 2020-2030 ($MILLION)
TABLE 57. FRANCE COBALT ALLOY POWDER MARKET, BY PRODUCT, 2020-2030 (TONS)
TABLE 58. FRANCE COBALT ALLOY POWDER MARKET, BY PRODUCT, 2020-2030 ($MILLION)
TABLE 59. FRANCE COBALT ALLOY POWDER MARKET, BY APPLICATION, 2020-2030 (TONS)
TABLE 60. FRANCE COBALT ALLOY POWDER MARKET, BY APPLICATION, 2020-2030 ($MILLION)
TABLE 61. SPAIN COBALT ALLOY POWDER MARKET, BY PRODUCT, 2020-2030 (TONS)
TABLE 62. SPAIN COBALT ALLOY POWDER MARKET, BY PRODUCT, 2020-2030 ($MILLION)
TABLE 63. SPAIN COBALT ALLOY POWDER MARKET, BY APPLICATION, 2020-2030 (TONS)
TABLE 64. SPAIN COBALT ALLOY POWDER MARKET, BY APPLICATION, 2020-2030 ($MILLION)
TABLE 65. ITALY COBALT ALLOY POWDER MARKET, BY PRODUCT, 2020-2030 (TONS)
TABLE 66. ITALY COBALT ALLOY POWDER MARKET, BY PRODUCT, 2020-2030 ($MILLION)
TABLE 67. ITALY COBALT ALLOY POWDER MARKET, BY APPLICATION, 2020-2030 (TONS)
TABLE 68. ITALY COBALT ALLOY POWDER MARKET, BY APPLICATION, 2020-2030 ($MILLION)
TABLE 69. REST OF EUROPE COBALT ALLOY POWDER MARKET, BY PRODUCT, 2020-2030 (TONS)
TABLE 70. REST OF EUROPE COBALT ALLOY POWDER MARKET, BY PRODUCT, 2020-2030 ($MILLION)
TABLE 71. REST OF EUROPE COBALT ALLOY POWDER MARKET, BY APPLICATION, 2020-2030 (TONS)
TABLE 72. REST OF EUROPE COBALT ALLOY POWDER MARKET, BY APPLICATION, 2020-2030 ($MILLION)
TABLE 73. ASIA-PACIFIC COBALT ALLOY POWDER MARKET, BY PRODUCT, 2020-2030 (TONS)
TABLE 74. ASIA-PACIFIC COBALT ALLOY POWDER MARKET, BY PRODUCT, 2020-2030 ($MILLION)
TABLE 75. ASIA-PACIFIC COBALT ALLOY POWDER MARKET, BY APPLICATION, 2020-2030 (TONS)
TABLE 76. ASIA-PACIFIC COBALT ALLOY POWDER MARKET, BY APPLICATION, 2020-2030 ($MILLION)
TABLE 77. ASIA-PACIFIC COBALT ALLOY POWDER MARKET, BY COUNTRY, 2020-2030 (TONS)
TABLE 78. ASIA-PACIFIC COBALT ALLOY POWDER MARKET, BY COUNTRY, 2020-2030 ($MILLION)
TABLE 79. CHINA COBALT ALLOY POWDER MARKET, BY PRODUCT, 2020-2030 (TONS)
TABLE 80. CHINA COBALT ALLOY POWDER MARKET, BY PRODUCT, 2020-2030 ($MILLION)
TABLE 81. CHINA COBALT ALLOY POWDER MARKET, BY APPLICATION, 2020-2030 (TONS)
TABLE 82. CHINA COBALT ALLOY POWDER MARKET, BY APPLICATION, 2020-2030 ($MILLION)
TABLE 83. JAPAN COBALT ALLOY POWDER MARKET, BY PRODUCT, 2020-2030 (TONS)
TABLE 84. JAPAN COBALT ALLOY POWDER MARKET, BY PRODUCT, 2020-2030 ($MILLION)
TABLE 85. JAPAN COBALT ALLOY POWDER MARKET, BY APPLICATION, 2020-2030 (TONS)
TABLE 86. JAPAN COBALT ALLOY POWDER MARKET, BY APPLICATION, 2020-2030 ($MILLION)
TABLE 87. INDIA COBALT ALLOY POWDER MARKET, BY PRODUCT, 2020-2030 (TONS)
TABLE 88. INDIA COBALT ALLOY POWDER MARKET, BY PRODUCT, 2020-2030 ($MILLION)
TABLE 89. INDIA COBALT ALLOY POWDER MARKET, BY APPLICATION, 2020-2030 (TONS)
TABLE 90. INDIA COBALT ALLOY POWDER MARKET, BY APPLICATION, 2020-2030 ($MILLION)
TABLE 91. SOUTH KOREA COBALT ALLOY POWDER MARKET, BY PRODUCT, 2020-2030 (TONS)
TABLE 92. SOUTH KOREA COBALT ALLOY POWDER MARKET, BY PRODUCT, 2020-2030 ($MILLION)
TABLE 93. SOUTH KOREA COBALT ALLOY POWDER MARKET, BY APPLICATION, 2020-2030 (TONS)
TABLE 94. SOUTH KOREA COBALT ALLOY POWDER MARKET, BY APPLICATION, 2020-2030 ($MILLION)
TABLE 95. REST OF ASIA-PACIFIC COBALT ALLOY POWDER MARKET, BY PRODUCT, 2020-2030 (TONS)
TABLE 96. REST OF ASIA-PACIFIC COBALT ALLOY POWDER MARKET, BY PRODUCT, 2020-2030 ($MILLION)
TABLE 97. REST OF ASIA-PACIFIC COBALT ALLOY POWDER MARKET, BY APPLICATION, 2020-2030 (TONS)
TABLE 98. REST OF ASIA-PACIFIC COBALT ALLOY POWDER MARKET, BY APPLICATION, 2020-2030 ($MILLION)
TABLE 99. LAMEA COBALT ALLOY POWDER MARKET, BY PRODUCT, 2020-2030 (TONS)
TABLE 100. LAMEA COBALT ALLOY POWDER MARKET, BY PRODUCT, 2020-2030 ($MILLION)
TABLE 101. LAMEA COBALT ALLOY POWDER MARKET, BY APPLICATION, 2020-2030 (TONS)
TABLE 102. LAMEA COBALT ALLOY POWDER MARKET, BY APPLICATION, 2020-2030 ($MILLION)
TABLE 103. LAMEA COBALT ALLOY POWDER MARKET, BY COUNTRY, 2020-2030 (TONS)
TABLE 104. LAMEA COBALT ALLOY POWDER MARKET, BY COUNTRY, 2020-2030 ($MILLION)
TABLE 105. BRAZIL COBALT ALLOY POWDER MARKET, BY PRODUCT, 2020-2030 (TONS)
TABLE 106. BRAZIL COBALT ALLOY POWDER MARKET, BY PRODUCT, 2020-2030 ($MILLION)
TABLE 107. BRAZIL COBALT ALLOY POWDER MARKET, BY APPLICATION, 2020-2030 (TONS)
TABLE 108. BRAZIL COBALT ALLOY POWDER MARKET, BY APPLICATION, 2020-2030 ($MILLION)
TABLE 109. SAUDI ARABIA COBALT ALLOY POWDER MARKET, BY PRODUCT, 2020-2030 (TONS)
TABLE 110. SAUDI ARABIA COBALT ALLOY POWDER MARKET, BY PRODUCT, 2020-2030 ($MILLION)
TABLE 111. SAUDI ARABIA COBALT ALLOY POWDER MARKET, BY APPLICATION, 2020-2030 (TONS)
TABLE 112. SAUDI ARABIA COBALT ALLOY POWDER MARKET, BY APPLICATION, 2020-2030 ($MILLION)
TABLE 113. SOUTH AFRICA COBALT ALLOY POWDER MARKET, BY PRODUCT, 2020-2030 (TONS)
TABLE 114. SOUTH AFRICA COBALT ALLOY POWDER MARKET, BY PRODUCT, 2020-2030 ($MILLION)
TABLE 115. SOUTH AFRICA COBALT ALLOY POWDER MARKET, BY APPLICATION, 2020-2030 (TONS)
TABLE 116. SOUTH AFRICA COBALT ALLOY POWDER MARKET, BY APPLICATION, 2020-2030 ($MILLION)
TABLE 117. REST OF LAMEA COBALT ALLOY POWDER MARKET, BY PRODUCT, 2020-2030 (TONS)
TABLE 118. REST OF LAMEA COBALT ALLOY POWDER MARKET, BY PRODUCT, 2020-2030 ($MILLION)
TABLE 119. REST OF LAMEA COBALT ALLOY POWDER MARKET, BY APPLICATION, 2020-2030 (TONS)
TABLE 120. REST OF LAMEA COBALT ALLOY POWDER MARKET, BY APPLICATION, 2020-2030 ($MILLION)
TABLE 121. OTHER KEY DEVELOPMENTS (2020-2021)
TABLE 122. ERAMET: KEY EXECUTIVES
TABLE 123. ERAMET: COMPANY SNAPSHOT
TABLE 124. ERAMET: OPERATING SEGMENTS
TABLE 125. ERAMET: PRODUCT PORTFOLIO
TABLE 126. ERAMET: NET SALES, 2018–2020 ($MILLION)
TABLE 127. FREEPORT COBALT AMERICAS LLC: KEY EXECUTIVES
TABLE 128. FREEPORT COBALT AMERICAS LLC: COMPANY SNAPSHOT
TABLE 129. FREEPORT COBALT AMERICAS LLC: PRODUCT PORTFOLIO
TABLE 130. MINARA RESOURCES PTY LTD: KEY EXECUTIVES
TABLE 131. MINARA RESOURCES PTY LTD: COMPANY SNAPSHOT
TABLE 132. MINARA RESOURCES PTY LTD: PRODUCT PORTFOLIO
TABLE 133. MITSUI CHEMICALS: KEY EXECUTIVES
TABLE 134. MITSUI CHEMICALS: COMPANY SNAPSHOT
TABLE 135. MITSUI CHEMICALS: OPERATING SEGMENTS
TABLE 136. MITSUI CHEMICALS: PRODUCT PORTFOLIO
TABLE 137. MITSUI CHEMICALS: R&D EXPENDITURE, 2018–2020 ($MILLION)
TABLE 138. MITSUI CHEMICALS: NET SALES, 2017–2019 ($MILLION)
TABLE 139. NORILSK NICKEL: KEY EXECUTIVES
TABLE 140. NORILSK NICKEL: COMPANY SNAPSHOT
TABLE 141. NORILSK NICKEL: OPERATING SEGMENTS
TABLE 142. NORILSK NICKEL: PRODUCT PORTFOLIO
TABLE 143. NORILSK NICKEL: NET SALES, 2018–2020 ($MILLION)
TABLE 144. SANDVIK MATERIALS TECHNOLOGY: KEY EXECUTIVES
TABLE 145. SANDVIK MATERIALS TECHNOLOGY: COMPANY SNAPSHOT
TABLE 146. SANDVIK MATERIALS TECHNOLOGY: OPERATING SEGMENTS
TABLE 147. SANDVIK MATERIALS TECHNOLOGY: PRODUCT PORTFOLIO
TABLE 148. SANDVIK MATERIALS TECHNOLOGY: R&D EXPENDITURE, 2018–2020 ($MILLION)
TABLE 149. SANDVIK MATERIALS TECHNOLOGY: NET SALES, 2018–2020 ($MILLION)
TABLE 150. SHEPHERD CHEMICAL COMPANY: KEY EXECUTIVES
TABLE 151. SHEPHERD CHEMICAL COMPANY: COMPANY SNAPSHOT
TABLE 152. SHEPHERD CHEMICAL COMPANY: PRODUCT PORTFOLIO
TABLE 153. SHERRITT INTERNATIONAL: KEY EXECUTIVES
TABLE 154. SHERRITT INTERNATIONAL: COMPANY SNAPSHOT
TABLE 155. SHERRITT INTERNATIONAL: OPERATING SEGMENTS
TABLE 156. SHERRITT INTERNATIONAL: PRODUCT PORTFOLIO
TABLE 157. SHERRITT INTERNATIONAL: NET SALES, 2018–2020 ($MILLION)
TABLE 158. SUMITOMO CORPORATION.: KEY EXECUTIVES
TABLE 159. SUMITOMO CORPORATION.: COMPANY SNAPSHOT
TABLE 160. SUMITOMO CORPORATION.: OPERATING SEGMENTS
TABLE 161. SUMITOMO CORPORATION.: PRODUCT PORTFOLIO
TABLE 162. SUMITOMO CORPORATION.: NET SALES, 2018–2020 ($MILLION)
TABLE 163. UMICORE- COBALT & SPECIALTY MATERIALS: KEY EXECUTIVES
TABLE 164. UMICORE- COBALT & SPECIALTY MATERIALS: COMPANY SNAPSHOT
TABLE 165. UMICORE- COBALT & SPECIALTY MATERIALS: OPERATING SEGMENTS
TABLE 166. UMICORE- COBALT & SPECIALTY MATERIALS: PRODUCT PORTFOLIO
TABLE 167. UMICORE- COBALT & SPECIALTY MATERIALS: R&D EXPENDITURE, 2018–2020($MILLION)
TABLE 168. UMICORE- COBALT & SPECIALTY MATERIALS: NET SALES, 2018–2020 ($MILLION)
LIST OF FIGURES
FIGURE 01. GLOBAL COBALT ALLOY POWDER MARKET SNAPSHOT
FIGURE 02. GLOBAL COBALT ALLOY POWDER MARKET SNAPSHOT
FIGURE 03. GLOBAL COBALT ALLOY POWDER MARKET SEGMENTATION
FIGURE 04. TOP INVESTMENT POCKETS
FIGURE 05. BARGAINING POWER OF SUPPLIERS
FIGURE 06. BARGAINING POWER OF BUYERS
FIGURE 07. THREAT OF NEW ENTRANTS
FIGURE 08. THREAT OF SUBSTITUTES
FIGURE 09. COMPETITIVE RIVALRY
FIGURE 10. GLOBAL COBALT ALLOY POWDER MARKET DYNAMICS
FIGURE 11. VALUE CHAIN ANALYSIS
FIGURE 12. COBALT ALLOY POWDER MARKET, BY PRODUCT, 2021–2030 ($MILILION)
FIGURE 13. COMPARATIVE ANALYSIS OF COBALT ALLOY POWDER MARKET FOR COCR ALLOY POWDER, BY COUNTRY, 2021 & 2030 ($MILLION)
FIGURE 14. COMPARATIVE ANALYSIS OF COBALT ALLOY POWDER MARKET FOR COCRMO ALLOY POWDER, BY COUNTRY, 2021 & 2030 ($MILLION)
FIGURE 15. COMPARATIVE ANALYSIS OF COBALT ALLOY POWDER MARKET FOR COCRNI ALLOY POWDER, BY COUNTRY, 2021 & 2030 ($MILLION)
FIGURE 16. COMPARATIVE ANALYSIS OF COBALT ALLOY POWDER MARKET FOR OTHERS, BY COUNTRY, 2021 & 2030 ($MILLION)
FIGURE 17. COBALT ALLOY POWDER MARKET, BY APPLICATION, 2021–2030 ($MILILION)
FIGURE 18. COMPARATIVE ANALYSIS OF COBALT ALLOY POWDER MARKET FOR ADDITIVE MANUFACTURING AND 3D PRINTING, BY COUNTRY, 2021 & 2030 ($MILLION)
FIGURE 19. COMPARATIVE ANALYSIS OF COBALT ALLOY POWDER MARKET FOR METAL INJECTION MOLDING, BY COUNTRY, 2021 & 2030 ($MILLION)
FIGURE 20. COMPARATIVE ANALYSIS OF COBALT ALLOY POWDER MARKET FOR PLASMA AND THERMAL SPRAY APPLICATIONS, BY COUNTRY, 2021 & 2030 ($MILLION)
FIGURE 21. COMPARATIVE ANALYSIS OF COBALT ALLOY POWDER MARKET FOR BRAZING, BY COUNTRY, 2021 & 2030 ($MILLION)
FIGURE 22. U.S. COBALT ALLOY POWDER MARKET REVENUE, 2020–2030 ($MILLION)
FIGURE 23. CANADA COBALT ALLOY POWDER MARKET REVENUE, 2020–2030 ($MILLION)
FIGURE 24. MEXICO COBALT ALLOY POWDER MARKET REVENUE, 2020–2030 ($MILLION)
FIGURE 25. UK COBALT ALLOY POWDER MARKET REVENUE, 2020–2030 ($MILLION)
FIGURE 26. GERMANY COBALT ALLOY POWDER MARKET REVENUE, 2020–2030 ($MILLION)
FIGURE 27. FRANCE COBALT ALLOY POWDER MARKET REVENUE, 2020–2030 ($MILLION)
FIGURE 28. SPAIN COBALT ALLOY POWDER MARKET REVENUE, 2020–2030 ($MILLION)
FIGURE 29. ITALY COBALT ALLOY POWDER MARKET REVENUE, 2020–2030 ($MILLION)
FIGURE 30. REST OF EUROPE COBALT ALLOY POWDER MARKET REVENUE, 2020–2030 ($MILLION)
FIGURE 31. CHINA COBALT ALLOY POWDER MARKET REVENUE, 2020–2030 ($MILLION)
FIGURE 32. JAPAN COBALT ALLOY POWDER MARKET REVENUE, 2020–2030 ($MILLION)
FIGURE 33. INDIA COBALT ALLOY POWDER MARKET REVENUE, 2020–2030 ($MILLION)
FIGURE 34. SOUTH KOREA COBALT ALLOY POWDER MARKET REVENUE, 2020–2030 ($MILLION)
FIGURE 35. REST OF ASIA-PACIFIC COBALT ALLOY POWDER MARKET REVENUE, 2020–2030 ($MILLION)
FIGURE 36. BRAZIL COBALT ALLOY POWDER MARKET REVENUE, 2020–2030 ($MILLION)
FIGURE 37. SAUDI ARABIA COBALT ALLOY POWDER MARKET REVENUE, 2020–2030 ($MILLION)
FIGURE 38. SOUTH AFRICA COBALT ALLOY POWDER MARKET REVENUE, 2020–2030 ($MILLION)
FIGURE 39. REST OF LAMEA COBALT ALLOY POWDER MARKET REVENUE, 2020–2030 ($MILLION)
FIGURE 40. MARKET PLAYER POSITIONING, 2020
FIGURE 41. TOP WINNING STRATEGIES, BY YEAR, 2019–2021
FIGURE 42. TOP WINNING STRATEGIES, BY DEVELOPMENT, 2019–2021 (%)
FIGURE 43. TOP WINNING STRATEGIES, BY COMPANY, 2019–2021
FIGURE 44. PRODUCT MAPPING OF TOP 10 PLAYERS
FIGURE 45. COMPETITIVE DASHBOARD
FIGURE 46. COMPETITIVE HEATMAP OF KEY PLAYERS
FIGURE 47. ERAMET: NET SALES, 2018–2020 ($MILLION)
FIGURE 48. ERAMET: REVENUE SHARE BY SEGMENT, 2020 (%)
FIGURE 49. ERAMET: REVENUE SHARE BY REGION, 2020 (%)
FIGURE 50. MITSUI CHEMICALS: R&D EXPENDITURE, 2018–2020 ($MILLION)
FIGURE 51. MITSUI CHEMICALS: NET SALES, 2018–2020 ($MILLION)
FIGURE 52. MITSUI CHEMICALS: REVENUE SHARE BY SEGMENT, 2020 (%)
FIGURE 53. MITSUI CHEMICALS: REVENUE SHARE BY REGION, 2020 (%)
FIGURE 54. NORILSK NICKEL: NET SALES, 2018–2020 ($MILLION)
FIGURE 55. NORILSK NICKEL: REVENUE SHARE BY SEGMENT, 2020 (%)
FIGURE 56. SANDVIK MATERIALS TECHNOLOGY: R&D EXPENDITURE, 2018–2020 ($MILLION)
FIGURE 57. SANDVIK MATERIALS TECHNOLOGY: NET SALES, 2018–2020 ($MILLION)
FIGURE 58. SANDVIK MATERIALS TECHNOLOGY: REVENUE SHARE BY SEGMENT, 2020 (%)
FIGURE 59. SANDVIK MATERIALS TECHNOLOGY: REVENUE SHARE BY REGION, 2020 (%)
FIGURE 60. SHERRITT INTERNATIONAL: NET SALES, 2018–2020 ($MILLION)
FIGURE 61. SHERRITT INTERNATIONAL: REVENUE SHARE BY SEGMENT, 2020 (%)
FIGURE 62. SHERRITT INTERNATIONAL: REVENUE SHARE BY REGION, 2020 (%)
FIGURE 63. SUMITOMO CORPORATION.: NET SALES, 2018–2020 ($MILLION)
FIGURE 64. SUMITOMO CORPORATION.: REVENUE SHARE BY SEGMENT, 2020 (%)
FIGURE 65. UMICORE- COBALT & SPECIALTY MATERIALS: R&D EXPENDITURE, 2018–2020 ($MILLION)
FIGURE 66. UMICORE- COBALT & SPECIALTY MATERIALS: NET SALES, 2018–2020 ($MILLION)
FIGURE 67. UMICORE- COBALT & SPECIALTY MATERIALS: REVENUE SHARE BY SEGMENT, 2020 (%)
FIGURE 68. UMICORE- COBALT & SPECIALTY MATERIALS: REVENUE SHARE BY REGION, 2020 (%)
The global cobalt alloy powder market is expected to witness increased demand during the forecast period, due to rapid increase in the demand for cobalt alloy powder to produce high-quality long-life products across the globe throughout the forecast period.
Cobalt alloy powder is a type of powder that is a combination of cobalt and other elements in a particular ration to provide respective properties such as corrosion resistance, heat and wear resistance. Cobalt-based alloys are also used in medical sector due to their biocompatibility property. This is one of the reasons for the growth of the cobalt alloy powder market. The rapid innovation in the development of additive manufacturing or 3D printing technology during the past decade and the presence of practical application among the industrial manufacturer is the major driving reason for the growth of the cobalt alloy powder market.
The practical applications and advantages regarding the usage of cobalt alloy powder in the industries to produce the corrosion resistance and heat resistance parts for the gas turbines and in the aircrafts in aerospace industries is another driving factor for the growth of the cobalt alloy powder market. The increase in awareness among the people toward health has increased the demand for health implants, which is a major driving factor for the growth of the cobalt alloy powder market.
The cost of the cobalt alloy powder in 2020 is around $120-$200/kg. The uneven distribution of cobalt producers across the globe is one of the reasons for the high cost, which is expected to hamper the development of cobalt alloy powder market during the forecast period.
Moreover, companies are implementing acquisition, merger, and business expansion strategies to boost the growth of the cobalt alloy powder market throughout the forecast period. The presence of wide variety of applications of cobalt alloy powder in the automotive, aerospace, and military sector will foster the growth of the cobalt alloy powder market.
A. The increase in demand of cobalt in automotive and tooling industry and increasing demand for coating materials in the automotive and the rapid development of 3D printing are the key factors boosting the cobalt alloy powder market growth
A. Market value of cobalt alloy powder in 2030 will be US$ 490.9 million
A. Eramet, Freeport Cobalt Americas LLC, Minara Resources Pty Ltd., Mitsui, Norilsk Nickel, Sandvik Materials Technology, Shepherd chemical company, Sherritt International, Sumitomo Corporation, and Umicore- Cobalt & Specialty Materials
A. Aerospace industry is projected to increase the demand for cobalt alloy powder Market
A. The global cobalt alloy powder market is segmented on the basis of product, application and region. On the basis of product, the global cobalt alloy powder market is segmented into Co-Cr alloy powder, Co-Cr-Mo alloy powder, Co-Cr-Ni alloy powder, and others. The applications introduced in the study includes additive manufacturing & 3D printing, brazing, metal injection molding, plasma and thermal spray applications, and brazing. Region wise, the market is studied across North America, Europe, Asia-Pacific, and LAMEA.
A. Rapid innovation in the variety of process in the manufacturing industry is the main Driver of mosquito-repellent paints Market
A. Additive manufacturing & 3D printing, brazing, metal injection molding, plasma and thermal spray applications, and brazing are the key applications are expected to drive the adoption of cobalt alloy powder
A. Emergence of COVID-19 had a negative impact on the growth of the global cobalt alloy powder market during the pandemic period.
Start reading instantly.
This Report and over 67,068+ more Reports, Available with Avenue Library. T&C*.
Enterprise
License/PDF
Library
Membership
*Taxes/Fees, if applicable will be added during checkout. All prices in USD
To ensure high-level data integrity, accurate analysis, and impeccable forecasts
For complete satisfaction
On-demand customization of scope of the report to exactly meet your needs
Targeted market view to provide pertinent information and save time of readers
Get insights on topics that are crucial for your business. Stay abreast of your interest areas.
Get Industry Data AlertsTo ensure high-level data integrity, accurate analysis, and impeccable forecasts
For complete satisfaction
On-demand customization of scope of the report to exactly meet your needs
Targeted market view to provide pertinent information and save time of readers