Report Code: A02550 | Jul 2022 | Pages: 241 | ||
Tables: 172 | Charts: 46 |
|
The global cobblestone market size was valued at $7.64 billion in 2021 and is projected to reach $12.44 billion by 2031, growing at a CAGR of 5% from 2022 to 2031.
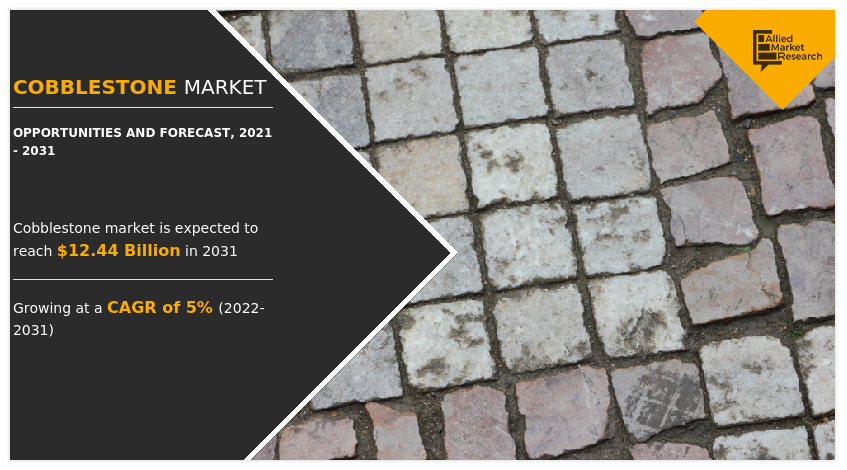
A natural building material called cobblestone is made up of little round stones that are used to pave roads, streets, and structures. These stones are joined together using mortar, a paste. These stones are employed in the construction of cemeteries, churches, schools, industries, smokehouses, stagecoach taverns, businesses, and churches. The use of natural building materials is increasing popularity as the construction industry becomes more sustainable.
The COVID 19 outbreak has affected the growth of natural stones such as the cobblestone market owing to the lockdown measures in the countries and delay in manufacturing and supply of natural stones which are utilized in residential and commercial spaces.
The construction industries in the U.S. and India are anticipated to develop more quickly than those in China, according to the Global Construction Perspectives and Oxford Economics research on Global Construction 2030. By 2030, the number of construction building globally is anticipated to increase by almost 85% by 2030. The greatest consumer of cobblestone and marble is the building and construction sector. The use of these commodities in emerging nations has dramatically increased as a result of rapid urbanization and industrialization. The two countries with the largest exports of these goods are China and India. The majority of the imported granite is processed in China, and the finished goods are then exported to other countries.
Moreover, increase in the construction sector such as residential and non-residential buildings, is expected to drive the cobblestone market. In addition, government investments in renovation and new construction is another factor to drive the cobblestone market growth.
On the basis of type, the natural cobblestone segment generated the largest revenue in 2021, due to increase in consumption of exterior and interior materials in the building and rise in demand from the construction industry. Globally, India is the largest producer of natural stones and has long been leading in granite production and granite exports over the decades. Rise in demand for natural stone such as cobblestone from residential and commercial sectors drives the market growth.
On the basis of construction, the new construction segment accounted for the highest revenue in the global market in 2021 owing to the rise in demand for cobblestones for flooring in commercial buildings, such as shopping centers and big complexes. Cobblestones are available in a variety of textures and colors. Thus, these stones provide an esthetic and appealing look to the buildings.
The novel coronavirus (COVID-19) rapidly spread across various countries and regions in 2019, causing an enormous impact on lives of people and the overall community. It began as a human health condition and has now become a significant threat to global trade, economy, and finance. The COVID-19 pandemic halted production of many products in the cobblestone market, owing to lockdowns. Furthermore, the number of COVID-19 cases is expected to reduce in the future with the introduction of the vaccine for COVID-19 in the market. This has led to the reopening of indoor flooring companies at their full-scale capacities. This is expected to help the market recover by mid of 2022. After COVID-19 infection cases begin to decline, equipment & machinery producers must focus on protecting their staff, operations, and supply networks to respond to urgent emergencies and establish new methods of working.
On the basis of region, Asia-Pacific registered the highest revenue in 2021, owning to a rise in infrastructure activity in the region. Moreover, growing construction activities owing to rapid urbanization & industrialization is estimated to boost the demand for natural stones for flooring, wall cladding, memorial arts, civil works, and others. Government initiatives in China in the expanding construction sector are expected to provide growth opportunities in this country. For instance, in November 2020, the central government of China has set a goal of having 70% of new safe building construction by 2022 according to its own standards. Hence, these investments in the construction sector are expected to increase the demand for cobblestone due to its scratch-resistant, and water-resistant feature, and therefore is expected to surge the market growth.
The cobblestone market is segmented into type, construction type, application, and region. On the basis of type, the market is divided into mechanical pebble, natural cobblestone, riverstone, and other. On the basis of construction type, the market is divided into new construction and renovation. On the basis of application, the market is divided into roading, architecture, and other. Region-wise, the global cobblestone market share analysis is conducted across North America (the U.S., Canada, and Mexico), Europe (UK, France, Germany, Italy, and Rest of Europe), Asia-Pacific (China, Japan, India, South Korea, and Rest of Asia-Pacific), and LAMEA (Latin America, the Middle East, and Africa).
Competition Analysis
The key players that operate in the cobblestone industry are Aaren Stones & Granites Pvt. Ltd, Agarsen Granite & Stones, Ajmera Marbles Industries, Akrolithos, Cosentino, Dakota Granites, Dal-Tile, Environmental Stone Works, Elegant Natural Stones Pvt. Ltd., Granite Setts UK Ltd., Leeca Ltd., Maharaja Stones, Paving International, Precision Countertops, Inc., Style Earth, U.S. Stone Works Inc., and Vangura.
Cobblestone Market Report Highlights
Aspects | Details |
---|---|
By Type |
|
By Construction Type |
|
By Application |
|
By Region |
|
Key Market Players | vangura surfacing products, U.S. Stone Works Inc, Style Earth, Dakota Granites, Ajmera Marbles Industries, Elegant Natural Stones Pvt. Ltd, Leeca Ltd, Dal-Tile, Maharaja Stones, Environmental StoneWorks, Agarsen Granite & Stones, Precision Countertops, Inc, Cosentino, Aaren Stones & Granites Pvt. Ltd, Akrolithos, Paving International, Granite Setts UK Ltd |
CHAPTER 1:INTRODUCTION
1.1.Report description
1.2.Key benefits for stakeholders
1.3.Key market segments
1.4.Research methodology
1.4.1.Primary research
1.4.2.Secondary research
1.4.3.Analyst tools and models
CHAPTER 2:EXECUTIVE SUMMARY
2.1.Key findings of the study
2.2.CXO perspective
CHAPTER 3:MARKET OVERVIEW
3.1.Market definition and scope
3.2.Key findings
3.2.1.Top impacting factors
3.2.2.Top investment pockets
3.3.Porter's five forces analysis
3.4.Value Chain Analysis
3.5.Pestel Analysis
3.6.Market dynamics
3.6.1.Drivers
3.6.1.1.Rapid urbanization in emerging economies
3.6.1.2.Growth in construction sector
3.6.2.Restraints
3.6.2.1.Increase in emphasis toward utilization of artificial materials
3.6.2.2.Fluctuations in foreign currencies
3.6.3.Opportunities
3.6.3.1.Increase in government and private investments in infrastructure sector
3.7.COVID-19 impact analysis
CHAPTER 4:COBBLESTONE MARKET, BY TYPE
4.1.Overview
4.1.1.Market size and forecast, by type
4.2.Mechanical pebble
4.2.1.Key market trends, growth factors, and opportunities
4.2.2.Market size and forecast, by region
4.2.3.Market size and forecast, by country
4.3.Natural cobblestone
4.3.1.Key market trends, growth factors, and opportunities
4.3.2.Market size and forecast, by region
4.3.3.Market size and forecast, by country
4.4.Riverstone
4.4.1.Key market trends, growth factors, and opportunities
4.4.2.Market size and forecast, by region
4.4.3.Market size and forecast, by country
4.5.Others
4.5.1.Key market trends, growth factors, and opportunities
4.5.2.Market size and forecast, by region
4.5.3.Market size and forecast, by country
CHAPTER 5:COBBLESTONE MARKET, BY CONSTRUCTION TYPE
5.1.Overview
5.1.1.Market size and forecast, by construction type
5.2.New construction
5.2.1.Key market trends, growth factors, and opportunities
5.2.2.Market size and forecast, by region
5.2.3.Market size and forecast, by country
5.2.4.Market size and forecast, by end user
5.2.4.1.Market size and forecast, by residential new construction type
5.2.4.2.Market size and forecast, by non-residential new construction type
5.3.Renovation
5.3.1.Key market trends, growth factors, and opportunities
5.3.2.Market size and forecast, by region
5.3.3.Market size and forecast, by country
5.3.4.Market size and forecast, by end user
5.3.4.1.Market size and forecast, by residential renovation type
5.3.4.2.Market size and forecast, by non-residential renovation type
CHAPTER 6:COBBLESTONE MARKET, BY APPLICATION
6.1.Overview
6.1.1.Market size and forecast, by application
6.3.Roading
6.3.1.Key market trends, growth factors, and opportunities
6.3.2.Market size and forecast, by region
6.3.3.Market size and forecast, by country
6.4.Architecture
6.4.1.Key market trends, growth factors, and opportunities
6.4.2.Market size and forecast, by region
6.4.3.Market size and forecast, by country
6.5.Others
6.5.1.Key market trends, growth factors, and opportunities
6.5.2.Market size and forecast, by region
6.5.3.Market size and forecast, by country
CHAPTER 7:COBBLESTONE MARKET, BY REGION
7.1.Market overview
7.1.1.Market size and forecast, by region
7.2.North America
7.2.1.Key market trends, growth factors, and opportunities
7.2.2.North America market size and forecast, by type
7.2.3.North America market size and forecast, by construction type
7.2.4.North America market size and forecast, by application
7.2.5.North America market size and forecast, by country
7.2.5.1.U.S.
7.2.5.1.1.U.S. market size and forecast, By type
7.2.5.1.2.U.S. market size and forecast, by construction type
7.2.5.1.3.U.S. market size and forecast, by application
7.2.5.2.Canada
7.2.5.2.1.Canada market size and forecast, By type
7.2.5.2.2.Canada market size and forecast, by construction type
7.2.5.2.3.Canada market size and forecast, by application
7.2.5.3.Mexico
7.2.5.3.1.Mexico market size and forecast, By type
7.2.5.3.2.Mexico market size and forecast, by construction type
7.2.5.3.3.Mexico market size and forecast, by application
7.3.Europe
7.3.1.Key market trends, growth factors, and opportunities
7.3.2.Europe market size and forecast, by type
7.3.3.Europe market size and forecast, by construction type
7.3.4.Europe market size and forecast, by application
7.3.5.Europe market size and forecast, by country
7.3.5.1.Germany
7.3.5.1.1.Germany market size and forecast, By type
7.3.5.1.2.Germany market size and forecast, by construction type
7.3.5.1.3.Germany market size and forecast, by application
7.3.5.2.France
7.3.5.2.1.France market size and forecast, By type
7.3.5.2.2.France market size and forecast, by construction type
7.3.5.2.3.France market size and forecast, by application
7.3.5.3.UK
7.3.5.3.1.UK market size and forecast, by type
7.3.5.3.2.UK market size and forecast, by construction type
7.3.5.3.3.UK market size and forecast, by application
7.3.5.4.Italy
7.3.5.4.1.Italy market size and forecast, by type
7.3.5.4.2.Italy market size and forecast, by construction type
7.3.5.4.3.Italy market size and forecast, by application
7.3.5.5.Rest of Europe
7.3.5.5.1.Rest of Europe market size and forecast, by type
7.3.5.5.2.Rest of Europe market size and forecast, by construction type
7.3.5.5.3.Rest of Europe market size and forecast, by application
7.4.Asia-Pacific
7.4.1.Key market trends, growth factors, and opportunities
7.4.2.Asia-Pacific market size and forecast, by type
7.4.3.Asia-Pacific market size and forecast, by construction type
7.4.4.Asia-Pacific market size and forecast, by application
7.4.5.Asia-Pacific market size and forecast, by country
7.4.5.1.China
7.4.5.1.1.China market size and forecast, By type
7.4.5.1.2.China market size and forecast, by construction type
7.4.5.1.3.China market size and forecast, by application
7.4.5.2.India
7.4.5.2.1.India market size and forecast, by type
7.4.5.2.2.India market size and forecast, by construction type
7.4.5.2.3.India market size and forecast, by application
7.4.5.3.Japan
7.4.5.3.1.Japan market size and forecast, by type
7.4.5.3.2.Japan market size and forecast, by construction type
7.4.5.3.3.Japan market size and forecast, by application
7.4.5.4.South Korea
7.4.5.4.1.South Korea market size and forecast, by type
7.4.5.4.2.South Korea market size and forecast, by construction type
7.4.5.4.3.South Korea market size and forecast, by application
7.4.5.5.Rest of Asia-Pacific
7.4.5.5.1.Rest of Asia-Pacific market size and forecast, by type
7.4.5.5.2.Rest of Asia-Pacific market size and forecast, by construction type
7.4.5.5.3.Rest of Asia-Pacific market size and forecast, by application
7.5.LAMEA
7.5.1.Key market trends, growth factors, and opportunities
7.5.2.LAMEA market size and forecast, by type
7.5.3.LAMEA market size and forecast, by construction type
7.5.4.LAMEA market size and forecast, by application
7.5.5.LAMEA market size and forecast, by country
7.5.5.1.Latin America
7.5.5.1.1.Latin America market size and forecast, by type
7.5.5.1.2.Latin America market size and forecast, by construction type
7.5.5.1.3.Latin America market size and forecast, by application
7.5.5.2.Middle East
7.5.5.2.1.Middle East market size and forecast, by type
7.5.5.2.2.Middle East market size and forecast, by construction type
7.5.5.2.3.Middle East market size and forecast, by application
7.5.5.3.Africa
7.5.5.3.1.Africa market size and forecast, by type
7.5.5.3.2.Africa market size and forecast, by construction type
7.5.5.3.3.Africa market size and forecast, by application
CHAPTER 8:COMPANY PROFILES
8.1.AAREN STONES & GRANITES PVT. LTD.
8.1.1.Company overview
8.1.2.Key executive
8.1.3.Company snapshot
8.1.4.Product portfolio
8.2.AGARSEN GRANITE & STONES
8.2.1.Company overview
8.2.2.Key executive
8.2.3.Company snapshot
8.2.4.Product portfolio
8.3.AJMERA MARBLES INDUSTRIES
8.3.1.Company overview
8.3.2.Key executive
8.3.3.Company snapshot
8.3.4.Product portfolio
8.4.AKROLITHOS
8.4.1.Company overview
8.4.2.Key executive
8.4.3.Company snapshot
8.4.4.Product portfolio
8.5.COSENTINO
8.5.1.Company overview
8.5.2.Key executive
8.5.3.Company snapshot
8.5.4.Product portfolio
8.5.5.Key strategic moves and developments
8.6.DAKOTA GRANITE
8.6.1.Company overview
8.6.2.Key executive
8.6.3.Company snapshot
8.6.4.Product portfolio
8.7.DALTILE
8.7.1.Company overview
8.7.2.Key executive
8.7.3.Company snapshot
8.7.4.Product portfolio
8.8.ENVIRONMENTAL STONEWORKS
8.8.1.Company overview
8.8.2.Key executive
8.8.3.Company snapshot
8.8.4.Product portfolio
8.9.ELEGANT NATURAL STONES PRIVATE LIMITED.
8.9.1.Company overview
8.9.2.Key executive
8.9.3.Company snapshot
8.9.4.Product portfolio
8.10.GRANITE SETTS UK LTD.
8.10.1.Company overview
8.10.2.Key executive
8.10.3.Company snapshot
8.10.4.Product portfolio
8.11.LEECA LTD.
8.11.1.Company overview
8.11.2.Key executive
8.11.3.Company snapshot
8.11.4.Product portfolio
8.12.MAHARAJA STONE
8.12.1.Company overview
8.12.2.Key executive
8.12.3.Company snapshot
8.12.4.Product portfolio
8.13.PAVING INTERNATIONAL
8.13.1.Company overview
8.13.2.Key executive
8.13.3.Company snapshot
8.13.4.Product portfolio
8.14.PRECISION COUNTERTOPS, INC.
8.14.1.Company overview
8.14.2.Key executive
8.14.3.Company snapshot
8.14.4.Product portfolio
8.15.STYLE EARTH PRRECAST CONCRETE LTD.
8.15.1.Company overview
8.15.2.Key executive
8.15.3.Company snapshot
8.15.4.Product portfolio
CHAPTER 9:KEY INNOVATORS
9.1.U.S. STONEWORKS Inc.
9.1.1.Company overview
9.1.2.Key executive
9.1.3.Company snapshot
9.1.4.Product portfolio
9.1.5.AMR Perspective: U.S. Stoneworks Inc. innovation and its impact on the market
9.2.VANGURA
9.2.1.Company overview
9.2.2.Key executive
9.2.3.Company snapshot
9.2.4.Product portfolio
9.2.5.AMR Perspective: Vangura innovation and its impact on the market
LIST OF TABLES
TABLE 01.COBBLESTONE MARKET REVENUE, BY TYPE, 2021-2031 ($MILLION)
TABLE 02.COBBLESTONE MARKET REVENUE FOR MECHANICAL PEBBLE, BY REGION, 2021-2031 ($MILLION)
TABLE 03.COBBLESTONE MARKET REVENUE FOR NATURAL COBBLESTONE, BY REGION, 2021-2031 ($MILLION)
TABLE 04.COBBLESTONE MARKET REVENUE FOR RIVERSTONE, BY REGION, 2021-2031 ($MILLION)
TABLE 05.COBBLESTONE MARKET FOR OTHERS, BY REGION, 2021-2031 ($MILLION)
TABLE 06.COBBLESTONE MARKET REVENUE, BY CONSTRUCTION TYPE, 2021-2031 ($MILLION)
TABLE 07.COBBLESTONE MARKET FOR NEW CONSTRUCTION, BY REGION, 2021-2031 ($MILLION)
TABLE 08.COBBLESTONE MARKET FOR NEW CONSTRUCTION, BY END USER, 2021-2031 ($MILLION)
TABLE 09.COBBLESTONE MARKET FOR RESIDENTIAL NEW CONSTRUCTION, BY TYPE, 2021-2031 ($MILLION)
TABLE 10.COBBLESTONE MARKET FOR NON-RESIDELTIAL NEW CONSTRUCTION, BY TYPE, 2021-2031 ($MILLION)
TABLE 11.COBBLESTONE MARKET FOR RENOVATION, BY REGION, 2021-2031 ($MILLION)
TABLE 12.COBBLESTONE MARKET FOR RENOVATION, BY END USER, 2021–2031 ($MILLION)
TABLE 13.COBBLESTONE MARKET FOR RESIDENTIAL RENOVATION, BY TYPE, 2021–2031 ($MILLION)
TABLE 14.COBBLESTONE MARKET FOR NON-RESIDENTIAL RENOVATION, BY TYPE, 2021–2031 ($MILLION)
TABLE 15.COBBLESTONE MARKET REVENUE, BY APPLICATION, 2021-2031 ($MILLION)
TABLE 16.COBBLESTONE MARKET REVENUE FOR ROADING, BY REGION, 2021-2031 ($MILLION)
TABLE 17.COBBLESTONE MARKET REVENUE FOR ARCHITECTURE, BY REGION, 2021-2031 ($MILLION)
TABLE 18.COBBLESTONE MARKET FOR OTHERS, BY REGION, 2021-2031 ($MILLION)
TABLE 19.COBBLESTONE MARKET, BY REGION, 2021-2031 ($MILLION)
TABLE 20.NORTH AMERICA COBBLESTONE MARKET, BY TYPE, 2021-2031 ($MILLION)
TABLE 21.NORTH AMERICA COBBLESTONE MARKET, BY CONSTRUCTION TYPE, 2021-2031 ($MILLION)
TABLE 22.NORTH AMERICA COBBLESTONE MARKET, BY APPLICATION, 2021-2031 ($MILLION)
TABLE 23.NORTH AMERICA COBBLESTONE MARKET, BY COUNTRY, 2021-2031 ($MILLION)
TABLE 24.U.S. COBBLESTONE MARKET, BY TYPE, 2021-2031 ($MILLION)
TABLE 25.U.S. COBBLESTONE MARKET, BY CONSTRUCTION TYPE, 2021-2031 ($MILLION)
TABLE 26.U.S. COBBLESTONE MARKET, BY APPLICATION, 2021-2031 ($MILLION)
TABLE 27.CANADA COBBLESTONE MARKET, BY TYPE, 2021-2031 ($MILLION)
TABLE 28.CANADA COBBLESTONE MARKET, BY CONSTRUCTION TYPE, 2021-2031 ($MILLION)
TABLE 29.CANADA COBBLESTONE MARKET, BY APPLICATION, 2021-2031 ($MILLION)
TABLE 30.MEXICO COBBLESTONE MARKET, BY TYPE, 2021-2031 ($MILLION)
TABLE 31.MEXICO COBBLESTONE MARKET, BY CONSTRUCTION TYPE, 2021-2031 ($MILLION)
TABLE 32.MEXICO COBBLESTONE MARKET, BY APPLICATION, 2021-2031 ($MILLION)
TABLE 33.EUROPE COBBLESTONE MARKET, BY TYPE, 2021-2031 ($MILLION)
TABLE 34.EUROPE COBBLESTONE MARKET, BY CONSTRUCTION TYPE, 2021-2031 ($MILLION)
TABLE 35.EUROPE COBBLESTONE MARKET, BY APPLICATION, 2021-2031 ($MILLION)
TABLE 36.EUROPE COBBLESTONE MARKET, BY COUNTRY, 2021-2031 ($MILLION)
TABLE 37.GERMANY COBBLESTONE MARKET, BY TYPE, 2021-2031 ($MILLION)
TABLE 38.GERMANY COBBLESTONE MARKET, BY CONSTRUCTION TYPE, 2021-2031 ($MILLION)
TABLE 39.GEMRNAY COBBLESTONE MARKET, BY APPLICATION, 2021-2031 ($MILLION)
TABLE 40.FRANCE COBBLESTONE MARKET, BY TYPE, 2021-2031 ($MILLION)
TABLE 41.FRNACE COBBLESTONE MARKET, BY CONSTRUCTION TYPE, 2021-2031 ($MILLION)
TABLE 42.FRANCE COBBLESTONE MARKET, BY APPLICATION, 2021-2031 ($MILLION)
TABLE 43.UK COBBLESTONE MARKET, BY TYPE, 2021-2031 ($MILLION)
TABLE 44.UK COBBLESTONE MARKET, BY CONSTRUCTION TYPE, 2021-2031 ($MILLION)
TABLE 45.UK COBBLESTONE MARKET, BY APPLICATION, 2021-2031 ($MILLION)
TABLE 46.ITALY COBBLESTONE MARKET, BY TYPE, 2021-2031 ($MILLION)
TABLE 47.ITALY COBBLESTONE MARKET, BY CONSTRUCTION TYPE, 2021-2031 ($MILLION)
TABLE 48.ITALY COBBLESTONE MARKET, BY APPLICATION, 2021-2031 ($MILLION)
TABLE 49.REST OF EUROPE COBBLESTONE MARKET, BY TYPE, 2021-2031 ($MILLION)
TABLE 50.REST OF EUROPE COBBLESTONE MARKET, BY CONSTRUCTION TYPE, 2021-2031 ($MILLION)
TABLE 51.REST OF EUROPE COBBLESTONE MARKET, BY APPLICATION, 2021-2031 ($MILLION)
TABLE 52.ASIA-PACIFIC COBBLESTONE MARKET, BY TYPE 2021-2031 ($MILLION)
TABLE 53.ASIA-PACIFIC COBBLESTONE MARKET, BY CONSTRUCTION TYPE, 2021-2031 ($MILLION)
TABLE 54.ASIA-PACIFIC COBBLESTONE MARKET, BY APPLICATION, 2021-2031 ($MILLION)
TABLE 55.ASIA-PACIFIC COBBLESTONE MARKET, BY COUNTRY, 2021-2031 ($MILLION)
TABLE 56.CHINA COBBLESTONE MARKET, BY TYPE, 2021-2031 ($MILLION)
TABLE 57.CHINA COBBLESTONE MARKET, BY CONSTRUCTION TYPE, 2021-2031 ($MILLION)
TABLE 58.CHINA COBBLESTONE MARKET, BY APPLICATION, 2021-2031 ($MILLION)
TABLE 59.INDIA COBBLESTONE MARKET, BY TYPE, 2021-2031 ($MILLION)
TABLE 60.INDIA COBBLESTONE MARKET, BY CONSTRUCTION TYPE, 2021-2031 ($MILLION)
TABLE 61.INDIA COBBLESTONE MARKET, BY APPLICATION, 2021-2031 ($MILLION)
TABLE 62.JAPAN COBBLESTONE MARKET, BY TYPE, 2021-2031 ($MILLION)
TABLE 63.JAPAN COBBLESTONE MARKET, BY CONSTRUCTION TYPE, 2021-2031 ($MILLION)
TABLE 64.JAPAN COBBLESTONE MARKET, BY APPLICATION, 2021-2031 ($MILLION)
TABLE 65.SOUTH KOREA COBBLESTONE MARKET, BY TYPE, 2021-2031 ($MILLION)
TABLE 66.SOUTH KOREA COBBLESTONE MARKET, BY CONSTRUCTION TYPE, 2021-2031 ($MILLION)
TABLE 67.SOUTH KOREA COBBLESTONE MARKET, BY APPLICATION, 2021-2031 ($MILLION)
TABLE 68.REST OF ASIA-PACIFIC COBBLESTONE MARKET, BY TYPE, 2021-2031 ($MILLION)
TABLE 69.REST OF ASIA-PACIFIC COBBLESTONE MARKET, BY CONSTRUCTION TYPE, 2021-2031 ($MILLION)
TABLE 70.REST OF ASIA-PACIFIC COBBLESTONE MARKET, BY APPLICATION, 2021-2031 ($MILLION)
TABLE 71.LAMEA COBBLESTONE MARKET, BY TYPE, 2021-2031 ($MILLION)
TABLE 72.LAMEA COBBLESTONE MARKET, BY CONSTRUCTION TYPE, 2021-2031 ($MILLION)
TABLE 73.LAMEA COBBLESTONE MARKET, BY APPLICATION, 2021-2031 ($MILLION)
TABLE 74.LAMEA COBBLESTONE MARKET, BY COUNTRY, 2021-2031 ($MILLION)
TABLE 75.LATIN AMERICA COBBLESTONE MARKET, BY TYPE, 2021-2031 ($MILLION)
TABLE 76.LATIN AMERICA COBBLESTONE MARKET, BY CONSTRUCTION TYPE, 2021-2031 ($MILLION)
TABLE 77.LATIN AMERICA COBBLESTONE MARKET, BY APPLICATION, 2021-2031 ($MILLION)
TABLE 78.MIDDLE EAST COBBLESTONE MARKET, BY TYPE, 2021-2031 ($MILLION)
TABLE 79.MIDDLE EAST COBBLESTONE MARKET, BY CONSTRUCTION TYPE, 2021-2031 ($MILLION)
TABLE 80.MIDDLE EAST COBBLESTONE MARKET, BY APPLICATION, 2021-2031 ($MILLION)
TABLE 81.AFRICA COBBLESTONE MARKET, BY TYPE, 2021-2031 ($MILLION)
TABLE 82.AFRICA COBBLESTONE MARKET, BY CONSTRUCTION TYPE, 2021-2031 ($MILLION)
TABLE 83.AFRICA COBBLESTONE MARKET, BY APPLICATION, 2021-2031 ($MILLION)
TABLE 84.AAREN STONES & GRANITES PVT. LTD.: KEY EXECUTIVE
TABLE 85.AAREN STONES & GRANITES PVT. LTD.: COMPANY SNAPSHOT
TABLE 86.AAREN STONES & GRANITES PVT. LTD.: PRODUCT PORTFOLIO
TABLE 87.AGARSEN GRANITE AND STONES: KEY EXECUTIVE
TABLE 88.AGARSEN GRANITE AND STONES: COMPANY SNAPSHOT
TABLE 89.AGARSEN GRANITE AND STONES: PRODUCT PORTFOLIO
TABLE 90.AJMERA MARBLES INDUSTRIES: KEY EXECUTIVE
TABLE 91.AJMERA MARBLES INDUSTRIES: COMPANY SNAPSHOT
TABLE 92.AJMERA MARBLES INDUSTRIES: PRODUCT PORTFOLIO
TABLE 93.AKROLITHOS: KEY EXECUTIVE
TABLE 94.AKROLITHOS: COMPANY SNAPSHOT
TABLE 95.AKROLITHOS: PRODUCT PORTFOLIO
TABLE 96.COSENTINO GROUP: KEY EXECUTIVE
TABLE 97.COSENTINO GROUP: COMPANY SNAPSHOT
TABLE 98.COSENTINO GROUP: PRODUCT PORTFOLIO
TABLE 99.DAKOTA GRANITE: KEY EXECUTIVE
TABLE 100.DAKOTA GRANITE: COMPANY SNAPSHOT
TABLE 101.DAKOTA GRANITE: PRODUCT PORTFOLIO
TABLE 102.DALTILE: KEY EXECUTIVE
TABLE 103.DALTILE: COMPANY SNAPSHOT
TABLE 104.DALTILE: PRODUCT PORTFOLIO
TABLE 105.ENVIRONMENTAL STONEWORKS: KEY EXECUTIVE
TABLE 106.ENVIRONMENTAL STONEWORKS: COMPANY SNAPSHOT
TABLE 107.ENVIRONMENTAL STONEWORKS: PRODUCT PORTFOLIO
TABLE 108.ELEGANT NATURAL STONES PRIVATE LIMITED: KEY EXECUTIVE
TABLE 109.ELEGANT NATURAL STONES PRIVATE LIMITED: COMPANY SNAPSHOT
TABLE 110.ELEGANT NATURAL STONES PRIVATE LIMITED: PRODUCT PORTFOLIO
TABLE 111.GRANITE SETTS UK: KEY EXECUTIVE
TABLE 112.GRANITE SETTS UK: COMPANY SNAPSHOT
TABLE 113.GRANITE SETTS UK: PRODUCT PORTFOLIO
TABLE 114.LEECA LTD.: KEY EXECUTIVE
TABLE 115.LEECA LTD.: COMPANY SNAPSHOT
TABLE 116.LEECA LTD.: PRODUCT PORTFOLIO
TABLE 117.MAHARAJA STONE: KEY EXECUTIVE
TABLE 118.MAHARAJA STONE: COMPANY SNAPSHOT
TABLE 119.MAHARAJA STONE: PRODUCT PORTFOLIO
TABLE 120.PAVING INTERNATIONAL: KEY EXECUTIVE
TABLE 121.PAVING INTERNATIONAL: COMPANY SNAPSHOT
TABLE 122.PAVING INTERNATIONAL: PRODUCT PORTFOLIO
TABLE 123.PRECISION COUNTERTOPS, INC.: KEY EXECUTIVE
TABLE 124.PRECISION COUNTERTOPS, INC.: COMPANY SNAPSHOT
TABLE 125.PRECISION COUNTERTOPS, INC.: PRODUCT PORTFOLIO
TABLE 126.STYLE EARTH: KEY EXECUTIVE
TABLE 127.STYLE EARTH: COMPANY SNAPSHOT
TABLE 128.STYLE EARTH: PRODUCT PORTFOLIO
TABLE 129.U.S. STONEWORKS INC.: KEY EXECUTIVE
TABLE 130.U.S. STONEWORKS INC.: COMPANY SNAPSHOT
TABLE 131.U.S. STONEWORKS INC.: PRODUCT PORTFOLIO
TABLE 132.VANGURA: KEY EXECUTIVE
TABLE 133.VANGURA: COMPANY SNAPSHOT
TABLE 134.VANGURA: PRODUCT PORTFOLIO
LIST OF FIGURES
FIGURE 01.KEY MARKET SEGMENTS
FIGURE 02.EXECUTIVE SUMMARY
FIGURE 03.REGION SUMMARY
FIGURE 04.TOP IMPACTING FACTORS
FIGURE 05.TOP INVESTMENT POCKETS
FIGURE 06.LOW TO MODERATE BARGAINING POWER OF SUPPLIERS
FIGURE 07.LOW TO MODERATE BARGAINING POWER OF BUYERS
FIGURE 08.MODERATE TO HIGH THREAT OF SUBSTITUTES
FIGURE 09.MODERATE TO HIGH THREAT OF NEW ENTRANTS
FIGURE 10.LOW TO HIGH INTENSITY OF RIVALRY
FIGURE 11.VALUE SHARE ANALYSIS
FIGURE 12.POLITICAL
FIGURE 13.ECONOMIC
FIGURE 14.SOCIO-CULTURE
FIGURE 15.TECHNOLOGICAL
FIGURE 16.ENVIRONMENTAL
FIGURE 17.LEGAL
FIGURE 18.COBBLESTONE MARKET, BY TYPE, 2021-2031 (%)
FIGURE 19.COMAPARATIVE SHARE ANALYSIS OF COBBLESTONE MARKET FOR MECHANICAL PEBBLE, BY COUNTRY, Â 2021-2031 (%)
FIGURE 20.COMPARATIVE SHARE ANALYSIS OF COBBLESTONE MARKET FOR NATURAL COBBLESTONE, BY COUNTRY, Â 2021-2031 (%)
FIGURE 21.COMPARATIVE SHARE ANALYSIS OF COBBLESTONE MARKET FOR RIVERSTONE, BY COUNTRY, 2021-2031 (%)
FIGURE 22.COMPARATIVE SHARE ANALYSIS OF COBBLESTONE MARKET FOR OTHERS, BY COUNTRY, 2021-2031 (%)
FIGURE 23.COBBLESTONE MARKET, BY CONSTRUCTION TYPE, 2021-2031 (%)
FIGURE 24.COMAPARATIVE SHARE ANALYSIS OF COBBLESTONE MARKET FOR NEW CONSTRUCTION, BY COUNTRY, Â 2021-2031 (%)
FIGURE 25.COMPARATIVE SHARE ANALYSIS OF COBBLESTONE MARKET FOR RENOVATION, BY COUNTRY, 2021-2031 (%)
FIGURE 26.COBBLESTONE MARKET, BY CONSTRUCTION TYPE, 2021-2031 (%)
FIGURE 27.COMPARATIVE SHARE ANALYSIS OF COBBLESTONE MARKET FOR ROADING, BY COUNTRY, 2021-2031 (%)
FIGURE 28.COMPARATIVE SHARE ANALYSIS OF COBBLESTONE MARKET FOR ARCHITECTURE, BY COUNTRY, 2021-2031 (%)
FIGURE 29.COMPARATIVE SHARE ANALYSIS OF COBBLESTONE MARKET FOR OTHERS, BY COUNTRY, 2021-2031 (%)
FIGURE 30.COBBLESTONE MARKET, BY REGION, 2021-2031
FIGURE 31.U.S. COBBLESTONE MARKET REVENUE, 2021-2031 ($MILLION)
FIGURE 32.CANADA COBBLESTONE MARKET REVENUE, 2021-2031 ($MILLION)
FIGURE 33.MEXICO COBBLESTONE MARKET REVENUE, 2021-2031 ($MILLION)
FIGURE 34.GERMANY COBBLESTONE MARKET REVENUE, 2021-2031 ($MILLION)
FIGURE 35.FRANCE COBBLESTONE MARKET REVENUE, 2021-2031 ($MILLION)
FIGURE 36.UK COBBLESTONE MARKET REVENUE, 2021-2031 ($MILLION)
FIGURE 37.ITALY COBBLESTONE MARKET REVENUE, 2021-2031 ($MILLION)
FIGURE 38.REST OF EUROPE COBBLESTONE MARKET REVENUE, 2021-2031 ($MILLION)
FIGURE 39.CHINA COBBLESTONE MARKET REVENUE, 2021-2031 ($MILLION)
FIGURE 40.INDIA COBBLESTONE MARKET REVENUE, 2021-2031 ($MILLION)
FIGURE 41.JAPAN COBBLESTONE MARKET REVENUE, 2021-2031 ($MILLION)
FIGURE 42.SOUTH KOREA COBBLESTONE MARKET REVENUE, 2021-2031 ($MILLION)
FIGURE 43.REST OF ASIA-PACIFIC COBBLESTONE MARKET REVENUE, 2021-2031 ($MILLION)
FIGURE 44.LATIN AMERICA COBBLESTONE MARKET REVENUE, 2021-2031 ($MILLION)
FIGURE 45.MIDDLE EAST COBBLESTONE MARKET REVENUE, 2021-2031 ($MILLION)
FIGURE 46.AFRICA COBBLESTONE MARKET REVENUE, 2021-2031 ($MILLION)
The cobblestone market has observed huge demand in North America, Asia-Pacific, and Europe. Asia-Pacific is projected to remain the major revenue generating region of the market in the near future. This growth can be attributed to the rapid expansion of the residential and non-residential construction sectors, mainly across the developing economies, including China, India, Indonesia, South Korea, and others. In addition, rise in consumer purchasing power in these nations is expected to probably fuel the building sector, boosting industrial expansion. The cobblestone market is expected to increase as more people become aware of the advantages of cobblestone slabs, such as greater strength, extended lifespan, and resistance to wear and slipping.
Various market players have adopted strategies, such as product launch, business expansion, acquisition, and agreement to expand its business and strengthen its market position. For instance, in April 2021, Polycor planned to be carbon neutral by end of 2025. It is the first natural stone quarrier to pledge to carbon neutrality and one of the first companies to occupy a leading position in the critical work of decarbonization. As a result, such strategic moves are expected to provide lucrative growth in the global cobblestone market.
A. The Cobblestone Market size was valued at $7,635.2 million in 2021.
A. Based on type, the natural cobblestone holds the maximum market share of the cobblestone market in 2021.
A. The Cobblestone market is projected to reach $12,436.9 million by 2031
A. Rapid urbanization in emerging economies and growth in the construction sector are the upcoming trends in the Cobblestone Market in the world.
A. The roading segment is the leading application of the Cobblestone Market.
A. Asia-Pacific is the largest regional market for Cobblestone Market.
A. Increase in emphasis toward utilization of artificial materials and fluctuation in foreign currencies are the Cobblestone market effecting factors
A. The company profile has been selected on factors such as geographical presence, market dominance (in terms of revenue and volume sales), various strategies and recent developments.
Start reading instantly.
This Report and over 66,983+ more Reports, Available with Avenue Library. T&C*.
Enterprise
License/PDF
Library
Membership
*Taxes/Fees, if applicable will be added during checkout. All prices in USD
To ensure high-level data integrity, accurate analysis, and impeccable forecasts
For complete satisfaction
On-demand customization of scope of the report to exactly meet your needs
Targeted market view to provide pertinent information and save time of readers
Get insights on topics that are crucial for your business. Stay abreast of your interest areas.
Get Industry Data AlertsTo ensure high-level data integrity, accurate analysis, and impeccable forecasts
For complete satisfaction
On-demand customization of scope of the report to exactly meet your needs
Targeted market view to provide pertinent information and save time of readers