
Composite Surface Film Market Research, 2033
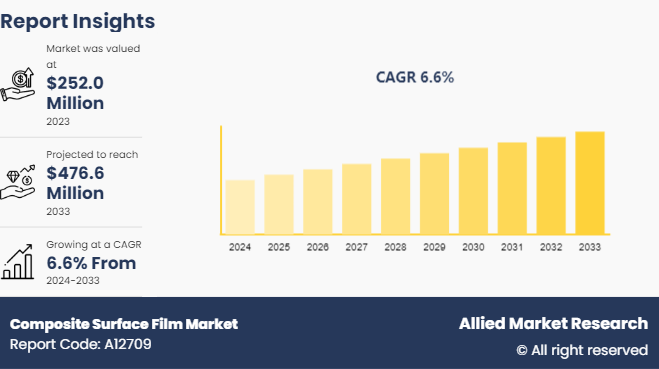
The global composite surface film market was valued at $252.0 million in 2023, and is projected to reach $476.6 million by 2033, growing at a CAGR of 6.6% from 2024 to 2033.
Market Introduction and Definition
Composite surface films are advanced materials engineered to enhance the performance, durability, and aesthetic appeal of various surfaces. Composites surface films are typically composed of a combination of materials such as polymers, metals, and ceramics, which are bonded together to create a unified layer that can be applied to a substrate. The primary purpose of composite surface films is to provide a protective barrier that resists environmental factors such as moisture, UV radiation, chemicals, and physical wear and tear.
The versatility of composite surface films makes them suitable for a wide range of applications across different industries such as electronics and construction. In electronics, they are used to safeguard sensitive components from electromagnetic interference and mechanical damage. In construction, these films are applied to building materials to enhance energy efficiency and resistance to environmental stressors. The development of composite surface films involves advanced manufacturing techniques such as chemical vapor deposition, lamination, and nanotechnology, allowing for precise control over their properties and performance.
Key Takeaways
The composite surface film market study covers 20 countries. The research includes a segment analysis of each country in terms of value ($Million) for the projected period 2023-2033.
More than 1,450 product literatures, industry releases, annual reports, and other such documents of major composite surface film industry participants along with authentic industry journals, trade associations' releases, and government websites have been reviewed for generating high-value industry insights.
The study integrated high-quality data, professional opinions and analysis, and critical independent perspectives. The research approach is intended to provide a balanced view of global markets and to assist stakeholders in making educated decisions to achieve their most ambitious growth objectives.
Key Market Dynamics
Composite surface films are designed to offer superior protection against environmental factors such as corrosion, UV radiation, chemical exposure, and physical abrasion. In the automotive industry, high-performance coatings are crucial for maintaining the aesthetic and structural integrity of vehicles. Composite surface films provide a robust protective layer that shields the car's exterior from scratches, dings, and environmental damage, thereby reducing maintenance costs and enhancing the vehicle's resale value. Moreover, in the aerospace sector, where components are exposed to extreme conditions, these films play a vital role in ensuring safety and reliability by preventing corrosion and wear. All these factors are expected to drive the demand for the composite surface film market during the forecast period.
However, the complexity of composite surface film production necessitates a highly skilled workforce to ensure quality and precision. Training and retaining such a workforce add to the overall production costs. This high-cost structure poses a barrier to entry for new players and limits the ability of existing manufacturers to scale up production. As a result, despite the strong demand for composite surface films, their high manufacturing costs continue to hamper the market's growth potential. All these factors are expected to hamper the growth of the composite surface film market during the forecast period.
In the construction sector, composite surface films are utilized in a range of applications such as bridges, buildings, and tunnels. Their high strength-to-weight ratio allows for innovative designs that withstand heavy loads while reducing overall construction weight. This is particularly advantageous in earthquake-prone regions where structural resilience is important. In addition, composite films offer excellent corrosion resistance that makes them ideal for coastal and offshore infrastructure that is exposed to harsh environmental conditions. All these factors are anticipated to offer new growth opportunities for the composite surface film market during the forecast period.
Number of Automobile Exported From India (in Millions)

In 2023, the number of automobiles exported stabilized at 4.8 million units. This stabilization suggests a normalization of market conditions following the sharp recovery in 2022. While the export volume remained strong, it indicates a balancing of supply and demand dynamics in the global automotive market. The stabilization of automobile exports suggests that the automotive industry has reached a balance between supply and demand. This stable production level would lead to a consistent demand for composite surface films, which are used for various applications, such as vehicle interiors, exteriors, and protective coatings.
Market Segmentation
The composite surface film market is segmented by film structure, end-use industry, and region. Based on film structure, the market is classified flat films and rolls. By end-use industry, the market is divided into automotive, aerospace, consumer electronics, and others. Region-wise, the market is analyzed across North America, Europe, Asia-Pacific, and LAMEA.
Regional Market Outlook
Rapid industrialization and urbanization in Asia-Pacific drives the significant investments in infrastructure projects across sectors such as construction, transportation, and renewable energy. Governments in countries such as China, India, and Southeast Asian nations are heavily investing in modernizing their infrastructure, including roads, bridges, and public transportation systems, creating substantial demand for advanced materials such as composite surface films. Furthermore, the surge in adoption of renewable energy sources such as wind and solar power is boosting the demand for composite surface films in the region. Composite surface films are used in wind turbine blades due to their superior strength-to-weight ratio, corrosion resistance, and ability to withstand harsh environmental conditions. As countries in Asia-Pacific strive to meet their renewable energy targets and reduce dependence on fossil fuels, the demand for composite materials in renewable energy infrastructure is expected to grow significantly.
- Governments across Asia-Pacific are investing heavily in infrastructure development, such as transportation networks, urban development, and renewable energy projects. Composite surface films are increasingly being used in these projects due to their lightweight properties, durability, and ability to enhance structural integrity.
- The automotive industry in Asia-Pacific is focusing on lightweighting vehicles to improve fuel efficiency and reduce emissions. Composite surface films play a crucial role in this trend by replacing traditional materials in vehicle components such as body panels, interiors, and underbody shields. This shift is driven by stringent regulatory requirements and consumer demand for more eco-friendly vehicles.
- In the aerospace sector, Asia-Pacific is witnessing increased demand for composite materials in aircraft manufacturing. Composite surface films are used in aircraft interiors, structural components, and exterior surfaces due to their lightweight nature and strength. As air travel continues to grow in the region, the demand for advanced composite materials is expected to rise.
- In 2023, the number of automobiles exported stabilized at 4.8 million units. This stabilization suggests a normalization of market conditions following the sharp recovery in 2022. While the export volume remained strong, it indicates a balancing of supply and demand dynamics in the global automotive market
Competitive Landscape
The major players operating in the composite surface film market include 3M, Hexcel Corporation, Solvay, Toray Advanced Composites, Huntsman International LLC, SABIC, BASF SE, DuPont, RENEGADE MATERIALS CORPORATION, ACP COMPOSITES, INC., and Others.
Industry Trends
Aerospace and Defense Growth: The aerospace industry is a major driver for composite surface films, as these materials offer high strength-to-weight ratios, improved fuel efficiency, and enhanced performance. The increasing production of aircraft, especially with the rising demand for fuel-efficient and lightweight planes, is boosting the market.
Automotive Industry Demand: The automotive sector is increasingly adopting composite materials to reduce vehicle weight, improve fuel efficiency, and meet stringent emission regulations. Composite surface films are used in various automotive applications, including body panels, interiors, and under-the-hood components.
Sustainability and Recycling: There is a growing focus on sustainability and the environmental impact of composite materials. Manufacturers are investing in the development of recyclable and eco-friendly composite surface films. The use of bio-based resins and sustainable raw materials is becoming more prevalent
Key Sources Referred
- Invest India
- International Renewable Energy Agency (IREA)
- India brand Equity foundation (IBEF)
- International Energy Agency
- National Academy of Sciences
Key Benefits For Stakeholders
- This report provides a quantitative analysis of the market segments, current trends, estimations, and dynamics of the composite surface film market analysis from 2024 to 2033 to identify the prevailing composite surface film market opportunities.
- The market research is offered along with information related to key drivers, restraints, and opportunities.
- Porter's five forces analysis highlights the potency of buyers and suppliers to enable stakeholders make profit-oriented business decisions and strengthen their supplier-buyer network.
- In-depth analysis of the composite surface film market segmentation assists to determine the prevailing market opportunities.
- Major countries in each region are mapped according to their revenue contribution to the global market.
- Market player positioning facilitates benchmarking and provides a clear understanding of the present position of the market players.
- The report includes the analysis of the regional as well as global composite surface film market trends, key players, market segments, application areas, and market growth strategies.
Composite Surface Film Market Report Highlights
| Aspects | Details |
| Market Size By 2033 | USD 476.6 Million |
| Growth Rate | CAGR of 6.6% |
| Forecast period | 2024 - 2033 |
| Report Pages | 320 |
| By Film Structure |
|
| By End-Use Industry |
|
| By Region |
|
| Key Market Players | Huntsman International LLC, 3M company, Solvay S.A., BASF SE, ACP COMPOSITES, INC. , Hexcel Corporation, SABIC, RENEGADE MATERIALS CORPORATION, Toray Advanced Composites, DuPont |
| | Others |
Increase in demand for high-performance coatings, growth in automotive and aerospace industries are the upcoming trends of Composite Surface Film Market in the world.
Asia-Pacific is the largest regional market for Composite Surface Film
Automotive is the leading application of Composite Surface Film Market
$476.6 million is the estimated industry size of Composite Surface Film by 2033.
3M Company, Hexcel Corporation, Solvay, Toray Advanced Composites, Huntsman International LLC, SABIC, BASF SE, DuPont, RENEGADE MATERIALS CORPORATION, ACP COMPOSITES, INC. are the top companies to hold the market share in Composite Surface Film
Loading Table Of Content...

