Compound Semiconductor Market By Type (III-V Compound Semiconductors, II-VI Compound Semiconductors, Sapphire, IV-IV Compound Semiconductors, and Others), Deposition Technology (Chemical Vapor Deposition, Molecular Beam Epitaxy, Hydride Vapor Phase Epitaxy, Ammonothermal, Liquid Phase Epitaxy, Atomic Layer Deposition, and Others), Product (Power Semiconductor, Transistors, Integrated Circuits, Diodes & Rectifiers, and Others), and Application (IT & Telecom, Industrial and Energy & Power, Aerospace & Defense, Automotive, Consumer Electronics, and Healthcare): Global Opportunity Analysis and Industry Forecast, 2020–2027
A00855 | Pages: 361 | Jul 2020 | 13410 Views | | |
Author(s) : Divyanshi Tewari | Tables: 157 | Charts: 58 | Formats*: | |
COVID-19
Pandemic disrupted the entire world and affected many industries.
Get detailed COVID-19 impact analysis on the Compound Semiconductor Market
Request Now !Compound Semiconductor Market – 2027
The global compound semiconductor market was valued at $89.9 billion in 2019, and is projected to reach $212.9 billion by 2027, registering a CAGR of 11.1% from 2020 to 2027. A compound semiconductor is defined as a semiconductor composed of elements from two or more different groups of the periodic table, and is synthesized using deposition technologies. Devices made of semiconductors are essential components of most electronic circuits, as they possess unique properties such as wide band gap, high operational temperatures, high current & voltage holding capacity, and ability to generate microwave signals.
COVID 19 scenario to impact IT & Telecom segment in Compound Semiconductor Market positively.
Get more information on this report : Request Sample Pages
Compound semiconductors provide significant performance advantages that are absolutely essential for a growing range of technology applications. Compound semiconductors such as GaAs and InP can operate at speeds that have higher magnitudes than silicon. In addition, compound semiconductors can generate and receive a broad range of the electromagnetic spectrum from high frequency ultraviolet visible spectrum to long wavelength infrared light. Other properties offered by compound semiconductor materials include the ability to emit and sense light in the form of general lighting (LEDs) and communications (lasers and receivers for fiber-optics).
According to compound semiconductor market analysis, the compound semiconductor wafers are used in photonics, microelectronics, spintronics, and photovoltaic, among others. They provide faster switching at high power with increased energy efficiency and promote improved performances. Epitaxial wafer is manufactured by adding multi-micrometer thick single silicon carbide crystal layers on top of a polished wafer. Precise control of thickness, carrier concentration, and defect density is required to enable its seamless production. The epitaxial layers define the wireless, photonic, and electronic performance of compound semiconductor epitaxial wafers, which are then processed to produce the chips and ICs, which can be found in various technology devices and gadgets globally.
The factors such as advantage of compound semiconductor wafers over silicon-based wafers, increase in demand for compound semiconductor epitaxial wafer in consumer electronics, and emerging trends toward wafers in automotive industry drive the compound semiconductor market growth to a certain extent. However, increase in cost of wafer manufacturing is expected to pose a major threat to the compound semiconductor market size globally. However, emerging usage of compound semiconductors in smart technologies and increasing popularity of IoT in wafers are expected to provide lucrative compound semiconductor market opportunity globally.
Compound Semiconductor Market
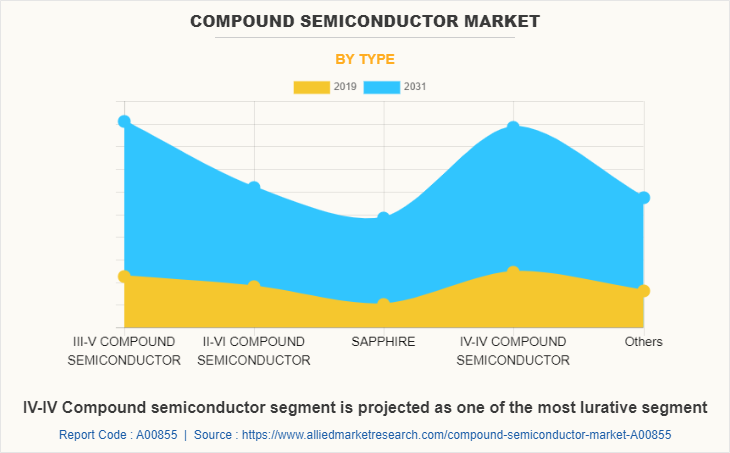
By TypeIII-V Compound Semiconductor segment will dominate the market during 2020-2027
Get more information on this report : Request Sample Pages
Segmentation
The global compound semiconductor market is analyzed on the basis of type, deposition technology, product, application, and region. Based on type, the market is categorized into III–V compound semiconductors, II–VI compound semiconductors, sapphire, IV–IV compound semiconductors, and others. The III–V compound semiconductors segment is further divided into gallium nitride (GAN), gallium phosphide (GAP), gallium arsenide (GAAS), indium phosphide (INP), and indium antimonide (INSB).
The II–VI compound semiconductors segment is classified into cadmium selenide (CDSE), cadmium telluride (CDTE), and zinc selenide (ZNSE). The IV–IV compound semiconductors segment is bifurcated into silicon carbide (SIC) and silicon germanium (SIGE). The others segment includes aluminum gallium arsenide (ALGAAS), aluminum indium arsenide (ALINAS), aluminum gallium nitride (ALGAN), aluminum gallium phosphide (ALGAP), indium gallium nitride (INGAN), cadmium zinc telluride (CDZNTE), and mercury cadmium telluride (HGCDTE).
Compound Semiconductor Market
By Deposition Technology
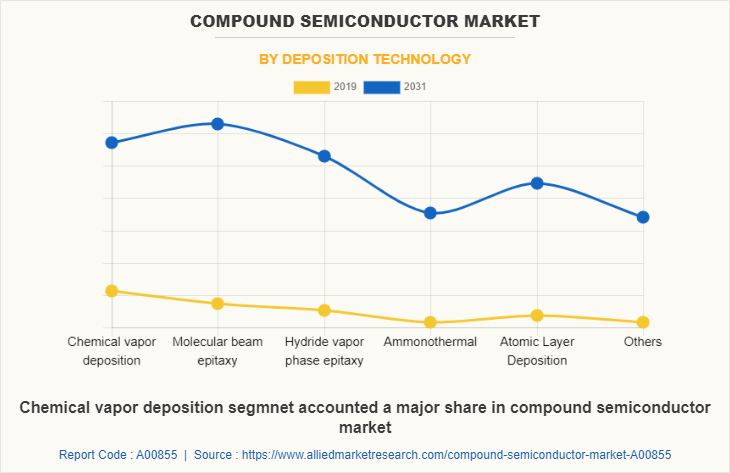
Molecular Beam Epitaxy segment is projected to be the most lucrative segment
Get more information on this report : Request Sample Pages
By deposition technology, the compound semiconductor market share is segmented into chemical vapor deposition (CVD), molecular beam epitaxy (MBE), hydride vapor phase epitaxy (HVPE), ammonothermal, liquid phase epitaxy (LPE), atomic layer deposition (ALD), and others. On the basis of product, compound semiconductors are categorized into power semiconductor, transistors, integrated circuits (ICs), diodes & rectifiers, and others.
Compound Semiconductor Market
By Product
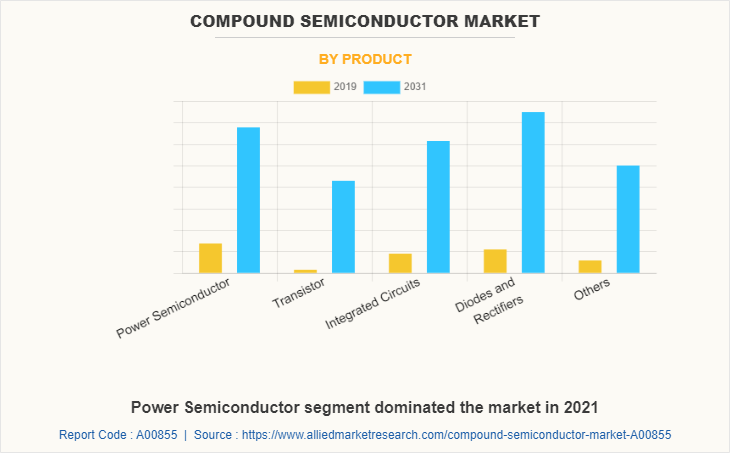
Transistor segment would grow at a highest CAGR of 13.0% during the forecast period
Get more information on this report : Request Sample Pages
The transistors segment is further classified into high electron mobility transistors (HEMTs), metal oxide semiconductor field effect transistors (MOSFETs), and metal semiconductor field effect transistors (MESFETs). Integrated circuit is bifurcated into monolithic microwave integrated circuits (MMICs) and radio frequency integrated circuits (RFICs). The diode & rectifiers segment is further segmented into PIN diode, Zener diode, Schottky diode, and light emitting diode.
Compound Semiconductor Market
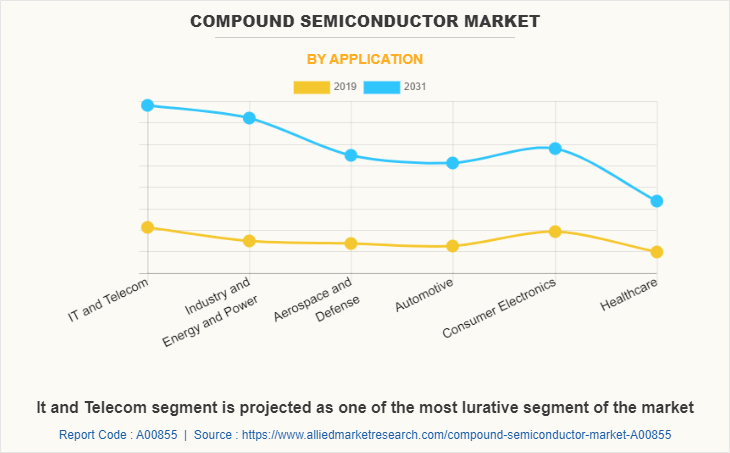
By ApplicationIT & Telecom segment holds a dominant position in 2019 and would maintain the lead during 2020-2027
Get more information on this report : Request Sample Pages
On the basis of applications, the market is studied across IT & telecom, industrial and energy & power, aerospace & defense, automotive, consumer electronics, and healthcare. IT & telecom is further segmented into signal amplifiers & switching systems, satellite communication applications, radar applications, and RF. Aerospace & defense is classified into combat vehicles, ships & vessels, and microwave radiation. Industrial and energy & power is further segmented into wind turbines and wind power systems.
Consumer electronics is further segmented into inverters, LED lighting, and switch mode consumer power supply systems. The automotive segment is further divided into electric vehicles & hybrid electric vehicles, automotive braking systems, rail traction, and automobile motor drives. The healthcare segment is further bifurcated into implantable medical devices and biomedical electronics. By region, the compound semiconductor market is analyzed across North America, Europe, Asia-Pacific and LAMEA, along with its prominent countries.
Compound Semiconductor Market
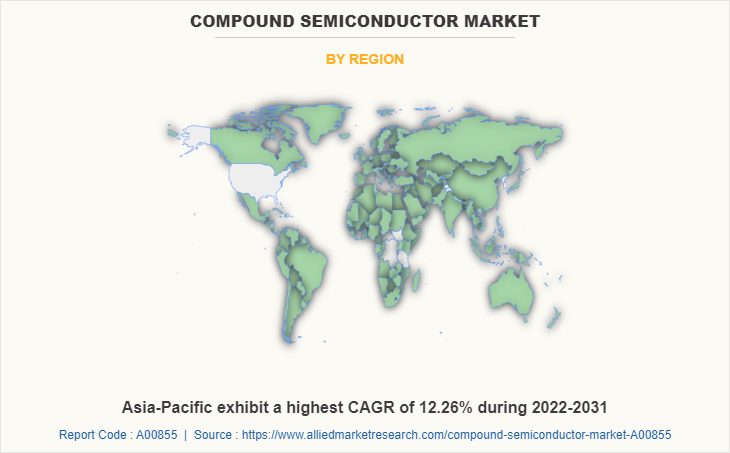
By RegionAsia-Pacific region would exhibit the highest CAGR of 13.2% during 2020-2027
Get more information on this report : Request Sample Pages
The key compound semiconductor industry players profiled in the report include Cree Inc., Nichia Corporation, Samsung Electronics, Qorvo, NXP Semiconductor N.V., Taiwan Semiconductor Manufacturing Company Ltd., Renesas Electronics Corporation, Texas Instruments Inc., STMicroelectronics NV, and Infineon Technologies AG. These key players have adopted strategies, such as product portfolio expansion, mergers & acquisitions, agreements, geographical expansion, and collaborations to enhance their market penetration.
The COVID-19 crisis is making uncertainty in the stock market, immense slowing of the supply chain, falling business confidence, and increasing panic among the customer segments. The overall impact of the pandemic is impacting the production process of several industries including semiconductor and electronics, and many more. Trade barriers are further constraining the demand and supply outlook. As the government of different countries has already announced total lockdown and temporarily shutdown of industries, the overall production process is adversely affected.
COVID-19 is having a large impact on both the consumer and the economy. Electronics manufacturing hubs have been temporarily shut down to liming the COVID-19 spread among the individuals. This has majorly affected the supply chain of semiconductor market by creating shortages of materials, components, and finished goods. Lack of business continuity has ensured significant negative impacts on revenue, shareholder returns, and revenue, which are expected to create financial disruptions in the compound semiconductor industry.
The impact of COVID-19 on the manufacturing industry has significantly affected the global economy. Electronic components such as PCBs, LED chips and wafers, ICs, and other semiconductor devices are mostly imported from China. Due to the shutdown of manufacturing units, the prices of semiconductor components have increased by 2-3%, owing to shortage of supplies. In addition, product demand is being shifting across ASICS, memory, and sensors, among others, with rapid change in consumer behavior.
Top Impacting Factors
The significant factors impacting the growth of the global compound semiconductor epitaxial wafer market include advantage of compound semiconductor wafers over silicon-based wafers, increase in demand for compound semiconductor epitaxial wafer in consumer electronics, and emerging trends toward wafers in the automotive industry. However, increase in cost of wafer manufacturing acts as the major barrier for early adoption; thereby, hampering the growth of the market. On the contrary, emerging usage of compound semiconductors in smart technologies and increase in popularity of IoT in wafers are the factors anticipated to provide lucrative opportunities for the growth of the compound semiconductor epitaxial wafer market during the forecast period.
Key Benefits For Stakeholders:
This study includes the analytical depiction of the compound semiconductor market forecast along with the current trends and future estimations to determine the imminent investment pockets.
The report presents information regarding the key drivers, restraints, and opportunities in the smart sensor market.
The compound semiconductor market trends are quantitatively analyzed from 2019 to 2027 to highlight the financial competency of the industry.
Porter’s five forces analysis illustrates the potency of the buyers and suppliers in the industry.
Compound Semiconductor Market Key Segments
By Type
III-V Compound Semiconductors
- Gallium Nitride
- Gallium Phosphide
- Gallium Arsenide
- Indium Phosphide
- Indium Antimonide
II-VI Compound Semiconductor
- Cadmium Selenide
- Cadmium Telluride
- Zinc Selenide
Sapphire
IV-IV Compound Semiconductors
- Silicon Carbide
- Silicon Germanium
Others
- Aluminum Gallium Arsenide
- Aluminum Indium Arsenide
- Aluminum Gallium Nitride
- Aluminum Gallium Phosphide
- Indium Gallium Nitride
- Cadmium Zinc Telluride
- Mercury Cadmium Telluride
By Deposition Technology
Chemical Vapor Deposition
Metal Organic Chemical Vapor Deposition (MOCVD)
Molecular Beam Epitaxy
Metal Organic Molecular Beam Epitaxy
- Hydride Vapor Phase Epitaxy (HVPE)
- Ammonothermal
- Liquid Phase Epitaxy
- Atomic Layer Deposition
- Others
By Product
- Power Semiconductor
- Transistor
High Electron Mobility Transistors
Metal Oxide Semiconductor Field-Effect Transistors
Metal Semiconductor Field-Effect Transistors
Integrated Circuits
Monolithic Microwave Integrated Circuits
Radio Frequency Integrated Circuits
Diodes and Rectifiers
- PIN Diode
- Zener Diode
- Schottky Diode
- Light-Emitting Diode
Others
By Application
IT & Telecom
- Signal Amplifiers and Switching System
- Satellite Communication
- Radar
- RF
Industrial and Energy & Power
- Smart Grid
- Wind Turbines & Wind Power System
- Photovoltaic Inverters
- Motor Drives
Aerospace & Defense
- Combat Vehicles
- Ships & Vessels
- Microwave Radiation
Automotive
- Electric Vehicle & Hybrid Electric Vehicles
- Chemical Vapor Deposition Braking System
- Rail Traction
- Automobile Motor Drives
Consumer Electronics
- Invertors
- LED Lighting
- Switch Mode Consumer Power Supply System
Healthcare
- Implantable Medical Device
- Biomedical Electronics
By Region
North America
- U.S.
- Canada
- Mexico
Europe
- UK
- Germany
- France
- Rest of Europe
Asia-Pacific
- China
- Japan
- India
- Australia
- Rest of Asia-Pacific
LAMEA
- Latin America
- Middle East
- Africa
Key Market Players
- Cree Inc.
- Nichia Corporation
- Samsung Electronics
- Qorvo
- NXP Semiconductor N.V.
- Taiwan Semiconductor Manufacturing Company Ltd.
- Renesas Electronics Corporation
- Texas Instruments Inc.
- STMicroelectronics NV
- Infineon Technologies AG
CHAPTER 1: INTRODUCTION
1.1. REPORT DESCRIPTION
1.2. KEY BENEFITS FOR STAKEHOLDERS
1.3. KEY MARKET SEGMENTS
1.4. RESEARCH METHODOLOGY
1.4.1. Primary research
1.4.2. Secondary research
1.4.3. Analyst tools and models
CHAPTER 2: EXECUTIVE SUMMARY
2.1. CXO PERSPECTIVE
CHAPTER 3: MARKET OVERVIEW
3.1. MARKET DEFINITION AND SCOPE
3.2. COVID-19 IMPACT ANALYSIS
3.2.1. COVID-19 Outbreak
3.2.2. Impact on market size
3.2.3. End user trends, preferences, and budget impact
3.2.4. Parent industry impact
3.2.5. Key player strategies to tackle negative impact
3.2.5.1. Limiting cuts to R&D expense:
3.2.5.2. Focusing on next-generation products
3.2.5.3. Shifting toward agile supply chain model
3.2.6. Opportunity window
3.3. KEY FINDINGS
3.3.1. Top impacting factors
3.3.2. Top investment pockets
3.3.3. Top winning strategies
3.4. PORTER’S FIVE FORCES ANALYSIS
3.5. KEY PLAYER POSITIONING (2019)
3.6. MARKET DYNAMICS
3.6.1. Drivers
3.6.1.1. Advantage of compound semiconductors over silicon-based technology
3.6.1.2. Increase in demand for compound semiconductor epitaxial wafer in LED technology
3.6.1.3. Emerging trends toward compound semiconductor wafers in the automotive industry
3.6.2. Restraints
3.6.2.1. High-cost associated with compound semiconductor materials and components
3.6.3. Opportunity
3.6.3.1. Emerging usage of compound semiconductors in smart technologies
CHAPTER 4: COMPOUND SEMICONDUCTOR MARKET, BY TYPE
4.1. OVERVIEW
4.2. III-V COMPOUND SEMICONDUCTOR
4.2.1. Gallium Nitride
4.2.2. Gallium Phosphide
4.2.3. Gallium Arsenide
4.2.4. Indium Phosphide
4.2.5. Indium Antimonide
4.2.6. Key market trends, growth factors, and opportunities
4.2.7. Market size and forecast, by region
4.2.8. Market analysis, by country
4.3. II-VI COMPOUND SEMICONDUCTOR
4.3.1. Cadmium Selenide
4.3.2. Cadmium Telluride
4.3.3. Zinc Selenide
4.3.4. Key market trends, growth factors, and opportunities
4.3.5. Market size and forecast, by region
4.3.6. Market analysis, by country
4.4. SAPPHIRE
4.4.1. Key market trends, growth factors, and opportunities
4.4.2. Market size and forecast, by region
4.4.3. Market analysis, by country
4.5. IV-IV COMPOUND SEMICONDUCTOR
4.5.1. Silicon Carbide
4.5.2. Silicon Germanium
4.5.3. Key market trends, growth factors, and opportunities
4.5.4. Market size and forecast, by region
4.5.5. Market analysis, by country
4.6. OTHERS
4.6.1. Aluminum Gallium Arsenide
4.6.2. Aluminum Indium Arsenide
4.6.3. Aluminum Gallium Nitride
4.6.4. Aluminum Gallium Phosphide
4.6.5. Indium Gallium Nitride
4.6.6. Cadmium Zinc Telluride
4.6.7. Mercury Cadmium Telluride
4.6.8. Key market trends, growth factors, and opportunities
4.6.9. Market size and forecast, by region
4.6.10. Market analysis, by country
CHAPTER 5: COMPOUND SEMICONDUCTORMARKET, BY DEPOSITION TECHNOLOGY
5.1. OVERVIEW
5.2. CHEMICAL VAPOR DEPOSITION
5.2.1. Metal Organic Chemical Vapor Deposition
5.2.2. Key market trends, growth factors, and opportunities
5.2.3. Market size and forecast, by region
5.2.4. Market analysis, by country
5.3. MOLECULAR BEAM EPITAXY
5.3.1. Metal Organic Molecular Beam Epitaxy
5.3.2. Key market trends, growth factors, and opportunities
5.3.3. Market size and forecast, by region
5.3.4. Market analysis, by country
5.4. HYDRIDE VAPOR PHASE EPITAXY
5.4.1. Key market trends, growth factors, and opportunities
5.4.2. Market size and forecast, by region
5.4.3. Market analysis, by country
5.5. AMMONOTHERMAL
5.5.1. Liquid Phase Epitaxy
5.5.2. Key market trends, growth factors, and opportunities
5.5.3. Market size and forecast, by region
5.5.4. Market analysis, by country
5.6. ATOMIC LAYER DEPOSITION
5.6.1. Key market trends, growth factors, and opportunities
5.6.2. Market size and forecast, by region
5.6.3. Market analysis, by country
5.7. OTHERS
5.7.1. Key market trends, growth factors, and opportunities
5.7.2. Market size and forecast, by region
5.7.3. Market analysis, by country
CHAPTER 6: COMPOUND SEMICONDUCTOR MARKET, BY PRODUCT
6.1. OVERVIEW
6.2. POWER SEMICONDUCTOR
6.2.1. Key market trends, growth factors, and opportunities
6.2.2. Market size and forecast, by region
6.2.3. Market analysis, by country
6.3. TRANSISTOR
6.3.1. High electron mobility transistor
6.3.2. Metal oxide semiconductor field-effect transistor
6.3.3. Metal semiconductor field-effect transistor
6.3.4. Key market trends, growth factors, and opportunities
6.3.5. Market size and forecast, by region
6.3.6. Market analysis, by country
6.4. INTEGRATED CIRCUITS
6.4.1. Monolithic microwave integrated circuits
6.4.2. Radio frequency integrated circuits
6.4.3. Key market trends, growth factors, and opportunities
6.4.4. Market size and forecast, by region
6.4.5. Market analysis, by country
6.5. DIODES & RECTIFIERS
6.5.1. PIN Diode
6.5.2. Zener Diode
6.5.3. Schokkty Diode
6.5.4. Light-Emitting Diode
6.5.5. Key market trends, growth factors, and opportunities
6.5.6. Market size and forecast, by region
6.5.7. Market analysis, by country
6.6. OTHERS
6.6.1. Key market trends, growth factors, and opportunities
6.6.2. Market size and forecast, by region
6.6.3. Market analysis, by country
CHAPTER 7: COMPOUND SEMICONDUCTOR MARKET, BY APPLICATION
7.1. OVERVIEW
7.2. IT & TELECOM
7.2.1. Signal Amplifiers & Switching System
7.2.2. Satellite Communication
7.2.3. Radar
7.2.4. RF
7.2.5. Key market trends, growth factors, and opportunities
7.2.6. Market size and forecast, by region
7.2.7. Market analysis, by country
7.3. INDUSTRIAL AND ENERGY & POWER
7.3.1. Smart Grid
7.3.2. Wind Turbine & Wind Power Systems
7.3.3. Photovoltaic Invertors
7.3.4. Motor Drives
7.3.5. Key market trends, growth factors, and opportunities
7.3.6. Market size and forecast, by region
7.3.7. Market analysis, by country
7.4. AEROSPACE & DEFENSE
7.4.1. Combat Vehicles
7.4.2. Ships & Vessels
7.4.3. Microwave Radiation
7.4.4. Key market trends, growth factors, and opportunities
7.4.5. Market size and forecast, by region
7.4.6. Market analysis, by country
7.5. AUTOMOTIVE
7.5.1. Electric Vehicle & Hybrid Electric Vehicle
7.5.2. Automotive Braking System
7.5.3. Rail Traction
7.5.4. Automobile Motor Drives
7.5.5. Key market trends, growth factors, and opportunities
7.5.6. Market size and forecast, by region
7.5.7. Market analysis, by country
7.6. CONSUMER ELECTRONICS
7.6.1. Inverters
7.6.2. LED Lighting
7.6.3. Switch Mode Consumer Power Supply System
7.6.4. Key market trends, growth factors, and opportunities
7.6.5. Market size and forecast, by region
7.6.6. Market analysis, by country
7.7. HEALTHCARE
7.7.1. Implantable Medical Devices
7.7.2. Biomedical Electronics
7.7.3. Key market trends, growth factors, and opportunities
7.7.4. Market size and forecast, by region
7.7.5. Market analysis, by country
CHAPTER 8: COMPOUND SEMICONDUCTOR MARKET, BY REGION
8.1. OVERVIEW
8.2. NORTH AMERICA
8.2.1. Key market trends, growth factors, and opportunities
8.2.2. Market size and forecast, by type
8.2.3. Market size and forecast, by deposition technology
8.2.4. Market size and forecast, by product
8.2.5. Market size and forecast, by application
8.2.6. Market analysis, by country
8.2.6.1. U.S.
8.2.6.1.1. Market size and forecast, by type
8.2.6.1.2. Market size and forecast, by deposition technology
8.2.6.1.3. Market size and forecast, by product
8.2.6.1.4. Market size and forecast, by application
8.2.6.2. Canada
8.2.6.2.1. Market size and forecast, by type
8.2.6.2.2. Market size and forecast, by deposition technology
8.2.6.2.3. Market size and forecast, by product
8.2.6.2.4. Market size and forecast, by application
8.2.6.3. Mexico
8.2.6.3.1. Market size and forecast, by type
8.2.6.3.2. Market size and forecast, by deposition technology
8.2.6.3.3. Market size and forecast, by product
8.2.6.3.4. Market size and forecast, by application
8.3. EUROPE
8.3.1. Key market trends, growth factors, and opportunities
8.3.2. Market size and forecast, by type
8.3.3. Market size and forecast, by deposition technology
8.3.4. Market size and forecast, by product
8.3.5. Market size and forecast, by application
8.3.6. Market analysis, by country
8.3.6.2. UK
8.3.6.2.1. Market size and forecast, by type
8.3.6.2.2. Market size and forecast, by deposition technology
8.3.6.2.3. Market size and forecast, by product
8.3.6.2.4. Market size and forecast, by application
8.3.6.3. Germany
8.3.6.3.1. Market size and forecast, by type
8.3.6.3.2. Market size and forecast, by deposition technology
8.3.6.3.3. Market size and forecast, by product
8.3.6.3.4. Market size and forecast, by application
8.3.6.4. France
8.3.6.4.1. Market size and forecast, by type
8.3.6.4.2. Market size and forecast, by deposition technology
8.3.6.4.3. Market size and forecast, by product
8.3.6.4.4. Market size and forecast, by application
8.3.6.5. Rest of Europe
8.3.6.5.1. Market size and forecast, by type
8.3.6.5.2. Market size and forecast, by deposition technology
8.3.6.5.3. Market size and forecast, by product
8.3.6.5.4. Market size and forecast, by application
8.4. ASIA-PACIFIC
8.4.1. Key market trends, growth factors, and opportunities
8.4.2. Market size and forecast, by type
8.4.3. Market size and forecast, by deposition technology
8.4.4. Market size and forecast, by product
8.4.5. Market size and forecast, by application
8.4.6. Market analysis, by country
8.4.6.1. China
8.4.6.1.1. Market size and forecast, by type
8.4.6.1.2. Market size and forecast, by deposition technology
8.4.6.1.3. Market size and forecast, by product
8.4.6.1.4. Market size and forecast, by application
8.4.6.2. Japan
8.4.6.2.1. Market size and forecast, by type
8.4.6.2.2. Market size and forecast, by deposition technology
8.4.6.2.3. Market size and forecast, by product
8.4.6.2.4. Market size and forecast, by application
8.4.6.3. India
8.4.6.3.1. Market size and forecast, by type
8.4.6.3.2. Market size and forecast, by deposition technology
8.4.6.3.3. Market size and forecast, by product
8.4.6.3.4. Market size and forecast, by application
8.4.6.4. Australia
8.4.6.4.1. Market size and forecast, by type
8.4.6.4.2. Market size and forecast, by deposition technology
8.4.6.4.3. Market size and forecast, by product
8.4.6.4.4. Market size and forecast, by application
8.4.6.5. Rest of Asia-Pacific
8.4.6.5.1. Market size and forecast, by type
8.4.6.5.2. Market size and forecast, by deposition technology
8.4.6.5.3. Market size and forecast, by product
8.4.6.5.4. Market size and forecast, by application
8.5. LAMEA
8.5.1. Key market trends, growth factors, and opportunities
8.5.2. Market size and forecast, by type
8.5.3. Market size and forecast, by deposition technology
8.5.4. Market size and forecast, by product
8.5.5. Market size and forecast, by application
8.5.6. Market analysis, by country
8.5.6.1. Latin America
8.5.6.1.1. Market size and forecast, by type
8.5.6.1.2. Market size and forecast, by deposition technology
8.5.6.1.3. Market size and forecast, by product
8.5.6.1.4. Market size and forecast, by application
8.5.6.2. Middle East
8.5.6.2.1. Market size and forecast, by type
8.5.6.2.2. Market size and forecast, by deposition technology
8.5.6.2.3. Market size and forecast, by product
8.5.6.2.4. Market size and forecast, by application
8.5.6.3. Africa
8.5.6.3.1. Market size and forecast, by type
8.5.6.3.2. Market size and forecast, by deposition technology
8.5.6.3.3. Market size and forecast, by product
8.5.6.3.4. Market size and forecast, by application
CHAPTER 9: COMPANY PROFILES
9.1. NICHIA CORPORATION
9.1.1. Company overview
9.1.2. Key Executive
9.1.3. Company snapshot
9.1.4. Product portfolio
9.1.5. Key strategic moves and developments
9.2. CREE, INC.
9.2.1. Company overview
9.2.2. Company snapshot
9.2.3. Operating business segments
9.2.4. Product portfolio
9.2.5. R&D Expenditure
9.2.6. Business performance
9.2.7. Key strategic moves and developments
9.3. SAMSUNG ELECTRONICS CO. LTD.
9.3.1. Company overview
9.3.2. Key Executives
9.3.3. Company snapshot
9.3.4. Operating business segments
9.3.5. Product portfolio
9.3.6. R&D Expenditure
9.3.7. Business performance
9.3.8. Key strategic moves and developments
9.4. RENESAS ELECTRONICS CORPORATION
9.4.1. Company overview
9.4.2. Key Executives
9.4.3. Company snapshot
9.4.4. Operating business segments
9.4.5. Product portfolio
9.4.6. R&D Expenditure
9.4.7. Business performance
9.5. NXP SEMICONDUCTOR
9.5.1. Company overview
9.5.2. Key Executives
9.5.3. Company snapshot
9.5.4. Product portfolio
9.5.5. R&D Expenditure
9.5.6. Business performance
9.5.7. Key strategic moves and developments
9.6. STMICROELECTRONICS N.V.
9.6.1. Company overview
9.6.2. Key Executives
9.6.3. Company snapshot
9.6.4. Operating business segments
9.6.5. Product portfolio
9.6.6. R&D Expenditure
9.6.7. Business performance
9.6.8. Key strategic moves and developments
9.7. INFINEON TECHNOLOGIES AG
9.7.1. Company overview
9.7.2. Key Executives
9.7.3. Company snapshot
9.7.4. Operating business segments
9.7.5. Product portfolio
9.7.6. R&D Expenditure
9.7.7. Business performance
9.7.8. Key strategic moves and developments
9.8. TEXAS INSTRUMENTS INCORPORATED
9.8.1. Company overview
9.8.2. Key Executives
9.8.3. Company snapshot
9.8.4. Operating business segments
9.8.5. Product portfolio
9.8.6. R&D Expenditure
9.8.7. Business performance
9.8.8. Key strategic moves and developments
9.9. TAIWAN SEMICONDUCTOR MANUFACTURING COMPANY LIMITED
9.9.1. Company overview
9.9.2. Key Executives
9.9.3. Company snapshot.
9.9.4. Product portfolio
9.9.5. R&D Expenditure
9.9.6. Business performance
9.9.7. Key strategic moves and developments
9.10. QORVO, INC.
9.10.1. Company overview
9.10.2. Key Executives
9.10.3. Company snapshot
9.10.4. Operating business segments
9.10.5. Product portfolio
9.10.6. R&D Expenditure
9.10.7. Business performance
9.10.8. Key strategic moves and developments
LIST OF TABLES
TABLE 01. GLOBAL COMPOUND SEMICONDUCTOR MARKET, BY TYPE, 2019-2027($MILLION)
TABLE 02. GLOBAL COMPOUND SEMICONDUCTOR MARKET, BY SUBSEGMENT, 2019-2027($MILLION)
TABLE 03. GLOBAL COMPOUND SEMICONDUCTOR MARKET REVENUE FOR III-V COMPOUND SEMICONDUCTOR, BY REGION 2019-2027 ($MILLION)
TABLE 04. GLOBAL COMPOUND SEMICONDUCTOR MARKET, BY SUBSEGMENT, 2019-2027($MILLION)
TABLE 05. GLOBAL COMPOUND SEMICONDUCTOR MARKET REVENUE FOR II-VI COMPOUND SEMICONDUCTOR, BY REGION 2019-2027 ($MILLION)
TABLE 06. GLOBAL COMPOUND SEMICONDUCTOR MARKET REVENUE FOR SAPPHIRE, BY REGION 2019–2027 ($MILLION)
TABLE 07. GLOBAL COMPOUND SEMICONDUCTOR MARKET, BY SUBSEGMENT, 2019-2027($MILLION)
TABLE 08. GLOBAL COMPOUND SEMICONDUCTOR MARKET REVENUE FOR IV-IV COMPOUND SEMICONDUCTOR, BY REGION 2019–2027 ($MILLION)
TABLE 09. GLOBAL COMPOUND SEMICONDUCTOR MARKET, BY SUBSEGMENT, 2019-2027($MILLION)
TABLE 10. GLOBAL COMPOUND SEMICONDUCTOR MARKET REVENUE FOR OTHERS, BY REGION 2019–2027 ($MILLION)
TABLE 11. GLOBAL COMPOUND SEMICONDUCTOR MARKET, BY DEPOSITION TECHNOLOGY, 2019-2027($MILLION)
TABLE 12. GLOBAL COMPOUND SEMICONDUCTOR MARKET, BY SUBSEGMENT, 2019-2027($MILLION)
TABLE 13. GLOBAL COMPOUND SEMICONDUCTOR MARKET REVENUE FOR CHEMICAL VAPOR DESPOSITION, BY REGION 2019-2027 ($MILLION)
TABLE 14. GLOBAL COMPOUND SEMICONDUCTOR MARKET, BY SUBSEGMENT, 2019-2027($MILLION)
TABLE 15. GLOBAL COMPOUND SEMICONDUCTOR MARKET REVENUE FOR MOLECULAR BEAM EPITAXY, BY REGION 2019-2027 ($MILLION)
TABLE 16. GLOBAL COMPOUND SEMICONDUCTOR MARKET REVENUE FOR HYDRIDE VAPOR PHASE EPITAXY, BY REGION 2019–2027 ($MILLION)
TABLE 17. GLOBAL COMPOUND SEMICONDUCTOR MARKET, BY SUBSEGMENT, 2019-2027($MILLION)
TABLE 18. GLOBAL COMPOUND SEMICONDUCTOR MARKET REVENUE FOR AMMONOTHERMAL, BY REGION 2019–2027 ($MILLION)
TABLE 19. GLOBAL COMPOUND SEMICONDUCTOR MARKET REVENUE FOR ATOMIC LAYER DEPOSITION, BY REGION 2019–2027 ($MILLION)
TABLE 20. GLOBAL COMPOUND SEMICONDUCTOR MARKET REVENUE FOR OTHERS, BY REGION 2019–2027 ($MILLION)
TABLE 21. GLOBAL COMPOUND SEMICONDUCTOR MARKET, BY PRODUCT, 2019-2027($MILLION)
TABLE 22. GLOBAL COMPOUND SEMICONDUCTOR MARKET REVENUE FOR POWER SEMICONDUCTOR, BY REGION 2019-2027 ($MILLION)
TABLE 23. GLOBAL COMPOUND SEMICONDUCTOR MARKET, BY SUBSEGMENT, 2019-2027($MILLION)
TABLE 24. GLOBAL COMPOUND SEMICONDUCTOR MARKET REVENUE FOR TRANSISTOR, BY REGION 2019-2027 ($MILLION)
TABLE 25. GLOBAL COMPOUND SEMICONDUCTOR MARKET, BY SUBSEGMENT, 2019-2027($MILLION)
TABLE 26. GLOBAL COMPOUND SEMICONDUCTOR MARKET REVENUE FOR INTEGRATED CIRUITS, BY REGION 2019–2027 ($MILLION)
TABLE 27. GLOBAL COMPOUND SEMICONDUCTOR MARKET, BY SUBSEGMENT, 2019-2027($MILLION)
TABLE 28. GLOBAL COMPOUND SEMICONDUCTOR MARKET REVENUE FOR RECTIFIERS AND DIODES, BY REGION 2019–2027 ($MILLION)
TABLE 29. GLOBAL COMPOUND SEMICONDUCTOR MARKET REVENUE FOR OTHERS, BY REGION 2019–2027 ($MILLION)
TABLE 30. GLOBAL COMPOUND SEMICONDUCTOR MARKET, BY APPLICATION, 2019-2027($MILLION)
TABLE 31. GLOBAL COMPOUND SEMICONDUCTOR MARKET, BY SUBSEGMENT, 2019-2027($MILLION)
TABLE 32. GLOBAL COMPOUND SEMICONDUCTOR MARKET REVENUE FOR IT & TELECOM, BY REGION 2019-2027 ($MILLION)
TABLE 33. GLOBAL COMPOUND SEMICONDUCTOR MARKET, BY SUBSEGMENT, 2019-2027($MILLION)
TABLE 34. GLOBAL COMPOUND SEMICONDUCTOR MARKET REVENUE FOR INDUSTRIAL AND ENERGY & POWER, BY REGION 2019-2027 ($MILLION)
TABLE 35. GLOBAL COMPOUND SEMICONDUCTOR MARKET, BY SUBSEGMENT, 2019-2027($MILLION)
TABLE 36. GLOBAL COMPOUND SEMICONDUCTOR MARKET REVENUE FOR AEROSPACE & DEFENSE, BY REGION 2019–2027 ($MILLION)
TABLE 37. GLOBAL COMPOUND SEMICONDUCTOR MARKET, BY SUBSEGMENT, 2019-2027($MILLION)
TABLE 38. GLOBAL COMPOUND SEMICONDUCTOR MARKET REVENUE FOR AUTOMOTIVE, BY REGION 2019–2027 ($MILLION)
TABLE 39. GLOBAL COMPOUND SEMICONDUCTOR MARKET, BY SUBSEGMENT, 2019-2027($MILLION)
TABLE 40. GLOBAL COMPOUND SEMICONDUCTOR MARKET REVENUE FOR CONSUMER ELECTRONICS, BY REGION 2019–2027 ($MILLION)
TABLE 41. GLOBAL COMPOUND SEMICONDUCTOR MARKET, BY SUBSEGMENT, 2019-2027($MILLION)
TABLE 42. GLOBAL COMPOUND SEMICONDUCTOR MARKET REVENUE FOR HEALTHCARE, BY REGION 2019–2027 ($MILLION)
TABLE 43. NORTH AMERICA COMPOUND SEMICONDUCTOR MARKET, BY TYPE, 2019–2027 ($MILLION)
TABLE 44. NORTH AMERICA COMPOUND SEMICONDUCTOR MARKET, BY DEPOSITION TECHNOLOGY, 2019–2027 ($MILLION)
TABLE 45. NORTH AMERICA COMPOUND SEMICONDUCTOR MARKET, BY PRODUCT, 2019–2027 ($MILLION)
TABLE 46. NORTH AMERICA COMPOUND SEMICONDUCTOR MARKET, BY APPLICATION, 2019–2027 ($MILLION)
TABLE 47. U. S. COMPOUND SEMICONDUCTOR MARKET, BY TYPE, 2019–2027 ($MILLION)
TABLE 48. U. S. COMPOUND SEMICONDUCTOR MARKET, BY DEPOSITION TECHNOLOGY, 2019–2027 ($MILLION)
TABLE 49. U. S. COMPOUND SEMICONDUCTOR MARKET, BY PRODUCT, 2019–2027 ($MILLION)
TABLE 50. U. S. COMPOUND SEMICONDUCTOR MARKET, BY APPLICATION, 2019–2027 ($MILLION)
TABLE 51. CANADA COMPOUND SEMICONDUCTOR MARKET, BY TYPE, 2019–2027 ($MILLION)
TABLE 52. CANADA COMPOUND SEMICONDUCTOR MARKET, BY DEPOSITION TECHNOLOGY, 2019–2027 ($MILLION)
TABLE 53. CANADA COMPOUND SEMICONDUCTOR MARKET, BY PRODUCT, 2019–2027 ($MILLION)
TABLE 54. CANADA COMPOUND SEMICONDUCTOR MARKET, BY APPLICATION, 2019–2027 ($MILLION)
TABLE 55. MEXICO COMPOUND SEMICONDUCTOR MARKET, BY TYPE, 2019–2027 ($MILLION)
TABLE 56. MEXICO COMPOUND SEMICONDUCTOR MARKET, BY DEPOSITION TECHNOLOGY, 2019–2027 ($MILLION)
TABLE 57. MEXICO COMPOUND SEMICONDUCTOR MARKET, BY PRODUCT, 2019–2027 ($MILLION)
TABLE 58. MEXICO COMPOUND SEMICONDUCTOR MARKET, BY APPLICATION, 2019–2027 ($MILLION)
TABLE 59. EUROPE COMPOUND SEMICONDUCTOR MARKET, BY TYPE, 2019–2027 ($MILLION)
TABLE 60. EUROPE COMPOUND SEMICONDUCTOR MARKET, BY DEPOSITION TECHNOLOGY, 2019–2027 ($MILLION)
TABLE 61. EUROPE COMPOUND SEMICONDUCTOR MARKET, BY PRODUCT, 2019–2027 ($MILLION)
TABLE 62. EUROPE COMPOUND SEMICONDUCTOR MARKET, BY APPLICATION, 2019–2027 ($MILLION)
TABLE 63. UK COMPOUND SEMICONDUCTOR MARKET, BY TYPE, 2019–2027 ($MILLION)
TABLE 64. UK COMPOUND SEMICONDUCTOR MARKET, BY DEPOSITION TECHNOLOGY, 2019–2027 ($MILLION)
TABLE 65. UK COMPOUND SEMICONDUCTOR MARKET, BY PRODUCT, 2019–2027 ($MILLION)
TABLE 66. UK COMPOUND SEMICONDUCTOR MARKET, BY APPLICATION, 2019–2027 ($MILLION)
TABLE 67. GERMANY COMPOUND SEMICONDUCTOR MARKET, BY TYPE, 2019–2027 ($MILLION)
TABLE 68. GERMANY COMPOUND SEMICONDUCTOR MARKET, BY DEPOSITION TECHNOLOGY, 2019–2027 ($MILLION)
TABLE 69. GERMANY COMPOUND SEMICONDUCTOR MARKET, BY PRODUCT, 2019–2027 ($MILLION)
TABLE 70. GERMANY COMPOUND SEMICONDUCTOR MARKET, BY APPLICATION, 2019–2027 ($MILLION)
TABLE 71. FRANCE COMPOUND SEMICONDUCTOR MARKET, BY TYPE, 2019–2027 ($MILLION)
TABLE 72. FRANCE COMPOUND SEMICONDUCTOR MARKET, BY DEPOSITION TECHNOLOGY, 2019–2027 ($MILLION)
TABLE 73. FRANCE COMPOUND SEMICONDUCTOR MARKET, BY PRODUCT, 2019–2027 ($MILLION)
TABLE 74. FRANCE COMPOUND SEMICONDUCTOR MARKET, BY APPLICATION, 2019–2027 ($MILLION)
TABLE 75. REST OF EUROPE COMPOUND SEMICONDUCTOR MARKET, BY TYPE, 2019–2027 ($MILLION)
TABLE 76. REST OF EUROPE COMPOUND SEMICONDUCTOR MARKET, BY DEPOSITION TECHNOLOGY, 2019–2027 ($MILLION)
TABLE 77. REST OF EUROPE COMPOUND SEMICONDUCTOR MARKET, BY PRODUCT, 2019–2027 ($MILLION)
TABLE 78. REST OF EUROPE COMPOUND SEMICONDUCTOR MARKET, BY APPLICATION, 2019–2027 ($MILLION)
TABLE 79. ASIA-PACIFIC COMPOUND SEMICONDUCTOR MARKET, BY TYPE, 2019–2027 ($MILLION)
TABLE 80. ASIA-PACIFIC COMPOUND SEMICONDUCTOR MARKET, BY DEPOSITION TECHNOLOGY, 2019–2027 ($MILLION)
TABLE 81. ASIA-PACIFIC COMPOUND SEMICONDUCTOR MARKET, BY PRODUCT, 2019–2027 ($MILLION)
TABLE 82. ASIA-PACIFIC COMPOUND SEMICONDUCTOR MARKET, BY APPLICATION, 2019–2027 ($MILLION)
TABLE 83. CHINA COMPOUND SEMICONDUCTOR MARKET, BY TYPE, 2019–2027 ($MILLION)
TABLE 84. CHINA COMPOUND SEMICONDUCTOR MARKET, BY DEPOSITION TECHNOLOGY, 2019–2027 ($MILLION)
TABLE 85. CHINA COMPOUND SEMICONDUCTOR MARKET, BY PRODUCT, 2019–2027 ($MILLION)
TABLE 86. CHINA COMPOUND SEMICONDUCTOR MARKET, BY APPLICATION, 2019–2027 ($MILLION)
TABLE 87. JAPAN COMPOUND SEMICONDUCTOR MARKET, BY TYPE, 2019–2027 ($MILLION)
TABLE 88. JAPAN COMPOUND SEMICONDUCTOR MARKET, BY DEPOSITION TECHNOLOGY, 2019–2027 ($MILLION)
TABLE 89. JAPAN COMPOUND SEMICONDUCTOR MARKET, BY PRODUCT, 2019–2027 ($MILLION)
TABLE 90. JAPAN COMPOUND SEMICONDUCTOR MARKET, BY APPLICATION, 2019–2027 ($MILLION)
TABLE 91. INDIA COMPOUND SEMICONDUCTOR MARKET, BY TYPE, 2019–2027 ($MILLION)
TABLE 92. INDIA COMPOUND SEMICONDUCTOR MARKET, BY DEPOSITION TECHNOLOGY, 2019–2027 ($MILLION)
TABLE 93. INDIA COMPOUND SEMICONDUCTOR MARKET, BY PRODUCT, 2019–2027 ($MILLION)
TABLE 94. INDIA COMPOUND SEMICONDUCTOR MARKET, BY APPLICATION, 2019–2027 ($MILLION)
TABLE 95. AUSTRALIA COMPOUND SEMICONDUCTOR MARKET, BY TYPE, 2019–2027 ($MILLION)
TABLE 96. AUSTRALIA COMPOUND SEMICONDUCTOR MARKET, BY DEPOSITION TECHNOLOGY, 2019–2027 ($MILLION)
TABLE 97. AUSTRALIA COMPOUND SEMICONDUCTOR MARKET, BY PRODUCT, 2019–2027 ($MILLION)
TABLE 98. AUSTRALIA COMPOUND SEMICONDUCTOR MARKET, BY APPLICATION, 2019–2027 ($MILLION)
TABLE 99. REST OF ASIA-PACIFIC COMPOUND SEMICONDUCTOR MARKET, BY TYPE, 2019–2027 ($MILLION)
TABLE 100. REST OF ASIA-PACIFIC COMPOUND SEMICONDUCTOR MARKET, BY DEPOSITION TECHNOLOGY, 2019–2027 ($MILLION)
TABLE 101. REST OF ASIA-PACIFIC COMPOUND SEMICONDUCTOR MARKET, BY PRODUCT, 2019–2027 ($MILLION)
TABLE 102. REST OF ASIA-PACIFIC COMPOUND SEMICONDUCTOR MARKET, BY APPLICATION, 2019–2027 ($MILLION)
TABLE 103. LAMEA COMPOUND SEMICONDUCTOR MARKET, BY TYPE, 2019–2027 ($MILLION)
TABLE 104. LAMEA COMPOUND SEMICONDUCTOR MARKET, BY DEPOSITION TECHNOLOGY, 2019–2027 ($MILLION)
TABLE 105. LAMEA COMPOUND SEMICONDUCTOR MARKET, BY PRODUCT, 2019–2027 ($MILLION)
TABLE 106. LAMEA COMPOUND SEMICONDUCTOR MARKET, BY APPLICATION, 2019–2027 ($MILLION)
TABLE 107. LATIN AMERICA COMPOUND SEMICONDUCTOR MARKET, BY TYPE, 2019–2027 ($MILLION)
TABLE 108. LATIN AMERICA COMPOUND SEMICONDUCTOR MARKET, BY DEPOSITION TECHNOLOGY, 2019–2027 ($MILLION)
TABLE 109. LATIN AMERICA COMPOUND SEMICONDUCTOR MARKET, BY PRODUCT, 2019–2027 ($MILLION)
TABLE 110. LATIN AMERICA COMPOUND SEMICONDUCTOR MARKET, BY APPLICATION, 2019–2027 ($MILLION)
TABLE 111. MIDDLE EAST COMPOUND SEMICONDUCTOR MARKET, BY TYPE, 2019–2027 ($MILLION)
TABLE 112. MIDDLE EAST COMPOUND SEMICONDUCTOR MARKET, BY DEPOSITION TECHNOLOGY, 2019–2027 ($MILLION)
TABLE 113. MIDDLE EAST COMPOUND SEMICONDUCTOR MARKET, BY PRODUCT, 2019–2027 ($MILLION)
TABLE 114. MIDDLE EAST COMPOUND SEMICONDUCTOR MARKET, BY APPLICATION, 2019–2027 ($MILLION)
TABLE 115. AFRICA COMPOUND SEMICONDUCTOR MARKET, BY TYPE, 2019–2027 ($MILLION)
TABLE 116. AFRICA COMPOUND SEMICONDUCTOR MARKET, BY DEPOSITION TECHNOLOGY, 2019–2027 ($MILLION)
TABLE 117. AFRICA COMPOUND SEMICONDUCTOR MARKET, BY PRODUCT, 2019–2027 ($MILLION)
TABLE 118. AFRICA COMPOUND SEMICONDUCTOR MARKET, BY APPLICATION, 2019–2027 ($MILLION)
TABLE 119. NICHIA CORPORATION: KEY EXECUTIVES
TABLE 120. NICHIA CORPORATION: COMPANY SNAPSHOT
TABLE 121. NICHIA CORPORATION: PRODUCT PORTFOLIO
TABLE 122. CREE, INC.: COMPANY SNAPSHOT
TABLE 123. CREE, INC.: OPERATING SEGMENTS
TABLE 124. CREE, INC.: PRODUCT PORTFOLIO
TABLE 125. CREE, INC.: KEY STRATEGIC MOVES AND DEVELOPMENTS
TABLE 126. SAMSUNG ELECTRONICS CO. LTD.:KEY EXECUTIVES
TABLE 127. SAMSUNG ELECTRONICS CO. LTD.: COMPANY SNAPSHOT
TABLE 128. SAMSUNG ELECTRONICS CO. LTD.: OPERATING SEGMENTS
TABLE 129. SAMSUNG ELECTRONICS CO. LTD.: PRODUCT PORTFOLIO
TABLE 130. SAMSUNG ELECTRONICS CO. LTD.: KEY STRATEGIC MOVES AND DEVELOPMENTS
TABLE 131. RENESAS ELECTRONICS CORPORATION:KEY EXECUTIVES
TABLE 132. RENESAS ELECTRONICS CORPORATION: COMPANY SNAPSHOT
TABLE 133. RENESAS ELECTRONICS CORPORATION: OPERATING SEGMENTS
TABLE 134. RENESAS ELECTRONICS CORPORATION: PRODUCT PORTFOLIO
TABLE 135. NXP SEMICONDUCTORS N.V.:KEY EXECUTIVES
TABLE 136. NXP SEMICONDUCTORS N.V.: COMPANY SNAPSHOT
TABLE 137. NXP: PRODUCT PORTFOLIO
TABLE 138. STMICROELECTRONICS N.V.:KEY EXECUTIVES
TABLE 139. COMPANY SNAPSHOT
TABLE 140. STMICROELECTRONICS: OPERATING SEGMENTS
TABLE 141. RENESAS: PRODUCT PORTFOLIO
TABLE 142. STMICROELECTRONICS N.V.:KEY EXECUTIVES
TABLE 143. INFINEON TECHNOLOGIES AG: COMPANY SNAPSHOT
TABLE 144. INFINEON TECHNOLOGIES AG: OPERATING SEGMENTS
TABLE 145. INFINEON TECHNOLOGIES AG: PRODUCT PORTFOLIO
TABLE 146. INFINEON TECHNOLOGIES AG: KEY STRATEGIC MOVES AND DEVELOPMENTS
TABLE 147. TEXAS INSTRUMENTS INCORPORATED:KEY EXECUTIVES
TABLE 148. TEXAS INSTRUMENTS INCORPORATED: COMPANY SNAPSHOT
TABLE 149. TI: OPERATING SEGMENTS
TABLE 150. TI: PRODUCT PORTFOLIO
TABLE 151. TAIWAN SEMICONDUCTOR MANUFACTURING COMPANY LIMITED:KEY EXECUTIVES
TABLE 152. TAIWAN SEMICONDUCTOR MANUFACTURING COMPANY LIMITED: COMPANY SNAPSHOT
TABLE 153. TAIWAN SEMICONDUCTOR MANUFACTURING COMPANY LIMITED: PRODUCT PORTFOLIO
TABLE 154. QORVO, INC.:KEY EXECUTIVES
TABLE 155. QORVO, INC.: COMPANY SNAPSHOT
TABLE 156. QORVO, INC.: OPERATING SEGMENTS
TABLE 157. QORVO, INC.: PRODUCT PORTFOLIO
LIST OF FIGURES
FIGURE 01. KEY MARKET SEGMENTS
FIGURE 02. EXECUTIVE SUMMARY
FIGURE 03. EXECUTIVE SUMMARY
FIGURE 04. EXECUTIVE SUMMARY
FIGURE 05. TOP IMPACTING FACTORS
FIGURE 06. TOP INVESTMENT POCKETS
FIGURE 07. TOP WINNING STRATEGIES, BY YEAR, 2018–2020
FIGURE 08. TOP WINNING STRATEGIES, BY YEAR, 2018–2020
FIGURE 09. TOP WINNING STRATEGIES, BY COMPANY, 2018–2020
FIGURE 10. MODERATE-TO-HIGH BARGAINING POWER OF SUPPLIERS
FIGURE 11. MODERATE-TO-HIGH THREAT OF NEW ENTRANTS
FIGURE 12. MODERATE THREAT OF SUBSTITUTES
FIGURE 13. MODERATE INTENSITY OF RIVALRY
FIGURE 14. MODERATE BARGAINING POWER OF BUYERS
FIGURE 15. KEY PLAYER POSITIONING (2019)
FIGURE 16. GLOBAL COMPOUND SEMICONDUCTOR MARKET SHARE, BY TYPE, 2019–2027 (%)
FIGURE 17. COMPARATIVE SHARE ANALYSIS OF GLOBAL COMPOUND SEMICONDUCTOR MARKET FOR III-V COMPOUND SEMICONDUCTOR, BY COUNTRY, 2019 & 2027 (%)
FIGURE 18. COMPARATIVE SHARE ANALYSIS OF GLOBAL COMPOUND SEMICONDUCTOR MARKET FOR II-VI COMPOUND SEMICONDUCTOR, BY COUNTRY, 2019 & 2027 (%)
FIGURE 19. COMPARATIVE SHARE ANALYSIS OF GLOBAL COMPOUND SEMICONDUCTOR MARKET FOR SAPPHIRE, BY COUNTRY, 2019 & 2027 (%)
FIGURE 20. COMPARATIVE SHARE ANALYSIS OF GLOBAL COMPOUND SEMICONDUCTOR MARKET FOR IV-IV COMPOUND SEMICONDUCTOR, BY COUNTRY, 2019 & 2027 (%)
FIGURE 21. COMPARATIVE SHARE ANALYSIS OF GLOBAL COMPOUND SEMICONDUCTOR MARKET FOR OTHERS, BY COUNTRY, 2019 & 2027 (%)
FIGURE 22. GLOBAL COMPOUND SEMICONDUCTOR MARKET SHARE, BY DEPOSITION TECHNOLOGY, 2019–2027 (%)
FIGURE 23. COMPARATIVE SHARE ANALYSIS OF GLOBAL COMPOUND SEMICONDUCTOR MARKET FOR CHEMICAL VAPOR DESPOSITION, BY COUNTRY, 2019 & 2027 (%)
FIGURE 24. COMPARATIVE SHARE ANALYSIS OF GLOBAL COMPOUND SEMICONDUCTOR MARKET FOR MOLECULAR BEAM EPITAXY, BY COUNTRY, 2019 & 2027 (%)
FIGURE 25. COMPARATIVE SHARE ANALYSIS OF GLOBAL COMPOUND SEMICONDUCTOR MARKET FOR HYDRIDE VAPOR PHASE EPITAXY, BY COUNTRY, 2019 & 2027 (%)
FIGURE 26. COMPARATIVE SHARE ANALYSIS OF GLOBAL COMPOUND SEMICONDUCTOR MARKET FOR AMMONOTHERMAL, BY COUNTRY, 2019 & 2027 (%)
FIGURE 27. COMPARATIVE SHARE ANALYSIS OF GLOBAL COMPOUND SEMICONDUCTOR MARKET FOR ATOMIC LAYER DEPOSITION, BY COUNTRY, 2019 & 2027 (%)
FIGURE 28. COMPARATIVE SHARE ANALYSIS OF GLOBAL COMPOUND SEMICONDUCTOR MARKET FOR OTHERS, BY COUNTRY, 2019 & 2027 (%)
FIGURE 29. GLOBAL COMPOUND SEMICONDUCTOR MARKET SHARE, BY PRODUCT, 2019–2027 (%)
FIGURE 30. COMPARATIVE SHARE ANALYSIS OF GLOBAL COMPOUND SEMICONDUCTOR MARKET FOR POWER SEMICONDUCTOR, BY COUNTRY, 2019 & 2027 (%)
FIGURE 31. COMPARATIVE SHARE ANALYSIS OF GLOBAL COMPOUND SEMICONDUCTOR MARKET FOR TRANSISTOR, BY COUNTRY, 2019 & 2027 (%)
FIGURE 32. COMPARATIVE SHARE ANALYSIS OF GLOBAL COMPOUND SEMICONDUCTOR MARKET FOR INTEGRATED CIRCUITS, BY COUNTRY, 2019 & 2027 (%)
FIGURE 33. COMPARATIVE SHARE ANALYSIS OF GLOBAL COMPOUND SEMICONDUCTOR MARKET FOR RECTIFIERS AND DIODES, BY COUNTRY, 2019 & 2027 (%)
FIGURE 34. COMPARATIVE SHARE ANALYSIS OF GLOBAL COMPOUND SEMICONDUCTOR MARKET FOR OTHERS, BY COUNTRY, 2019 & 2027 (%)
FIGURE 35. GLOBAL COMPOUND SEMICONDUCTOR MARKET SHARE, BY APPLICATION, 2019–2027 (%)
FIGURE 36. COMPARATIVE SHARE ANALYSIS OF GLOBAL COMPOUND SEMICONDUCTOR MARKET FOR IT & TELECOM, BY COUNTRY, 2019 & 2027 (%)
FIGURE 37. COMPARATIVE SHARE ANALYSIS OF GLOBAL COMPOUND SEMICONDUCTOR MARKET FOR INDUSTRIAL AND ENERGY & POWER, BY COUNTRY, 2019 & 2027 (%)
FIGURE 38. COMPARATIVE SHARE ANALYSIS OF GLOBAL COMPOUND SEMICONDUCTOR MARKET FOR AEROSPACE & DEFENSE, BY COUNTRY, 2019 & 2027 (%)
FIGURE 39. COMPARATIVE SHARE ANALYSIS OF GLOBAL COMPOUND SEMICONDUCTOR MARKET FOR AUTOMOTIVE, BY COUNTRY, 2019 & 2027 (%)
FIGURE 40. COMPARATIVE SHARE ANALYSIS OF GLOBAL COMPOUND SEMICONDUCTOR MARKET FOR CONSUMER ELECTRONICS, BY COUNTRY, 2019 & 2027 (%)
FIGURE 41. COMPARATIVE SHARE ANALYSIS OF GLOBAL COMPOUND SEMICONDUCTOR MARKET FOR HALTHCARE, BY COUNTRY, 2019 & 2027 (%)
FIGURE 42. GLOBAL COMPOUND SEMICONDUCTOR MARKET, BY REGION, 2019-2027 (%)
FIGURE 43. COMPARATIVE SHARE ANALYSIS OF COMPOUND SEMICONDUCTOR MARKET, BY COUNTRY, 2019–2027 (%)
FIGURE 44. U. S. COMPOUND SEMICONDUCTOR MARKET, 2019–2027 ($MILLION)
FIGURE 45. CANADA COMPOUND SEMICONDUCTOR MARKET, 2019–2027 ($MILLION)
FIGURE 46. MEXICO COMPOUND SEMICONDUCTOR MARKET, 2019–2027 ($MILLION)
FIGURE 47. COMPARATIVE SHARE ANALYSIS OF COMPOUND SEMICONDUCTOR MARKET, BY COUNTRY, 2019–2027 (%)
FIGURE 48. UK COMPOUND SEMICONDUCTOR MARKET, 2019–2027 ($MILLION)
FIGURE 49. GERMANY COMPOUND SEMICONDUCTOR MARKET, 2019–2027 ($MILLION)
FIGURE 50. FRANCE COMPOUND SEMICONDUCTOR MARKET, 2019–2027 ($MILLION)
FIGURE 51. REST OF EUROPE COMPOUND SEMICONDUCTOR MARKET, 2019–2027 ($MILLION)
FIGURE 52. COMPARATIVE SHARE ANALYSIS OF COMPOUND SEMICONDUCTOR MARKET, BY COUNTRY, 2019–2027 (%)
FIGURE 53. CHINA COMPOUND SEMICONDUCTOR MARKET, 2019–2027 ($MILLION)
FIGURE 54. JAPAN COMPOUND SEMICONDUCTOR MARKET, 2019–2027 ($MILLION)
FIGURE 55. INDIA COMPOUND SEMICONDUCTOR MARKET, 2019–2027 ($MILLION)
FIGURE 56. AUSTRALIA COMPOUND SEMICONDUCTOR MARKET, 2019–2027 ($MILLION)
FIGURE 57. REST OF ASIA-PACIFIC COMPOUND SEMICONDUCTOR MARKET, 2019–2027 ($MILLION)
FIGURE 58. COMPARATIVE SHARE ANALYSIS OF COMPOUND SEMICONDUCTOR MARK
The compound semiconductor market is highly competitive, owing to the strong presence of the existing vendors. Compound semiconductor technology vendors, who have access to extensive technical and financial resources are anticipated to gain a competitive edge over their rivals, as they have the capacity to cater to the global market requirements. The competitive environment in this market is expected to further intensify with increase in technological innovations, product extensions, and different strategies adopted by the key vendors.
The compound semiconductors market holds high potential in the IT & telecom, industrial, transport, consumer electronics, and healthcare sector. The current business scenario experiences rapid development in smart transport and connectivity leading to readiness to adopt smart sensors, particularly in the developed and the developing regions such as North America, Asia-Pacific, and Europe. Companies in this industry adopt various innovative techniques to provide customers with advanced and innovative features.
Rapid adoption of smart infrastructure in residential and commercial infrastructure, the penetration of IoT and AI based technologies and increased use of smart devices in medical monitoring drive the growth of the global market for smart sensors. However, high cost of products in the developing countries are the barriers to early adoption. This hampers the market growth. Furthermore, technological development by the emerging economies in Asia-Pacific boosts the embedded processors market growth. The ambitious project of 100 smart cities in India is projected to surge the adoption of smarter solutions, since the project is based on the concept of using smart sensors and wireless technology to establish a wide connectivity network.
The smart sensor market provides numerous growth opportunities to the market players such as NXP Semiconductors, Rapid adoption of smart technologies in digital economy, industrial sector, defense & security sector, the penetration of IoT and AI based technologies, and increased use of smart devices in medical monitoring drive the growth of the global compound semiconductors market.
However, increase in cost of compound semiconductor wafer manufacturing in the developing countries is the barriers to early adoption. This hampers the market growth. Furthermore, technological development by the emerging economies in Asia-Pacific boosts the compound semiconductors market growth. Moreover, increase in defense budget globally is the major factor for the growth of the market. Furthermore, incorporation of compound semiconductor devices in electronic warfare and advanced RADARs boosts the growth of the market.
The compound semiconductors market provides numerous growth opportunities to the market players such as NXP Semiconductors, STMicroelectronics, Renesas Electronics, and Texas Instruments.
Q1. At what CAGR, the Global Compound Semiconductor Market will expand from 2020 - 2027?
A. The Global Compound Semiconductor Market is expected to grow at a CAGR of 11.1% from 2020 to 2027.
Q2. What will be the market value of Compound Semiconductor Market by the end of 2027?
A. The Compound Semiconductor Market is projected to reach $212.9 billion by 2027.
Q3. How can I get sample report of Compound Semiconductor Market?
A. To get the latest version of sample report
Q4. Which are the factors that drives Compound Semiconductor Market Growth?
A. Advantage of compound semiconductor wafers over silicon-based wafers, increase in demand for compound semiconductor epitaxial wafer in consumer electronics, and emerging trends toward wafers in automotive industry drive the compound semiconductor market growth.
Q5. Who are the leading players in Compound Semiconductor Market?
A. The key players profiled in the report include Cree Inc., Nichia Corporation, Samsung Electronics, Qorvo, NXP Semiconductor N.V., Taiwan Semiconductor Manufacturing Company Ltd., Renesas Electronics Corporation, Texas Instruments Inc., STMicroelectronics NV, and Infineon Technologies AG.
Q6. How can I get company profiles of top ten players of Compound Semiconductor Market?
A. On the basis of top growing big corporations, we select top 10 players.
Q7. What are the segments of Compound Semiconductor Market?
A. The Compound Semiconductor Market is segmented on the basis of type, deposition technology, product, application, and region.
Q8. What are the key growth strategies of Compound Semiconductor Market Players?
A. The key growth strategies of Compound Semiconductor market players include product launch, partnership, acquisition, expansion, product enhancement, and collaboration.
Q9. By Type, which segment would exhibit the highest CAGR during 2020 - 2027?
A. Sapphire segment would exhibit the highest CAGR of 13.5% during 2020 - 2027.
Q10. By Region which segment holds a dominant position in 2019 and would maintain the lead over the forecast period?
A. Asia-Pacific region holds a dominant position in 2019 and would maintain the lead over the forecast period.
Download Sample
Purchase Full Report of
Compound Semiconductor Market
- Online Only
- $3,456
- Online cloud access only
- Restricted print, copy, paste & download
- Read only
- Free quarterly industry update
- Free report update (Within 180 days)
- Subscription model sign in
- Data Pack
- $3,840
- Restricted to one authorized user
- One print only
- Available in
Excel - Free quarterly industry update
- Free report update (Within 180 days)
- Subscription model sign in
- Single User
- $5,769
- Restricted to one authorized user
- One print only
- Available in Excel & PDF
- Free quarterly industry update
- Free report update (Within 180 days)
- Subscription model sign in
- Five Users
- $6,450
- Limited to five authorized users
- Print upto five copies
- Available in Excel & PDF
- Free quarterly industry update
- Free report update (Within 180 days)
- Subscription model sign in
-
Enterprise
License/PDF - $8,995
- Unlimited
within
company/enterprise - Available in Excel & PDF
- Free quarterly industry update
- Free report update (Within 180 days)
- Subscription model sign in
- Library Membership
- $ 699/mo
- Published Content
E-access - Company Profiles
E-access - Newly Added Content Access
- 10 PDF
Downloads - 5 Excel Data
Pack Downloads - 250 Company Profiles PDF Downloads
-
Start reading instantly.
Buy Now
This title and over 12,000+ are available on the Avenue Library. T&C*.
*Taxes/Fees, if applicable will be added during checkout. All prices in USD
Why Allied Market Research?
Infallible Methodology
To ensure high-level data integrity, accurate analysis, and impeccable forecasts
Analyst Support
For complete satisfaction
Customization
On-demand customization of scope of the report to exactly meet your needs
TARGETED MARKET VIEW
Targeted market view to provide pertinent information and save time of readers
Featured Reports
Get fresh content delivered
Get insights on topics that are crucial for your business. Stay abreast of your interest areas.
Why Allied Market Research?
Infallible Methodology
To ensure high-level data integrity, accurate analysis, and impeccable forecasts
Analyst Support
For complete satisfaction
Customization
On-demand customization of scope of the report to exactly meet your needs
TARGETED MARKET VIEW
Targeted market view to provide pertinent information and save time of readers