
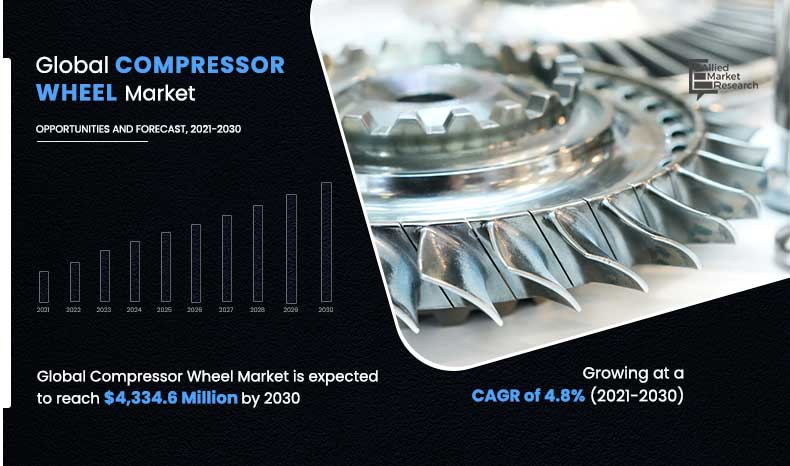
The compressor wheel market was valued at $2,726.3 million in 2020, and is expected to reach $4,334.6 million by 2030, registering a CAGR of 4.8% from 2021 to 2030.
Compressor wheel are components that are coupled with exhaust gas turbine by a solid shaft in a turbocharger assembly. The turbocharger is used to boost the intake air pressure of an internal combustion engine. Turbochargers are operated using gasoline and diesel as their fuel. Furthermore, the compressor wheel, a part of turbochargers, is offered in the market by OEMs or third-party vendors in the aftermarket.
With implementation of stringent norms to curb the carbon emission, vehicle manufacturers are focusing on developing and manufacturing lightweight engines, which will help to increase the fuel efficiency of the vehicle and reduce carbon emissions. This leads to the development of new turbochargers, which contributes toward the growth of the market. In addition, surge in demand for vehicles globally with high fuel efficiency and high-power output is expected to boost the demand for turbochargers. Durable and efficient compressor wheels are used to increase the efficiency of the automobile engines. All these factors collectively drive the growth of the global compressor wheel market. However, adoption of electric vehicles is expected to decrease the use of turbocharged engines in vehicles, which, in turn, is likely to limit the demand for compressor wheels, thus restraining the growth of the global market. Moreover, during the outbreak of COVID-19, manufacturing and logistic industries were majorly affected. Manufacturing activities were halted or restricted to a huge extent. Construction and transportation activities along with their supply chains were hampered on a global level. This led to decline in manufacturing of compressor wheels, which directly hampered growth of the market. On the contrary, industries are gradually resuming their regular manufacturing and services. This is further expected to lead to re-initiation of turbochargers and compressor wheel companies at their full-scale capacities, which is expected to help the compressor wheel market to recover by end of 2021.
On the contrary, rapid urbanization and industrialization in developing countries have given rise to R&D activities, which is expected to create remunerative opportunities for the expansion of the compressor wheel market growth.
The compressor wheel market is segmented into material, application, sales type, and region. By material, the market is segregated into cast iron and aluminum. The applications covered in the study include automotive engine and stationary engine. On the basis of sales type, the market is bifurcated into OEMs and aftermarket. Region wise, it is analyzed across North America (the U.S., Canada, and Mexico), Europe (Germany, the UK, France, Spain, and rest of Europe), Asia-Pacific (China, Japan, South Korea, India, and rest of Asia-Pacific), and LAMEA (Latin America, the Middle East, and Africa).
By Materiale
Aluminum segment has the largest share in Compressor Wheel Market
On the basis of material, in 2020, the aluminum segment dominated the compressor wheel market, and is expected to witness growth at the highest CAGR during the forecast period. By application, the automotive engine segment led the market in 2020, in terms of revenue; however, the stationary engine segment is anticipated to register highest CAGR during the forecast period. Depending on sales type, the OEMs segment exhibited the highest growth in 2020, in terms of revenue. Conversely, the aftermarket segment is anticipated to register the highest CAGR during the forecast period. Region wise, Europe led the market in 2020, in terms of revenue, however, LAMEA is anticipated to register highest CAGR during the forecast period.
By Application
Automotive engine segment holds dominant position in 2020
Competition analysis
The major players profiled in the compressor wheel market include BorgWarner Inc., Doncasters Group, Garrett Motion Inc., KTS, Melett Ltd., Nelcon Motor Company, Owen Developments, Turbotech Precision Products Ltd., UACJ Corporation, and Wabtec Corporation. Major companies in the market have adopted business expansion strategy to offer better products and services to customers in the compressor wheel market.
Key Benefits For Stakeholders
- The report provides an extensive analysis of the current trends and future estimations of the compressor wheel market.
- In-depth compressor wheel market analysis is conducted by estimations for the key segments between 2021 and 2030.
- Extensive analysis of the market is conducted by following key product positioning and monitoring of top competitors within the market framework.
- A comprehensive analysis of four major regions is provided to determine the prevailing opportunities.
- The market forecast analysis from 2021 to 2030 is included in the report.
- The key market players operating in the market are profiled in this report and their strategies are analyzed thoroughly, which help to understand the competitive outlook of the market industry.
Compressor Wheel Market Report Highlights
| Aspects | Details |
| By Material |
|
| By APPLICATION |
|
| By SALES TYPE |
|
| By Region |
|
| Key Market Players | Doncasters Group, Melett Ltd., KTS, BorgWarner Inc., Garrett Motion Inc, UACJ Corporation, Owen Developments, Wabtec Corporation, Nelcon Motor Company, Turbotech Precision Products Ltd |
Analyst Review
The growth of the compressor wheel market is majorly driven by enactment of stringent emission norms by government bodies of the countries or organizations such as European Union. In addition, rise in demand for high-power vehicles to carry out heavy tasks and transportation is driving the compressor wheel market globally. The compressor wheel market was valued at $2,726.3 million in 2020, and is expected to reach $4,334.6 million by 2030, registering a CAGR of 4.8% from 2021 to 2030.
However, rise in demand for electric vehicles will lead to decline in installation of turbochargers in automobiles, which, in turn, is expected to decline the sales of for compressor wheels. On the contrary, increase in R&D activities is expected to create opportunities for growth of the compressor wheel market during the forecast period.
Major companies in the market have adopted business expansion as their key strategy to offer better services to customers in the compressor wheel market.
The global compressor wheel market size was valued at $2,726.3 million in 2020, and is projected to reach $4,334.6 million by 2030, growing at a CAGR of 4.8% from 2020 to 2030.
The forecast period considered for the global compressor wheel market is 2021 to 2030, wherein, 2020 is the base year, 2021 is the estimated year, and 2030 is the forecast year.
To get latest version of global compressor wheel market report can be obtained on demand from the website.
The base year considered in the global compressor wheel market report is 2020.
The top companies holding the market share in the global compressor wheel market report include BorgWarner Inc., Doncasters Group, Garrett Motion Inc., KTS, Melett Ltd., Nelcon Motor Company, Owen Developments, Turbotech Precision Products Ltd, UACJ Corporation and Wabtec Corporation.
The top ten market players are selected based on two key attributes - competitive strength and market positioning
Which is the most influencing segment growing in the global compressor wheel market report?
By application, the automotive engine segment is the highest share holder of global compressor wheel market.
The report contains an exclusive company profile section, where leading 10 companies in the market are profiled. These profiles typically cover company overview, geographical presence, market dominance (in terms of revenue and volume sales), various strategies and recent developments.
The market value of the global compressor wheel market is $2,832.7 million in 2021.
Loading Table Of Content...

