0
2022
Computer-aided Drug Discovery Market

Computer-Aided Drug Discovery Market

by Type (Structure Based Drug Design, Ligand-Based Drug Design, Sequence-Based Approaches), by Therapeutic Area (Oncology, Neurology, Cardiovascular Disease, Respiratory Disease, Diabetes, Others), by End User (Pharmaceutical Companies, Biotechnology Companies, Research Laboratories): Global Opportunity Analysis and Industry Forecast, 2021-2030

✷  Report Code: A16823
Jun 2022 | Pages: 180
Tables: 150
Charts: 59
  • Formats*:

  • pdf

    Single User License, Five User
    License & Enterprise User License

  • xls

    Data Pack Excel License

  • ppt

    It comes with the additional cost
    of $2500.00 contact sales.


Computer-Aided Drug Discovery Market Research, 2030

The global computer-aided drug discovery market size was $2.9 billion in 2021, and is projected to reach $7.5 billion by 2030, growing at a CAGR of 11.48% from 2022 to 2030.

Despite the fact that the novel coronavirus pandemic had a devastating effect on several industries, the computer-aided drug discovery market grew significantly during this time.

Computer-Aided Drug Discovery Market, Computer-Aided Drug Discovery Market size, Computer-Aided Drug Discovery Market share, Computer-Aided Drug Discovery Market trends, Computer-Aided Drug Discovery Market growth, Computer-Aided Drug Discovery Market forecast, Computer-Aided Drug Discovery Market analysis, Computer-Aided Drug Discovery Market opportunity

The computer-aided drug discovery market is segmented into Type, Therapeutic Area and End User.

Computer-aided drug discovery (CADD) is a cutting-edge computational method for identifying and implementing potential leads in drug discovery. Computer-aided drug design encompasses computational chemistry, molecular modelling, molecular design, and rational drug design. CADD is being used to improve the quality of leads that have been identified. CADD methods are gaining acceptance and popularity in both academic and pharmaceutical circles. CADD saves time; it is quick and cheap.

Increased cases of chronic and unknown diseases are expected to accelerate the need for rapid drug development, propelling the computer-aided drug discovery market growth in the forecast timeframe. CADD is a modern technique in which researchers and analysts analyze, design, develop, monitor, and study a three-dimensional structure of the target disease molecule and its complement biomolecule ligand using a combination of software. This method is popular among researchers because it speeds up research and drug discovery. Strategic alliances among market players, combined with rising drug demand, are expected to propel the global market.

A shortage of skilled labor to operate computer-aided drug discovery solutions, on the other hand, may stymie the global market growth. Lower product penetration in emerging economies is also limiting the global drug discovery industry.

The global CADD market is segmented on the basis of type, therapeutic area, end-user, and region. By type, the market is classified into structure-based drug design (SBDD), ligand-based drug design (LBDD), and sequence-based approaches. By therapeutic area, the analysis has been divided into oncology, neurology, cardiovascular disease, respiratory disease, diabetes, and others. By end-user, the market has been divided into pharmaceutical companies, biotechnology companies, and research laboratories. By region, the market is analyzed across North America, Europe, Asia-Pacific, and LAMEA.

The key players profiled in this report include BOCSCI Inc., Bioduro-Sundia, Schrödinger, Inc., Aragen Life Sciences Pvt. Ltd., Aris Pharmaceuticals, Inc, Charles River Laboratories, Bayer AG, AstraZeneca, and Albany Molecular Research Inc. (AMRI).
Computer-Aided Drug Discovery Market

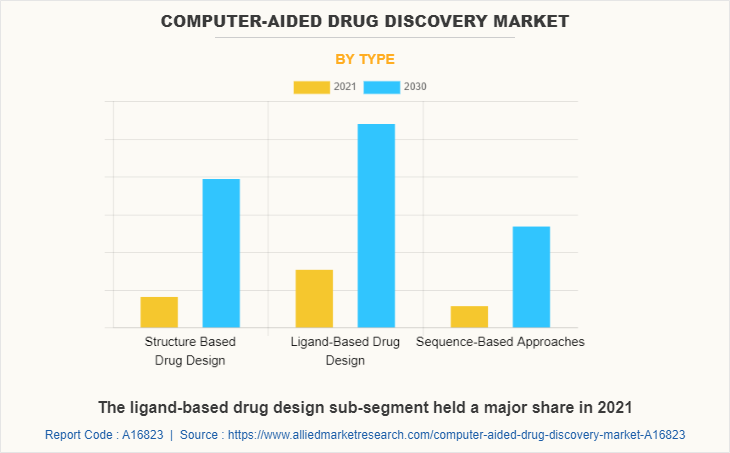
By type, structure-based drug design sub-segment is projected to generate the fastest growth. The traditional method of drug discovery is structure-based drug design, which uses NMR, cryo-EM, and X-ray crystallography for compound optimization and design. Furthermore, technological advancements and rising demand for new drugs for various diseases are some of the driving factors for structure-based drug design type of computer-aided drug discovery in the global market over the forecast period.
Computer-Aided Drug Discovery Market

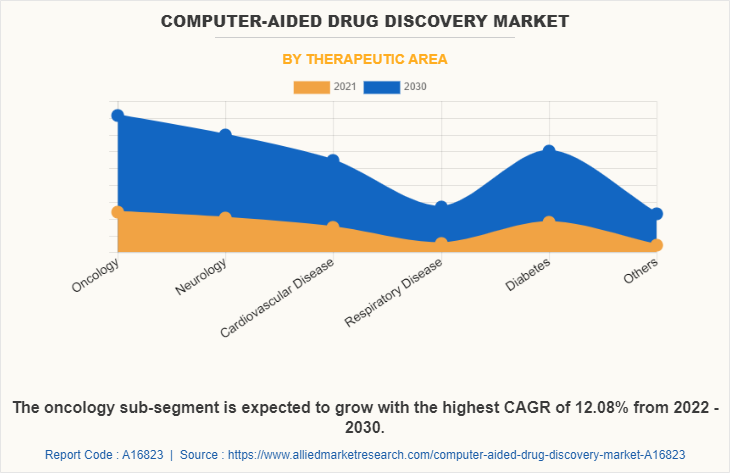
By therapeutic area, oncology sub-segment is expected to have a dominant share during the forecast period. Oncology is a medical specialty that deals with treatment, prevention, and diagnosis of cancer. There are various types of cancer, and determining the type of medication required for a specific cancer is a complicated process. Despite extensive research, cancer treatment has been one of the major concerns around the world due to medication resistance. As a result, there is a surge in demand for cancer drugs that are efficient and cost-effective. These key elements have the potential to accelerate segment growth during the forecast period.
Computer-Aided Drug Discovery Market

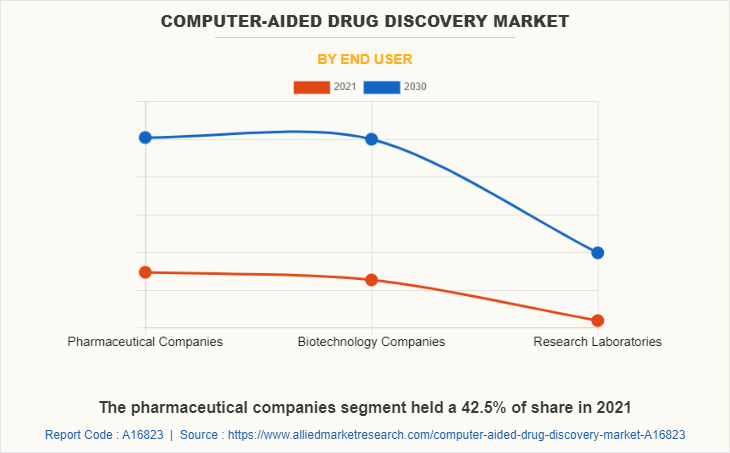
By end user, pharmaceutical companies sub-segment is expected to have the dominant share during the forecast period. The pharmaceutical companies sub-segment of the computer-aided drug discovery market is expected to grow at a significant CAGR during the forecast period and generate significant revenue. Various approaches have been used in recent years to identify chemical compounds that need to be developed and marketed. In recent years, 5,000-10,000 drugs have been subjected to laboratory testing before being approved for human use. To develop or discover new drugs, the overall protocol can take up to ten years or more. In the analysis timeframe, such factors are expected to boost the adoption of CADD in the pharmaceutical companies sector.
Computer-Aided Drug Discovery Market

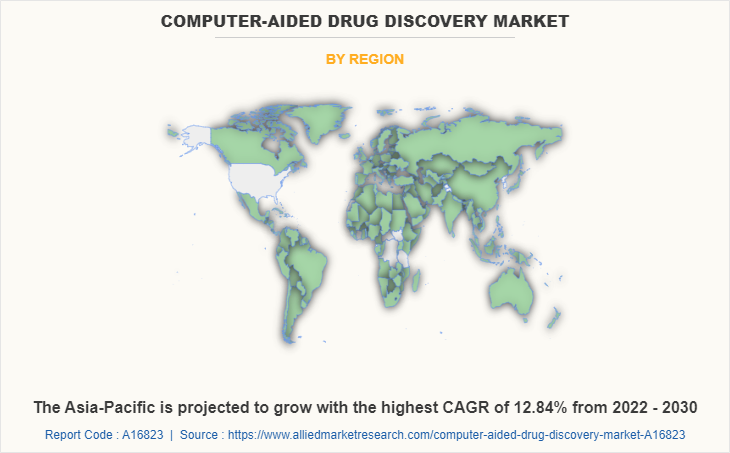
By region, the rapidly increasing number of cancer cases in the United States is expected to boost computer-aided drug discovery market revenue. Cancer is one of the few and most dangerous medical conditions for which there is no cure. In the United States, the disease's prevalence is increasing at an alarming rate. The National Cancer Institute, for example, predicted that on September 25, 2020, 1,806,590 new cancer cases would be diagnosed, with nearly 606,520 people dying from the disease. The use of computer-aided drug discovery in the search for a cancer cure has grown.

KEY BENEFITS FOR STAKEHOLDERS

  • The report provides an in-depth analysis of the global computer-aided drug discovery market trends along with the current and future market forecast.
  • The report provides a computer-aided drug discovery market forecast from 2022 - 2030 and computer-aided drug discovery market share for each segment, region, and country(s).
  • This report highlights the computer-aided drug discovery market opportunities, market drivers, and restraints with the impact analyses during the forecast period.
  • Porter’s five forces analysis helps analyze the potential of the buyers & suppliers and the competitive scenario of the global computer-aided drug discovery market for strategy building.
  • A comprehensive global computer-aided drug discovery market analysis covers factors that drive and restrain the market growth.
  • The qualitative data in this report aims on market dynamics, trends, and developments.

IMPACT OF COVID-19 ON THE GLOBAL COMPUTER-AIDED DRUG DISCOVERY MARKET

  • Despite the fact that the novel coronavirus pandemic had a devastating effect on several industries, the computer-aided drug discovery market grew significantly during this time.
  • Because of increased R&D activities among scientists, researchers, biotechnological and biopharmaceutical companies to limit the spread of the coronavirus disease, the market for computer-aided drug discovery has grown at a faster rate.
  • The increasing transmutation rate of coronavirus has motivated scientists worldwide to develop an effective treatment or drug against this lethal virus. As a result, the importance of research and drug discovery has skyrocketed, driving market growth.
  • Because of the coronavirus pandemic in 2020, many companies have improved their technology sector by investing a large portion of their revenue in research and development. Some businesses have used partnerships and collaboration to expand their market presence.

Computer-Aided Drug Discovery Market Report Highlights

Aspects Details
By Type
  • Structure Based Drug Design
  • Ligand-Based Drug Design
  • Sequence-Based Approaches
By Therapeutic Area
  • Oncology
  • Neurology
  • Cardiovascular Disease
  • Respiratory Disease
  • Diabetes
  • Others
By End User
  • Pharmaceutical Companies
  • Biotechnology Companies
  • Research Laboratories
By Region
  • North America  (U.S., Canada, Mexico)
  • Europe  (Germany, United Kingdom, France, Spain, Italy, Rest of Europe)
  • Asia-Pacific  (China, Japan, India, South Korea, Australia, Rest Of Asia Pacific)
  • LAMEA  (Brazil, Saudi Arabia, UAE, South Africa, Rest of LAMEA)
Key Market Players Bayer AG, BOC Sciences, Aragen Life Sciences Pvt. Ltd., AstraZeneca plc, Schrödinger, Inc., charles river laboratories, Albany Molecular Research Inc. (AMRI), Bioduro-Sundia, Aris Pharmaceuticals, Inc.
 
  • CHAPTER 1:INTRODUCTION

    • 1.1.Report description

    • 1.2.Key market segments

    • 1.3.Key benefits to the stakeholders

    • 1.4.Research Methodology

      • 1.4.1.Secondary research

      • 1.4.2.Primary research

      • 1.4.3.Analyst tools and models

  • CHAPTER 2:EXECUTIVE SUMMARY

    • 2.1.Key findings of the study

    • 2.2.CXO Perspective

  • CHAPTER 3:MARKET OVERVIEW

    • 3.1.Market definition and scope

    • 3.2.Key findings

      • 3.2.1.Top investment pockets

    • 3.3.Porter’s five forces analysis

    • 3.4.Top player positioning

    • 3.5.Market dynamics

      • 3.5.1.Drivers

      • 3.5.2.Restraints

      • 3.5.3.Opportunities

    • 3.6.COVID-19 Impact Analysis on the market

    • 3.7.Regulatory Guidelines

    • 3.8.Value Chain Analysis

    • 3.9.Market Share Analysis

    • 3.10.Key Regulation Analysis

    • 3.11.Patent Landscape

  • CHAPTER 4: COMPUTER-AIDED DRUG DISCOVERY MARKET, BY TYPE

    • 4.1 Overview

      • 4.1.1 Market size and forecast

    • 4.2 Structure Based Drug Design

      • 4.2.1 Key market trends, growth factors and opportunities

      • 4.2.2 Market size and forecast, by region

      • 4.2.3 Market analysis by country

    • 4.3 Ligand-Based Drug Design

      • 4.3.1 Key market trends, growth factors and opportunities

      • 4.3.2 Market size and forecast, by region

      • 4.3.3 Market analysis by country

    • 4.4 Sequence-Based Approaches

      • 4.4.1 Key market trends, growth factors and opportunities

      • 4.4.2 Market size and forecast, by region

      • 4.4.3 Market analysis by country

  • CHAPTER 5: COMPUTER-AIDED DRUG DISCOVERY MARKET, BY THERAPEUTIC AREA

    • 5.1 Overview

      • 5.1.1 Market size and forecast

    • 5.2 Oncology

      • 5.2.1 Key market trends, growth factors and opportunities

      • 5.2.2 Market size and forecast, by region

      • 5.2.3 Market analysis by country

    • 5.3 Neurology

      • 5.3.1 Key market trends, growth factors and opportunities

      • 5.3.2 Market size and forecast, by region

      • 5.3.3 Market analysis by country

    • 5.4 Cardiovascular Disease

      • 5.4.1 Key market trends, growth factors and opportunities

      • 5.4.2 Market size and forecast, by region

      • 5.4.3 Market analysis by country

    • 5.5 Respiratory Disease

      • 5.5.1 Key market trends, growth factors and opportunities

      • 5.5.2 Market size and forecast, by region

      • 5.5.3 Market analysis by country

    • 5.6 Diabetes

      • 5.6.1 Key market trends, growth factors and opportunities

      • 5.6.2 Market size and forecast, by region

      • 5.6.3 Market analysis by country

    • 5.7 Others

      • 5.7.1 Key market trends, growth factors and opportunities

      • 5.7.2 Market size and forecast, by region

      • 5.7.3 Market analysis by country

  • CHAPTER 6: COMPUTER-AIDED DRUG DISCOVERY MARKET, BY END USER

    • 6.1 Overview

      • 6.1.1 Market size and forecast

    • 6.2 Pharmaceutical Companies

      • 6.2.1 Key market trends, growth factors and opportunities

      • 6.2.2 Market size and forecast, by region

      • 6.2.3 Market analysis by country

    • 6.3 Biotechnology Companies

      • 6.3.1 Key market trends, growth factors and opportunities

      • 6.3.2 Market size and forecast, by region

      • 6.3.3 Market analysis by country

    • 6.4 Research Laboratories

      • 6.4.1 Key market trends, growth factors and opportunities

      • 6.4.2 Market size and forecast, by region

      • 6.4.3 Market analysis by country

  • CHAPTER 7: COMPUTER-AIDED DRUG DISCOVERY MARKET, BY REGION

    • 7.1 Overview

      • 7.1.1 Market size and forecast

    • 7.2 North America

      • 7.2.1 Key trends and opportunities

      • 7.2.2 North America Market size and forecast, by Type

      • 7.2.3 North America Market size and forecast, by Therapeutic Area

      • 7.2.4 North America Market size and forecast, by End User

      • 7.2.5 North America Market size and forecast, by country

        • 7.2.5.1 U.S.
          • 7.2.5.1.1 Market size and forecast, by Type
          • 7.2.5.1.2 Market size and forecast, by Therapeutic Area
          • 7.2.5.1.3 Market size and forecast, by End User
        • 7.2.5.2 Canada
          • 7.2.5.2.1 Market size and forecast, by Type
          • 7.2.5.2.2 Market size and forecast, by Therapeutic Area
          • 7.2.5.2.3 Market size and forecast, by End User
        • 7.2.5.3 Mexico
          • 7.2.5.3.1 Market size and forecast, by Type
          • 7.2.5.3.2 Market size and forecast, by Therapeutic Area
          • 7.2.5.3.3 Market size and forecast, by End User
    • 7.3 Europe

      • 7.3.1 Key trends and opportunities

      • 7.3.2 Europe Market size and forecast, by Type

      • 7.3.3 Europe Market size and forecast, by Therapeutic Area

      • 7.3.4 Europe Market size and forecast, by End User

      • 7.3.5 Europe Market size and forecast, by country

        • 7.3.5.1 Germany
          • 7.3.5.1.1 Market size and forecast, by Type
          • 7.3.5.1.2 Market size and forecast, by Therapeutic Area
          • 7.3.5.1.3 Market size and forecast, by End User
        • 7.3.5.2 United Kingdom
          • 7.3.5.2.1 Market size and forecast, by Type
          • 7.3.5.2.2 Market size and forecast, by Therapeutic Area
          • 7.3.5.2.3 Market size and forecast, by End User
        • 7.3.5.3 France
          • 7.3.5.3.1 Market size and forecast, by Type
          • 7.3.5.3.2 Market size and forecast, by Therapeutic Area
          • 7.3.5.3.3 Market size and forecast, by End User
        • 7.3.5.4 Spain
          • 7.3.5.4.1 Market size and forecast, by Type
          • 7.3.5.4.2 Market size and forecast, by Therapeutic Area
          • 7.3.5.4.3 Market size and forecast, by End User
        • 7.3.5.5 Italy
          • 7.3.5.5.1 Market size and forecast, by Type
          • 7.3.5.5.2 Market size and forecast, by Therapeutic Area
          • 7.3.5.5.3 Market size and forecast, by End User
        • 7.3.5.6 Rest of Europe
          • 7.3.5.6.1 Market size and forecast, by Type
          • 7.3.5.6.2 Market size and forecast, by Therapeutic Area
          • 7.3.5.6.3 Market size and forecast, by End User
    • 7.4 Asia-Pacific

      • 7.4.1 Key trends and opportunities

      • 7.4.2 Asia-Pacific Market size and forecast, by Type

      • 7.4.3 Asia-Pacific Market size and forecast, by Therapeutic Area

      • 7.4.4 Asia-Pacific Market size and forecast, by End User

      • 7.4.5 Asia-Pacific Market size and forecast, by country

        • 7.4.5.1 China
          • 7.4.5.1.1 Market size and forecast, by Type
          • 7.4.5.1.2 Market size and forecast, by Therapeutic Area
          • 7.4.5.1.3 Market size and forecast, by End User
        • 7.4.5.2 Japan
          • 7.4.5.2.1 Market size and forecast, by Type
          • 7.4.5.2.2 Market size and forecast, by Therapeutic Area
          • 7.4.5.2.3 Market size and forecast, by End User
        • 7.4.5.3 India
          • 7.4.5.3.1 Market size and forecast, by Type
          • 7.4.5.3.2 Market size and forecast, by Therapeutic Area
          • 7.4.5.3.3 Market size and forecast, by End User
        • 7.4.5.4 South Korea
          • 7.4.5.4.1 Market size and forecast, by Type
          • 7.4.5.4.2 Market size and forecast, by Therapeutic Area
          • 7.4.5.4.3 Market size and forecast, by End User
        • 7.4.5.5 Australia
          • 7.4.5.5.1 Market size and forecast, by Type
          • 7.4.5.5.2 Market size and forecast, by Therapeutic Area
          • 7.4.5.5.3 Market size and forecast, by End User
        • 7.4.5.6 Rest Of Asia Pacific
          • 7.4.5.6.1 Market size and forecast, by Type
          • 7.4.5.6.2 Market size and forecast, by Therapeutic Area
          • 7.4.5.6.3 Market size and forecast, by End User
    • 7.5 LAMEA

      • 7.5.1 Key trends and opportunities

      • 7.5.2 LAMEA Market size and forecast, by Type

      • 7.5.3 LAMEA Market size and forecast, by Therapeutic Area

      • 7.5.4 LAMEA Market size and forecast, by End User

      • 7.5.5 LAMEA Market size and forecast, by country

        • 7.5.5.1 Brazil
          • 7.5.5.1.1 Market size and forecast, by Type
          • 7.5.5.1.2 Market size and forecast, by Therapeutic Area
          • 7.5.5.1.3 Market size and forecast, by End User
        • 7.5.5.2 Saudi Arabia
          • 7.5.5.2.1 Market size and forecast, by Type
          • 7.5.5.2.2 Market size and forecast, by Therapeutic Area
          • 7.5.5.2.3 Market size and forecast, by End User
        • 7.5.5.3 UAE
          • 7.5.5.3.1 Market size and forecast, by Type
          • 7.5.5.3.2 Market size and forecast, by Therapeutic Area
          • 7.5.5.3.3 Market size and forecast, by End User
        • 7.5.5.4 South Africa
          • 7.5.5.4.1 Market size and forecast, by Type
          • 7.5.5.4.2 Market size and forecast, by Therapeutic Area
          • 7.5.5.4.3 Market size and forecast, by End User
        • 7.5.5.5 Rest of LAMEA
          • 7.5.5.5.1 Market size and forecast, by Type
          • 7.5.5.5.2 Market size and forecast, by Therapeutic Area
          • 7.5.5.5.3 Market size and forecast, by End User
  • CHAPTER 8: COMPANY LANDSCAPE

    • 8.1. Introduction

    • 8.2. Top winning strategies

    • 8.3. Product Mapping of Top 10 Player

    • 8.4. Competitive Dashboard

    • 8.5. Competitive Heatmap

    • 8.6. Key developments

  • CHAPTER 9: COMPANY PROFILES

    • 9.1 charles river laboratories

      • 9.1.1 Company overview

      • 9.1.2 Company snapshot

      • 9.1.3 Operating business segments

      • 9.1.4 Product portfolio

      • 9.1.5 Business performance

      • 9.1.6 Key strategic moves and developments

    • 9.2 BOC Sciences

      • 9.2.1 Company overview

      • 9.2.2 Company snapshot

      • 9.2.3 Operating business segments

      • 9.2.4 Product portfolio

      • 9.2.5 Business performance

      • 9.2.6 Key strategic moves and developments

    • 9.3 Bioduro-Sundia

      • 9.3.1 Company overview

      • 9.3.2 Company snapshot

      • 9.3.3 Operating business segments

      • 9.3.4 Product portfolio

      • 9.3.5 Business performance

      • 9.3.6 Key strategic moves and developments

    • 9.4 Schrödinger, Inc.

      • 9.4.1 Company overview

      • 9.4.2 Company snapshot

      • 9.4.3 Operating business segments

      • 9.4.4 Product portfolio

      • 9.4.5 Business performance

      • 9.4.6 Key strategic moves and developments

    • 9.5 Aragen Life Sciences Pvt. Ltd.

      • 9.5.1 Company overview

      • 9.5.2 Company snapshot

      • 9.5.3 Operating business segments

      • 9.5.4 Product portfolio

      • 9.5.5 Business performance

      • 9.5.6 Key strategic moves and developments

    • 9.6 Aris Pharmaceuticals, Inc.

      • 9.6.1 Company overview

      • 9.6.2 Company snapshot

      • 9.6.3 Operating business segments

      • 9.6.4 Product portfolio

      • 9.6.5 Business performance

      • 9.6.6 Key strategic moves and developments

    • 9.7 Bayer AG

      • 9.7.1 Company overview

      • 9.7.2 Company snapshot

      • 9.7.3 Operating business segments

      • 9.7.4 Product portfolio

      • 9.7.5 Business performance

      • 9.7.6 Key strategic moves and developments

    • 9.8 AstraZeneca plc

      • 9.8.1 Company overview

      • 9.8.2 Company snapshot

      • 9.8.3 Operating business segments

      • 9.8.4 Product portfolio

      • 9.8.5 Business performance

      • 9.8.6 Key strategic moves and developments

    • 9.9 Albany Molecular Research Inc. (AMRI)

      • 9.9.1 Company overview

      • 9.9.2 Company snapshot

      • 9.9.3 Operating business segments

      • 9.9.4 Product portfolio

      • 9.9.5 Business performance

      • 9.9.6 Key strategic moves and developments

  • LIST OF TABLES

  • TABLE 1. GLOBAL COMPUTER-AIDED DRUG DISCOVERY MARKET, BY TYPE, 2021-2030,($MILLION)
    TABLE 2. COMPUTER-AIDED DRUG DISCOVERY MARKET REVENUE, FOR STRUCTURE BASED DRUG DESIGN, BY REGION , 2021-2030,($MILLION)
    TABLE 3. COMPUTER-AIDED DRUG DISCOVERY MARKET FOR STRUCTURE BASED DRUG DESIGN BY COUNTRY, 2021-2030,($MILLION)
    TABLE 4. COMPUTER-AIDED DRUG DISCOVERY MARKET REVENUE, FOR LIGAND-BASED DRUG DESIGN, BY REGION , 2021-2030,($MILLION)
    TABLE 5. COMPUTER-AIDED DRUG DISCOVERY MARKET FOR LIGAND-BASED DRUG DESIGN BY COUNTRY, 2021-2030,($MILLION)
    TABLE 6. COMPUTER-AIDED DRUG DISCOVERY MARKET REVENUE, FOR SEQUENCE-BASED APPROACHES, BY REGION , 2021-2030,($MILLION)
    TABLE 7. COMPUTER-AIDED DRUG DISCOVERY MARKET FOR SEQUENCE-BASED APPROACHES BY COUNTRY, 2021-2030,($MILLION)
    TABLE 8. GLOBAL COMPUTER-AIDED DRUG DISCOVERY MARKET, BY THERAPEUTIC AREA, 2021-2030,($MILLION)
    TABLE 9. COMPUTER-AIDED DRUG DISCOVERY MARKET REVENUE, FOR ONCOLOGY, BY REGION , 2021-2030,($MILLION)
    TABLE 10. COMPUTER-AIDED DRUG DISCOVERY MARKET FOR ONCOLOGY BY COUNTRY, 2021-2030,($MILLION)
    TABLE 11. COMPUTER-AIDED DRUG DISCOVERY MARKET REVENUE, FOR NEUROLOGY, BY REGION , 2021-2030,($MILLION)
    TABLE 12. COMPUTER-AIDED DRUG DISCOVERY MARKET FOR NEUROLOGY BY COUNTRY, 2021-2030,($MILLION)
    TABLE 13. COMPUTER-AIDED DRUG DISCOVERY MARKET REVENUE, FOR CARDIOVASCULAR DISEASE, BY REGION , 2021-2030,($MILLION)
    TABLE 14. COMPUTER-AIDED DRUG DISCOVERY MARKET FOR CARDIOVASCULAR DISEASE BY COUNTRY, 2021-2030,($MILLION)
    TABLE 15. COMPUTER-AIDED DRUG DISCOVERY MARKET REVENUE, FOR RESPIRATORY DISEASE, BY REGION , 2021-2030,($MILLION)
    TABLE 16. COMPUTER-AIDED DRUG DISCOVERY MARKET FOR RESPIRATORY DISEASE BY COUNTRY, 2021-2030,($MILLION)
    TABLE 17. COMPUTER-AIDED DRUG DISCOVERY MARKET REVENUE, FOR DIABETES, BY REGION , 2021-2030,($MILLION)
    TABLE 18. COMPUTER-AIDED DRUG DISCOVERY MARKET FOR DIABETES BY COUNTRY, 2021-2030,($MILLION)
    TABLE 19. COMPUTER-AIDED DRUG DISCOVERY MARKET REVENUE, FOR OTHERS, BY REGION , 2021-2030,($MILLION)
    TABLE 20. COMPUTER-AIDED DRUG DISCOVERY MARKET FOR OTHERS BY COUNTRY, 2021-2030,($MILLION)
    TABLE 21. GLOBAL COMPUTER-AIDED DRUG DISCOVERY MARKET, BY END USER, 2021-2030,($MILLION)
    TABLE 22. COMPUTER-AIDED DRUG DISCOVERY MARKET REVENUE, FOR PHARMACEUTICAL COMPANIES, BY REGION , 2021-2030,($MILLION)
    TABLE 23. COMPUTER-AIDED DRUG DISCOVERY MARKET FOR PHARMACEUTICAL COMPANIES BY COUNTRY, 2021-2030,($MILLION)
    TABLE 24. COMPUTER-AIDED DRUG DISCOVERY MARKET REVENUE, FOR BIOTECHNOLOGY COMPANIES, BY REGION , 2021-2030,($MILLION)
    TABLE 25. COMPUTER-AIDED DRUG DISCOVERY MARKET FOR BIOTECHNOLOGY COMPANIES BY COUNTRY, 2021-2030,($MILLION)
    TABLE 26. COMPUTER-AIDED DRUG DISCOVERY MARKET REVENUE, FOR RESEARCH LABORATORIES, BY REGION , 2021-2030,($MILLION)
    TABLE 27. COMPUTER-AIDED DRUG DISCOVERY MARKET FOR RESEARCH LABORATORIES BY COUNTRY, 2021-2030,($MILLION)
    TABLE 28. COMPUTER-AIDED DRUG DISCOVERY MARKET, BY REGION, 2021-2030,($MILLION)
    TABLE 29. NORTH AMERICA COMPUTER-AIDED DRUG DISCOVERY MARKET, BY TYPE, 2021-2030,($MILLION)
    TABLE 30. NORTH AMERICA COMPUTER-AIDED DRUG DISCOVERY MARKET, BY THERAPEUTIC AREA, 2021-2030,($MILLION)
    TABLE 31. NORTH AMERICA COMPUTER-AIDED DRUG DISCOVERY MARKET, BY END USER, 2021-2030,($MILLION)
    TABLE 32. NORTH AMERICA COMPUTER-AIDED DRUG DISCOVERY MARKET, BY COUNTRY, 2021-2030,($MILLION)
    TABLE 33. U.S. COMPUTER-AIDED DRUG DISCOVERY MARKET, BY TYPE, 2021-2030,($MILLION)
    TABLE 34. U.S. COMPUTER-AIDED DRUG DISCOVERY MARKET, BY THERAPEUTIC AREA, 2021-2030,($MILLION)
    TABLE 35. U.S. COMPUTER-AIDED DRUG DISCOVERY MARKET, BY END USER, 2021-2030,($MILLION)
    TABLE 36. CANADA COMPUTER-AIDED DRUG DISCOVERY MARKET, BY TYPE, 2021-2030,($MILLION)
    TABLE 37. CANADA COMPUTER-AIDED DRUG DISCOVERY MARKET, BY THERAPEUTIC AREA, 2021-2030,($MILLION)
    TABLE 38. CANADA COMPUTER-AIDED DRUG DISCOVERY MARKET, BY END USER, 2021-2030,($MILLION)
    TABLE 39. MEXICO COMPUTER-AIDED DRUG DISCOVERY MARKET, BY TYPE, 2021-2030,($MILLION)
    TABLE 40. MEXICO COMPUTER-AIDED DRUG DISCOVERY MARKET, BY THERAPEUTIC AREA, 2021-2030,($MILLION)
    TABLE 41. MEXICO COMPUTER-AIDED DRUG DISCOVERY MARKET, BY END USER, 2021-2030,($MILLION)
    TABLE 42. EUROPE COMPUTER-AIDED DRUG DISCOVERY MARKET, BY TYPE, 2021-2030,($MILLION)
    TABLE 43. EUROPE COMPUTER-AIDED DRUG DISCOVERY MARKET, BY THERAPEUTIC AREA, 2021-2030,($MILLION)
    TABLE 44. EUROPE COMPUTER-AIDED DRUG DISCOVERY MARKET, BY END USER, 2021-2030,($MILLION)
    TABLE 45. EUROPE COMPUTER-AIDED DRUG DISCOVERY MARKET, BY COUNTRY, 2021-2030,($MILLION)
    TABLE 46. GERMANY COMPUTER-AIDED DRUG DISCOVERY MARKET, BY TYPE, 2021-2030,($MILLION)
    TABLE 47. GERMANY COMPUTER-AIDED DRUG DISCOVERY MARKET, BY THERAPEUTIC AREA, 2021-2030,($MILLION)
    TABLE 48. GERMANY COMPUTER-AIDED DRUG DISCOVERY MARKET, BY END USER, 2021-2030,($MILLION)
    TABLE 49. UNITED KINGDOM COMPUTER-AIDED DRUG DISCOVERY MARKET, BY TYPE, 2021-2030,($MILLION)
    TABLE 50. UNITED KINGDOM COMPUTER-AIDED DRUG DISCOVERY MARKET, BY THERAPEUTIC AREA, 2021-2030,($MILLION)
    TABLE 51. UNITED KINGDOM COMPUTER-AIDED DRUG DISCOVERY MARKET, BY END USER, 2021-2030,($MILLION)
    TABLE 52. FRANCE COMPUTER-AIDED DRUG DISCOVERY MARKET, BY TYPE, 2021-2030,($MILLION)
    TABLE 53. FRANCE COMPUTER-AIDED DRUG DISCOVERY MARKET, BY THERAPEUTIC AREA, 2021-2030,($MILLION)
    TABLE 54. FRANCE COMPUTER-AIDED DRUG DISCOVERY MARKET, BY END USER, 2021-2030,($MILLION)
    TABLE 55. SPAIN COMPUTER-AIDED DRUG DISCOVERY MARKET, BY TYPE, 2021-2030,($MILLION)
    TABLE 56. SPAIN COMPUTER-AIDED DRUG DISCOVERY MARKET, BY THERAPEUTIC AREA, 2021-2030,($MILLION)
    TABLE 57. SPAIN COMPUTER-AIDED DRUG DISCOVERY MARKET, BY END USER, 2021-2030,($MILLION)
    TABLE 58. ITALY COMPUTER-AIDED DRUG DISCOVERY MARKET, BY TYPE, 2021-2030,($MILLION)
    TABLE 59. ITALY COMPUTER-AIDED DRUG DISCOVERY MARKET, BY THERAPEUTIC AREA, 2021-2030,($MILLION)
    TABLE 60. ITALY COMPUTER-AIDED DRUG DISCOVERY MARKET, BY END USER, 2021-2030,($MILLION)
    TABLE 61. REST OF EUROPE COMPUTER-AIDED DRUG DISCOVERY MARKET, BY TYPE, 2021-2030,($MILLION)
    TABLE 62. REST OF EUROPE COMPUTER-AIDED DRUG DISCOVERY MARKET, BY THERAPEUTIC AREA, 2021-2030,($MILLION)
    TABLE 63. REST OF EUROPE COMPUTER-AIDED DRUG DISCOVERY MARKET, BY END USER, 2021-2030,($MILLION)
    TABLE 64. ASIA-PACIFIC COMPUTER-AIDED DRUG DISCOVERY MARKET, BY TYPE, 2021-2030,($MILLION)
    TABLE 65. ASIA-PACIFIC COMPUTER-AIDED DRUG DISCOVERY MARKET, BY THERAPEUTIC AREA, 2021-2030,($MILLION)
    TABLE 66. ASIA-PACIFIC COMPUTER-AIDED DRUG DISCOVERY MARKET, BY END USER, 2021-2030,($MILLION)
    TABLE 67. ASIA-PACIFIC COMPUTER-AIDED DRUG DISCOVERY MARKET, BY COUNTRY, 2021-2030,($MILLION)
    TABLE 68. CHINA COMPUTER-AIDED DRUG DISCOVERY MARKET, BY TYPE, 2021-2030,($MILLION)
    TABLE 69. CHINA COMPUTER-AIDED DRUG DISCOVERY MARKET, BY THERAPEUTIC AREA, 2021-2030,($MILLION)
    TABLE 70. CHINA COMPUTER-AIDED DRUG DISCOVERY MARKET, BY END USER, 2021-2030,($MILLION)
    TABLE 71. JAPAN COMPUTER-AIDED DRUG DISCOVERY MARKET, BY TYPE, 2021-2030,($MILLION)
    TABLE 72. JAPAN COMPUTER-AIDED DRUG DISCOVERY MARKET, BY THERAPEUTIC AREA, 2021-2030,($MILLION)
    TABLE 73. JAPAN COMPUTER-AIDED DRUG DISCOVERY MARKET, BY END USER, 2021-2030,($MILLION)
    TABLE 74. INDIA COMPUTER-AIDED DRUG DISCOVERY MARKET, BY TYPE, 2021-2030,($MILLION)
    TABLE 75. INDIA COMPUTER-AIDED DRUG DISCOVERY MARKET, BY THERAPEUTIC AREA, 2021-2030,($MILLION)
    TABLE 76. INDIA COMPUTER-AIDED DRUG DISCOVERY MARKET, BY END USER, 2021-2030,($MILLION)
    TABLE 77. SOUTH KOREA COMPUTER-AIDED DRUG DISCOVERY MARKET, BY TYPE, 2021-2030,($MILLION)
    TABLE 78. SOUTH KOREA COMPUTER-AIDED DRUG DISCOVERY MARKET, BY THERAPEUTIC AREA, 2021-2030,($MILLION)
    TABLE 79. SOUTH KOREA COMPUTER-AIDED DRUG DISCOVERY MARKET, BY END USER, 2021-2030,($MILLION)
    TABLE 80. AUSTRALIA COMPUTER-AIDED DRUG DISCOVERY MARKET, BY TYPE, 2021-2030,($MILLION)
    TABLE 81. AUSTRALIA COMPUTER-AIDED DRUG DISCOVERY MARKET, BY THERAPEUTIC AREA, 2021-2030,($MILLION)
    TABLE 82. AUSTRALIA COMPUTER-AIDED DRUG DISCOVERY MARKET, BY END USER, 2021-2030,($MILLION)
    TABLE 83. REST OF ASIA PACIFIC COMPUTER-AIDED DRUG DISCOVERY MARKET, BY TYPE, 2021-2030,($MILLION)
    TABLE 84. REST OF ASIA PACIFIC COMPUTER-AIDED DRUG DISCOVERY MARKET, BY THERAPEUTIC AREA, 2021-2030,($MILLION)
    TABLE 85. REST OF ASIA PACIFIC COMPUTER-AIDED DRUG DISCOVERY MARKET, BY END USER, 2021-2030,($MILLION)
    TABLE 86. LAMEA COMPUTER-AIDED DRUG DISCOVERY MARKET, BY TYPE, 2021-2030,($MILLION)
    TABLE 87. LAMEA COMPUTER-AIDED DRUG DISCOVERY MARKET, BY THERAPEUTIC AREA, 2021-2030,($MILLION)
    TABLE 88. LAMEA COMPUTER-AIDED DRUG DISCOVERY MARKET, BY END USER, 2021-2030,($MILLION)
    TABLE 89. LAMEA COMPUTER-AIDED DRUG DISCOVERY MARKET, BY COUNTRY, 2021-2030,($MILLION)
    TABLE 90. BRAZIL COMPUTER-AIDED DRUG DISCOVERY MARKET, BY TYPE, 2021-2030,($MILLION)
    TABLE 91. BRAZIL COMPUTER-AIDED DRUG DISCOVERY MARKET, BY THERAPEUTIC AREA, 2021-2030,($MILLION)
    TABLE 92. BRAZIL COMPUTER-AIDED DRUG DISCOVERY MARKET, BY END USER, 2021-2030,($MILLION)
    TABLE 93. SAUDI ARABIA COMPUTER-AIDED DRUG DISCOVERY MARKET, BY TYPE, 2021-2030,($MILLION)
    TABLE 94. SAUDI ARABIA COMPUTER-AIDED DRUG DISCOVERY MARKET, BY THERAPEUTIC AREA, 2021-2030,($MILLION)
    TABLE 95. SAUDI ARABIA COMPUTER-AIDED DRUG DISCOVERY MARKET, BY END USER, 2021-2030,($MILLION)
    TABLE 96. UAE COMPUTER-AIDED DRUG DISCOVERY MARKET, BY TYPE, 2021-2030,($MILLION)
    TABLE 97. UAE COMPUTER-AIDED DRUG DISCOVERY MARKET, BY THERAPEUTIC AREA, 2021-2030,($MILLION)
    TABLE 98. UAE COMPUTER-AIDED DRUG DISCOVERY MARKET, BY END USER, 2021-2030,($MILLION)
    TABLE 99. SOUTH AFRICA COMPUTER-AIDED DRUG DISCOVERY MARKET, BY TYPE, 2021-2030,($MILLION)
    TABLE 100. SOUTH AFRICA COMPUTER-AIDED DRUG DISCOVERY MARKET, BY THERAPEUTIC AREA, 2021-2030,($MILLION)
    TABLE 101. SOUTH AFRICA COMPUTER-AIDED DRUG DISCOVERY MARKET, BY END USER, 2021-2030,($MILLION)
    TABLE 102. REST OF LAMEA COMPUTER-AIDED DRUG DISCOVERY MARKET, BY TYPE, 2021-2030,($MILLION)
    TABLE 103. REST OF LAMEA COMPUTER-AIDED DRUG DISCOVERY MARKET, BY THERAPEUTIC AREA, 2021-2030,($MILLION)
    TABLE 104. REST OF LAMEA COMPUTER-AIDED DRUG DISCOVERY MARKET, BY END USER, 2021-2030,($MILLION)
  • LIST OF FIGURES

  • FIGURE 1.COMPUTER-AIDED DRUG DISCOVERY MARKET SEGMENTATION
    FIGURE 2.COMPUTER-AIDED DRUG DISCOVERY MARKET,2021-2030
    FIGURE 3.COMPUTER-AIDED DRUG DISCOVERY MARKET,2021-2030
    FIGURE 4. TOP INVESTMENT POCKETS, BY REGION
    FIGURE 5.PORTER FIVE-1
    FIGURE 6.PORTER FIVE-2
    FIGURE 7.PORTER FIVE-3
    FIGURE 8.PORTER FIVE-4
    FIGURE 9.PORTER FIVE-5
    FIGURE 10.TOP PLAYER POSITIONING
    FIGURE 11.COMPUTER-AIDED DRUG DISCOVERY MARKET:DRIVERS, RESTRAINTS AND OPPORTUNITIES
    FIGURE 12.REGULATORY GUIDELINES
    FIGURE 13.VALUE CHAIN ANALYSIS
    FIGURE 14.MARKET SHARE ANALYSIS
    FIGURE 15.KEY REGULATION ANALYSIS
    FIGURE 16.PATENT ANALYSIS BY COMPANY
    FIGURE 17.PATENT ANALYSIS BY COUNTRY
    FIGURE 18.COMPUTER-AIDED DRUG DISCOVERY MARKET,BY TYPE,2021(%)
    FIGURE 19.COMPARATIVE SHARE ANALYSIS OF STRUCTURE BASED DRUG DESIGN COMPUTER-AIDED DRUG DISCOVERY MARKET,2021-2030(%)
    FIGURE 20.COMPARATIVE SHARE ANALYSIS OF LIGAND-BASED DRUG DESIGN COMPUTER-AIDED DRUG DISCOVERY MARKET,2021-2030(%)
    FIGURE 21.COMPARATIVE SHARE ANALYSIS OF SEQUENCE-BASED APPROACHES COMPUTER-AIDED DRUG DISCOVERY MARKET,2021-2030(%)
    FIGURE 22.COMPUTER-AIDED DRUG DISCOVERY MARKET,BY THERAPEUTIC AREA,2021(%)
    FIGURE 23.COMPARATIVE SHARE ANALYSIS OF ONCOLOGY COMPUTER-AIDED DRUG DISCOVERY MARKET,2021-2030(%)
    FIGURE 24.COMPARATIVE SHARE ANALYSIS OF NEUROLOGY COMPUTER-AIDED DRUG DISCOVERY MARKET,2021-2030(%)
    FIGURE 25.COMPARATIVE SHARE ANALYSIS OF CARDIOVASCULAR DISEASE COMPUTER-AIDED DRUG DISCOVERY MARKET,2021-2030(%)
    FIGURE 26.COMPARATIVE SHARE ANALYSIS OF RESPIRATORY DISEASE COMPUTER-AIDED DRUG DISCOVERY MARKET,2021-2030(%)
    FIGURE 27.COMPARATIVE SHARE ANALYSIS OF DIABETES COMPUTER-AIDED DRUG DISCOVERY MARKET,2021-2030(%)
    FIGURE 28.COMPARATIVE SHARE ANALYSIS OF OTHERS COMPUTER-AIDED DRUG DISCOVERY MARKET,2021-2030(%)
    FIGURE 29.COMPUTER-AIDED DRUG DISCOVERY MARKET,BY END USER,2021(%)
    FIGURE 30.COMPARATIVE SHARE ANALYSIS OF PHARMACEUTICAL COMPANIES COMPUTER-AIDED DRUG DISCOVERY MARKET,2021-2030(%)
    FIGURE 31.COMPARATIVE SHARE ANALYSIS OF BIOTECHNOLOGY COMPANIES COMPUTER-AIDED DRUG DISCOVERY MARKET,2021-2030(%)
    FIGURE 32.COMPARATIVE SHARE ANALYSIS OF RESEARCH LABORATORIES COMPUTER-AIDED DRUG DISCOVERY MARKET,2021-2030(%)
    FIGURE 33.COMPUTER-AIDED DRUG DISCOVERY MARKET BY REGION,2021
    FIGURE 34.U.S. COMPUTER-AIDED DRUG DISCOVERY MARKET,2021-2030($MILLION)
    FIGURE 35.CANADA COMPUTER-AIDED DRUG DISCOVERY MARKET,2021-2030($MILLION)
    FIGURE 36.MEXICO COMPUTER-AIDED DRUG DISCOVERY MARKET,2021-2030($MILLION)
    FIGURE 37.GERMANY COMPUTER-AIDED DRUG DISCOVERY MARKET,2021-2030($MILLION)
    FIGURE 38.UNITED KINGDOM COMPUTER-AIDED DRUG DISCOVERY MARKET,2021-2030($MILLION)
    FIGURE 39.FRANCE COMPUTER-AIDED DRUG DISCOVERY MARKET,2021-2030($MILLION)
    FIGURE 40.SPAIN COMPUTER-AIDED DRUG DISCOVERY MARKET,2021-2030($MILLION)
    FIGURE 41.ITALY COMPUTER-AIDED DRUG DISCOVERY MARKET,2021-2030($MILLION)
    FIGURE 42.REST OF EUROPE COMPUTER-AIDED DRUG DISCOVERY MARKET,2021-2030($MILLION)
    FIGURE 43.CHINA COMPUTER-AIDED DRUG DISCOVERY MARKET,2021-2030($MILLION)
    FIGURE 44.JAPAN COMPUTER-AIDED DRUG DISCOVERY MARKET,2021-2030($MILLION)
    FIGURE 45.INDIA COMPUTER-AIDED DRUG DISCOVERY MARKET,2021-2030($MILLION)
    FIGURE 46.SOUTH KOREA COMPUTER-AIDED DRUG DISCOVERY MARKET,2021-2030($MILLION)
    FIGURE 47.AUSTRALIA COMPUTER-AIDED DRUG DISCOVERY MARKET,2021-2030($MILLION)
    FIGURE 48.REST OF ASIA PACIFIC COMPUTER-AIDED DRUG DISCOVERY MARKET,2021-2030($MILLION)
    FIGURE 49.BRAZIL COMPUTER-AIDED DRUG DISCOVERY MARKET,2021-2030($MILLION)
    FIGURE 50.SAUDI ARABIA COMPUTER-AIDED DRUG DISCOVERY MARKET,2021-2030($MILLION)
    FIGURE 51.UAE COMPUTER-AIDED DRUG DISCOVERY MARKET,2021-2030($MILLION)
    FIGURE 52.SOUTH AFRICA COMPUTER-AIDED DRUG DISCOVERY MARKET,2021-2030($MILLION)
    FIGURE 53.REST OF LAMEA COMPUTER-AIDED DRUG DISCOVERY MARKET,2021-2030($MILLION)
    FIGURE 54. TOP WINNING STRATEGIES, BY YEAR
    FIGURE 55. TOP WINNING STRATEGIES, BY DEVELOPMENT
    FIGURE 56. TOP WINNING STRATEGIES, BY COMPANY
    FIGURE 57.PRODUCT MAPPING OF TOP 10 PLAYERS
    FIGURE 58.COMPETITIVE DASHBOARD
    FIGURE 59.COMPETITIVE HEATMAP OF TOP 10 KEY PLAYERS


The global computer-aided drug discovery industry is expanding rapidly owing primarily to the increased use of artificial intelligence in drug discovery for drug screening, chemical synthesis, polypharmacology, and studying the three-dimensional structure of molecules. Furthermore, artificial intelligence has created numerous opportunities for companies to enter the market and use AI technology in conjunction with computer-aided drug discovery. There is increasing demand for rapid drug development for various diseases such as cancer which in turn is expected to drive the market of computer-aided drug discovery. Key players working in computer-aided drug discovery market are following notable strategies such as product innovation along with strategic tie-ups in order to grow worldwide. Asia-Pacific is projected to register faster growth as compared to North American and European markets.

PURCHASE OPTIONS

Call or Email us

U.S.-Canada Toll-free: +1-800-792-5285
Int'l : +1-503-894-6022
Europe : +44-845-528-1300
Email : help@alliedmarketresearch.com
 
FREQUENTLY ASKED QUESTIONS?

A. The market for computer-aided drug discovery is expected to grow due to increased research activities. As the number of chronic diseases has increased, so has the need for an appropriate treatment option. In addition, the growing number of unknown diseases has increased research and experimentation. Computer-aided drug discovery aids in the study, analysis, and monitoring of the interaction between the target biological molecule and its biomolecule ligand. It also aids in drug development and is a very cost-effective and time-consuming approach. These factors are expected to drive the computer-aided drug discovery market in the forecast timeframe

A. Agreement, business expansion, and product launch are the key growth strategies of global computer-aided drug discovery market players.

A. Asia-Pacific will provide more business opportunities for global Computer-aided drug discovery market in the future.

A. BOCSCI Inc., Bioduro-Sundia, Schrödinger, Inc., Aragen Life Sciences Pvt. Ltd., Aris Pharmaceuticals, Inc, Charles River Laboratories, Bayer AG, AstraZeneca, and Albany Molecular Research Inc. (AMRI). are the leading market players active in the Computer-aided drug discovery market.

A. Oncology segment held the maximum share of the global computer-aided drug discovery market in 2021

A. Pharmaceutical companies, biotechnology companies, and research laboratories include the major customers of global Computer-aided drug discovery market

A. The report provides an extensive qualitative and quantitative analysis of the current trends and future estimations of the global Computer-aided drug discovery market from 2021 to 2030 to determine the prevailing opportunities.

A. Government funding for drug development using computer-aided software is expected to boost market growth in the near future. Furthermore, increasing artificial intelligence integration with computer aided drug discovery is expected to increase market share in the global computer aided drug discovery market.

A. The growing demand for in-depth research on biomolecules and their interactions with specific target molecules has created numerous opportunities for market participants to increase their market revenue in the computer-aided drug discovery market. Pharmaceutical and biotech companies have established their global presence through collaborations and partnerships with key players in the artificial intelligence and computer aided drug discovery fields, which will ultimately accelerate the global computer-aided drug discovery market growth in the next few years.

Looking for Customization?

 Customization Request

Have a Question?

 Speak with Analyst

Any Confusion?

 Inquire Before Buying

Have a glance of the Report

  Request Sample
RELATED TAGS

Purchase Full Report of
Computer-aided Drug Discovery Market

Start reading instantly.
This Report and over 67,404+ more Reports, Available with Avenue Library. T&C*.

  • Online Only
  • $3,456
  • Online cloud access only
  • Restricted print, copy, paste & download
  • Read only
  • Free industry update
    (Within 180 days)
  • Free report update in next update cycle
    (Jun 2023 - Jun 2024)
  • Data Pack
  • $3,840
  • Restricted to one authorized user
  • One print only
  • Available in
    Excel
  • Free industry update
    (Within 180 days)
  •   Free report update in next update cycle
    (Jun 2023 - Jun 2024)
  • Single User
  • $5,769
  • Restricted to one authorized user
  • One print only
  • Available in
    PDF
  • Free industry update
    (Within 180 days)
  •   Free report update in next update cycle
    (Jun 2023 - Jun 2024)
  • Five Users
  • $6,450
  • Limited to five authorized users
  • Print upto five copies
  • Available in
    PDF
  • Free industry update
    (Within 180 days)
  •   Free report update in next update cycle
    (Jun 2023 - Jun 2024)
  • Enterprise
    License/PDF

  • $10,995
  • Unlimited
    within
    company/enterprise
  • Available in Excel & PDF
  • Free industry update
    (Within 180 days)
  •   Free report update in next update cycle
    (Jun 2023 - Jun 2024)
  • Library
    Membership

  • $999 $ 1,175
    Per User/ Per month/ Billed annually
  • Published Content
    E-access
  • Company Profiles
    E-access
  • Newly Added Content Access
  • 10 PDF
    Downloads
  • 5 Excel Data
    Pack Downloads
  • 250 Company Profiles PDF Downloads
  • Buy Now

*Taxes/Fees, if applicable will be added during checkout. All prices in USD

RELATED REPORTS
 

Why Allied Market Research?


Infallible Methodology

To ensure high-level data integrity, accurate analysis, and impeccable forecasts

Analyst Support

For complete satisfaction

Customization

On-demand customization of scope of the report to exactly meet your needs

TARGETED MARKET VIEW

Targeted market view to provide pertinent information and save time of readers

Get fresh content delivered

Get insights on topics that are crucial for your business. Stay abreast of your interest areas.

Get Industry Data Alerts

Why Allied Market Research?

Infallible Methodology

To ensure high-level data integrity, accurate analysis, and impeccable forecasts

Analyst Support

For complete satisfaction

Customization

On-demand customization of scope of the report to exactly meet your needs

TARGETED MARKET VIEW

Targeted market view to provide pertinent information and save time of readers