
Conformal Coatings Market Research, 2033
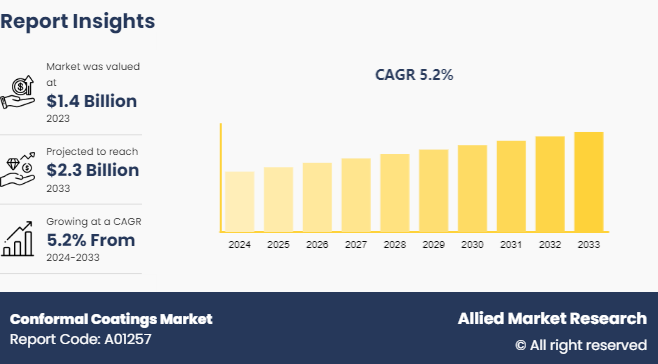
The global conformal coatings market was valued at $1.4 billion in 2023, and is projected to reach $2.3 billion by 2033, growing at a CAGR of 5.2% from 2024 to 2033.
Market Introduction and Definition
Conformal coatings are specialized protective layers applied to electronic components and circuit boards to safeguard them from environmental hazards such as moisture, dust, chemicals, and temperature extremes, thereby enhancing their reliability and longevity. These coatings are termed "conformal" as they conform to the contours and shapes of the surfaces they cover, providing a uniform protective barrier that adheres closely to the underlying circuitry. They are typically made from various materials, including acrylics, epoxies, silicones, and urethanes, each offering distinct properties suited to specific environmental challenges. For instance, acrylic coatings are known for their ease of application and removal, while silicone coatings offer excellent thermal stability and flexibility. The application of these coatings is a critical step in the manufacturing process, ensuring that electronic devices can operate effectively in harsh or fluctuating conditions. By mitigating the risk of corrosion, short circuits, and other forms of damage, conformal coatings play a vital role in extending the lifespan and reliability of electronic components, making them indispensable in industries ranging from automotive and aerospace to consumer electronics and telecommunications.
Key Takeaways
- The report provides competitive dynamics by evaluating business segments, product portfolios, target market revenue, geographical presence, and key strategic developments by prominent manufacturers.
- The study contains qualitative information such as the market dynamics (drivers, restraints, challenges, and opportunities) , public policy analysis, pricing analysis, and Porter’s Five Force Analysis across North America, Europe, Asia-Pacific, and LAMEA regions.
- Latest trends in global conformal coatings such as undergoing R&D activities, regulatory guidelines, and government initiatives are analyzed across 16 countries in 4 different regions.
- More than 3, 300 conformal coatings-related product literatures, industry releases, annual reports, and other documents of key industry participants along with authentic industry journals and government websites have been reviewed for generating high-value industry insights for global conformal coatings market.
Key Market Dynamics
One of the primary drivers of the conformal coatings market is the rapid advancement in technology. As electronic devices become more sophisticated, they require enhanced protection to ensure reliability and longevity. According to the U.S. National Institute of Standards and Technology (NIST) , the integration of advanced electronic systems in consumer electronics, automotive, and aerospace applications has led to rise in demand for high-performance conformal coatings. The miniaturization of components and the complexity of modern electronics necessitate coatings that provide robust protection while maintaining performance. Government data highlights a significant increase in research and development activities within the electronics sector, which in turn fuels the demand for innovative coating solutions.
Furthermore, increasingly stringent environmental regulations have also contributed to the growth of the conformal coatings market. Governments worldwide are implementing regulations to reduce the environmental impact of electronic waste and enhance the durability of electronic products. For instance, the European Union's Restriction of Hazardous Substances (RoHS) directive and the Waste Electrical and Electronic Equipment (WEEE) directive mandate the use of environmentally friendly materials and improved recycling practices. These regulations drive manufacturers to adopt conformal coatings that comply with environmental standards and offer better protection against environmental factors. According to a report by the U.S. Environmental Protection Agency (EPA) , compliance with such regulations is a key factor influencing the market for conformal coatings, as companies seek to align with both regulatory requirements and consumer expectations.
However, the availability of advanced coating materials is a major constraint impacting the conformal coatings market. High-performance coatings, such as those based on advanced silicone or epoxy formulations, require specific raw materials and manufacturing processes that may not be readily accessible. Government reports, such as the U.S. Geological Survey (USGS) , highlight the challenges related to the supply of critical materials used in advanced coatings, including rare earth elements and specialized polymers. The concentration of production in a few regions and the geopolitical factors influencing the supply chain contribute to material shortages and price volatility. This limitation can hinder the development of new and innovative coating solutions, affecting market growth and the ability to meet evolving industry requirements.
On the contrary, technological advancements is a significant opportunity in the conformal coatings market. Innovations in materials science and coating technologies are opening new avenues for the growth of the market. The development of advanced coatings with superior properties, such as enhanced thermal stability, flexibility, and resistance to harsh environmental conditions, creates opportunities for their adoption across various high-tech industries. According to the U.S. Department of Energy (DOE) and the National Science Foundation (NSF) , significant research funding is being allocated to explore new coating materials and technologies. For instance, advancements in nanotechnology and smart coatings are poised to revolutionize the industry by providing coatings with self-healing, anti-corrosion, and conductivity properties. These innovations not only improve the performance of conformal coatings but also expand their applicability in sectors such as aerospace, automotive, and electronics, where high reliability and performance are critical.
Public Policy Analysis of Conformal Coatings Market
- In the U.S., Environmental Protection Agency (EPA) (40 CFR Part 59) , regulates volatile organic compounds (VOCs) in coatings through this regulation. Manufacturers must ensure that their conformal coatings comply with VOC limits to minimize environmental impact.
- Furthermore, Occupational Safety and Health Administration (OSHA) (29 CFR 1910.1200) requires manufacturers to provide Safety Data Sheets (SDS) and proper labeling for chemicals used in conformal coatings to ensure worker safety.
- In Canada, Canada Occupational Health and Safety Regulations (Part II of the Canada Labor Code) requires manufacturers to provide information on hazardous substances used in conformal coatings, including proper labeling and safety data sheets.
- In addition, Canadian Aviation Regulations (CARs) (Parts V and VI) states that coatings used in the aviation sector must comply with Transport Canada’s regulations, which align with international standards for aerospace materials and coatings.
- In Europe, Registration, Evaluation, Authorization, and Restriction of Chemicals (REACH) ((EC) No 1907/2006) requires manufacturers to register chemicals used in coatings, including conformal coatings, and evaluate their potential risks. This regulation aims to protect human health and the environment from hazardous substances.
- Moreover, Restriction of Hazardous Substances (RoHS) Directive (2011/65/EU) restricts the use of certain hazardous substances in electrical and electronic equipment. Conformal coatings must comply with these restrictions to ensure they do not contain prohibited substances.
- In China Regulation on the Control of Pollution Caused by Electronic Information Products (China RoHS) (SJ/T 11363-2015) restricts the use of certain hazardous substances in electronic products, including those involving conformal coatings.
- In Japan, Chemical Substances Control Law (CSCL) (Law No. 117 of 1973) controls the manufacture and use of chemicals, including those in conformal coatings, to protect human health and the environment.
Market Segmentation
The conformal coatings market is segmented on the basis by material type, end-user industry, and region. By material type, the market is classified into acrylic, silicone, urethane, parylene, epoxy, and others. Based on end-user industry, the market is segmented into automotive, consumer electronics, telecommunication, aerospace, and others. Region-wise the market is studied across areas such as North America, Europe, Asia-Pacific, and LAMEA.
Regional/Country Market Outlook
Asia-Pacific represents a significant market share for conformal coatings market. The conformal coatings market in the Asia-Pacific region is significantly driven by the rapid industrialization and technological advancements across key economies. According to the International Trade Administration (ITA) in 2023, the APAC region is experiencing substantial growth in the electronics and automotive sectors, with countries like China, India, and South Korea leading the charge. The demand for conformal coatings is closely tied to the expansion of these industries, where advanced electronics and automotive systems require robust protective coatings to ensure reliability and performance in challenging environments. The growth in consumer electronics, supported by data from the China Electronic Chamber of Commerce, highlights the increasing need for conformal coatings in devices such as smartphones and wearables, contributing to the market's expansion.
In addition, government regulations and environmental standards are driving the adoption of conformal coatings in the Asia-Pacific region. China's RoHS-like regulations (SJ/T 11363-2015) and Japan's Chemical Substances Control Law (CSCL) mandate the use of environmentally friendly materials and safe chemical practices, influencing manufacturers to adopt conformal coatings that comply with these standards. The Asia-Pacific Economic Cooperation (APEC) reports further emphasize the region's focus on sustainable development and reduced environmental impact, which aligns with the growing demand for coatings that meet stringent environmental and safety regulations. This regulatory environment supports the market growth by pushing manufacturers toward advanced, compliant conformal coating solutions.
Competitive Landscape
The major players operating in the conformal coatings include Chase Corporation, Electrolube, Europlasma NV, MG Chemicals, KISCO LTD, Dymax, Guangdong Ritop Fine Chemical Company Co., Ltd., CHT Germany GmbH, Dow Inc., and Henkel AG & Co. KGaA.
Industry Trends
- According to a report published by Electrolube, a leading manufacturer of advance engineering products the solvent-based conformal coatings are the most used conformal coatings type in the electronics sector as solvent-based conformal coatings are easy to use, cost effective and there is a wide selection available in the market. These factors have led the key manufacturers of conformal coatings to increasingly produce solvent-based conformal coatings.
- According to an article published by Coatings World in 2023, conformal coatings manufacturers are working with suppliers of dispensing equipment to improve the cost and convenience of using these coatings on a larger scale. For instance, both PVA and Nordson Asymtek have recently introduced new two-component dispensing equipment. These developments have enabled coating suppliers to revisit two-component urethane and silicone resin chemistries to further improve conformal coating performance.
Key Sources Referred
- The World Coatings Council
- American Coatings Association
- National Promotion and Facilitation Agency
- United States Bureau of Statistics
- U.S. Development Authority
- United States Environmental Protection Agency
- Invest In India
- Press Information Bureau
Key Benefits For Stakeholders
- This report provides a quantitative analysis of the market segments, current trends, estimations, and dynamics of the conformal coatings market analysis from 2024 to 2033 to identify the prevailing conformal coatings market opportunities.
- The market research is offered along with information related to key drivers, restraints, and opportunities.
- Porter's five forces analysis highlights the potency of buyers and suppliers to enable stakeholders make profit-oriented business decisions and strengthen their supplier-buyer network.
- In-depth analysis of the conformal coatings market segmentation assists to determine the prevailing market opportunities.
- Major countries in each region are mapped according to their revenue contribution to the global market.
- Market player positioning facilitates benchmarking and provides a clear understanding of the present position of the market players.
- The report includes the analysis of the regional as well as global conformal coatings market trends, key players, market segments, application areas, and market growth strategies.
Conformal Coatings Market Report Highlights
| Aspects | Details |
| Market Size By 2033 | USD 2.3 Billion |
| Growth Rate | CAGR of 5.2% |
| Forecast period | 2024 - 2033 |
| Report Pages | 410 |
| By Material Type |
|
| By End-User Industry |
|
| By Region |
|
| Key Market Players | MG Chemicals, Henkel AG & Co. KGaA, Chase Corporation, Dow Inc., Electrolube, KISCO LTD, Dymax, CHT Germany GmbH, Guangdong Ritop Fine Chemical Company Co.,Ltd., Europlasma NV |
| | Chase Corporation, Electrolube, Dymax Corporation, Specialty Coatings System, Others |
Loading Table Of Content...

