0
2018
Connected Logistics Market

Connected Logistics Market

by Technology (Bluetooth, Cellular, Wi-Fi, ZigBee, NFC, and Satellite) and Devices (Gateways, RFID Tags, and Sensor Nodes) - Global Opportunity Analysis and Industry Forecast, 2016-2023

Report Code: A00749
Feb 2018 | Pages: 195
Tables: 69
Charts: 63
  • Formats*:

  • pdf

    Single User License, Five User
    License & Enterprise User License

  • xls

    Data Pack Excel License

  • ppt

    It comes with the additional cost
    of $2500.00 contact sales.


COVID-19

Pandemic disrupted the entire world and affected many industries.

Get detailed COVID-19 impact analysis on the Connected Logistics Market

Request Now !

Connected Logistics Market Outlook: 2023

Connected logistics provides various benefits to logistics businesses offering services for varied industry verticals by providing real-time access, improved operational efficiency, and enhanced productivity through integration of multiple connected platforms. Connected Logistics service providers have introduced innovative products and solutions to enable ease of access and high level of interoperability to achieve high productivity and informed decision making through collective efforts. Moreover, there are various communication technologies that facilitate improved logistical support, these include Bluetooth, ZigBee, Wi-Fi, and others. The NFC segment is anticipated to witness the highest growth rate during the forecast period. The global Connected Logistics market was valued at $16,774 million in 2016, and is projected to reach at $27,722 million by 2023, growing at a CAGR of 7.60% from 2017 to 2023.

The increase in need for mobility, need to reduce cost of administrative processes, penetration of IoT & Logistics 4.0, and the increased market for connected devices supplements the market growth. Connected Logistics facilitate logistical businesses with real-time updates, interoperability, and easier access to required information. It provides interface to integrate multiple devices, which enables informed decision making. The increased market for intelligent transportation solutions is expected to drive the Connected Logistics market growth.

The Connected Logistics Market

connected logistics market

Segment Overview

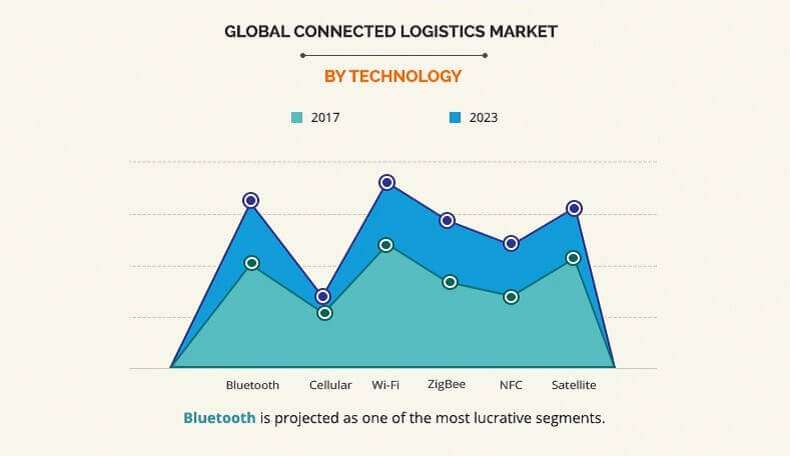
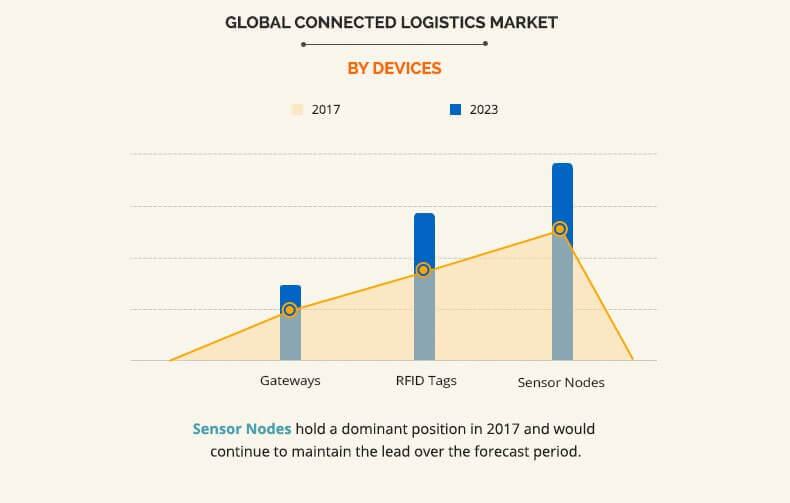
The global Connected Logistics Market is segmented based on technology, device, and region. The technology covered in the study includes Bluetooth, Cellular, Wi-Fi, ZigBee, NFC, and Satellite. Varied devices covered in the report are Gateways, RFID Tags, and Sensor Nodes.  Based on region, the Connected Logistics market is analyzed across North America (U.S., Mexico, and Canada), Europe (UK, Germany, France, and rest of Europe), Asia-Pacific (China, India, Japan, and rest of Asia-Pacific), and LAMEA (Latin America, Middle East, and Africa).

Top Impacting Factors

The global Connected Logistics market is influenced by several factors that include increased penetration of IoT & logistics 4.0, increased application areas, increased market for cloud solutions and proliferation of connected devices, growth associated with end-use industries, demand from developing economies, and others. All these factors collectively provide opportunities for Connected Logistics market growth.

The Connected Logistics Market by Technology

connected logistics market by technology

The proliferation of Smart Phones and Connected Devices

The growth in sales of mobile phones has increased the adoption of Connected Logistics among end users. According to “Ericsson Mobility Report” published in 2015, the number of smartphone users is expected to reach 6.1 billion by 2020. Further, Cisco IBSG have predicted that the number of connected devices is expected to reach 50 billion by 2020. In addition, introduction of Bluetooth 5, Bluetooth beacons, growing internet penetration, and expected rise in trade volumes during forecast period are some of the factors that are expected to fuel the Connected Logistics market demand. Further, enterprise from all industry verticals is expected to drive the demand for Connected another analysis from Cisco states that India is expected to have around 650 million smartphones by 2019.

Technological Advancements in Logistics Industry

Rise in adoption of cloud-based technology along with usage of logistics 4.0, Bluetooth 5, and IoT drives the growth of the Connected Logistics market. At present, cloud technology is adopted widely amongst all the businesses, which provide logistical businesses affordable solutions., the implementation of cloud enables organizations to combine supplementary Cloud computing allows the model to function from anywhere and anytime. Hence, the rise in the adoption of the cloud-based solutions drives the growth of the Connected Logistics market.

Impact of Developing Economies

Increase in demand for advanced solutions and technological advancements in the logistics industry, presence of untapped demands, and surge in need for better infrastructure in the countries such as China, Japan, and Australia provide enormous opportunities for the market growth.

The Connected Logistics Market by Devices

connected logistics market by devices

Key Benefits for Stakeholders

  • The report provides an overview of the trends, structure, drivers, challenges, and opportunities in the global Connected Logistics market.
  • Porter’s Five Forces analysis highlights the potential of buyers & suppliers, and provides insights on the competitive structure of the market to determine the investment pockets.
  • Current and future trends adopted by key market players are highlighted to determine overall competitiveness.
  • The quantitative analysis of the market from 2016 to 2023 is provided to elaborate the market potential.

Connected Logistics Market Report Highlights

Aspects Details
By Technology
  • Bluetooth
  • Cellular
  • Wi-Fi
  • ZigBee
  • NFC
  • Satellite
By Devices
  • Gateways
  • RFID Tags
  • Sensor Nodes
By Region
  • North America  (U.S., Canada, Mexico)
  • Europe  (UK, Germany, France, Rest of Europe)
  • Asia-Pacific  (China, India, Japan, Rest of Asia-Pacific)
  • LAMEA  (Latin America, Middle East, Africa)
Key Market Players ORACLE, AT&T INC., ZEBRA TECHNOLOGIES, INTERNATIONAL BUSINESS MACHINES CORPORATION, EUROTECH S.P.A., SAP, SECURERF, GT NEXUS, CISCO SYSTEMS, INC., THINGWORX
 

CHAPTER 1 INTRODUCTION

1.1. REPORT DESCRIPTION
1.2. KEY BENEFITS FOR STAKEHOLDERS
1.3. KEY MARKET SEGMENTS
1.4. KEY MARKET SEGMENTATION
1.5. RESEARCH METHODOLOGY

1.5.1. Secondary research
1.5.2. Primary research
1.5.3. Analyst tools and models

CHAPTER 2 EXECUTIVE SUMMARY

2.1. CXO PERSPECTIVE

CHAPTER 3 MARKET OVERVIEW

3.1. MARKET DEFINITION AND SCOPE
3.2. KEY FINDINGS

3.2.1. Top impacting factors
3.2.2. Top investment pockets
3.2.3. Top winning strategies

3.3. PORTER’S FIVE FORCES ANALYSIS

3.3.1. Low bargaining power of suppliers
3.3.2. Moderate bargaining power of buyers
3.3.3. Moderate threat of substitutes
3.3.4. Moderate-to-high threat of new entrants
3.3.5. Moderate-to-high competitive rivalry

3.4. KEY PLAYER POSITIONING, 2016
3.5. MARKET DYNAMICS

3.5.1. Drivers
3.5.2. Restraint
3.5.3. Opportunities

CHAPTER 4 CONNECTED LOGISTICS MARKET BY TECHNOLOGY

4.1. OVERVIEW
4.2. BLUETOOTH

4.2.1. Key market trends, growth factors and opportunities
4.2.2. Market size and forecast, by region
4.2.3. Market analysis by country

4.3. CELLULAR

4.3.1. Key market trends, growth factors and opportunities
4.3.2. Market size and forecast, by region
4.3.3. Market analysis by country

4.4. WI-FI

4.4.1. Key market trends, growth factors and opportunities
4.4.2. Market size and forecast, by region
4.4.3. Market analysis by country

4.5. ZIGBEE

4.5.1. Key market trends, growth factors and opportunities
4.5.2. Market size and forecast, by region
4.5.3. Market analysis by country

4.6. NFC

4.6.1. Key market trends, growth factors and opportunities
4.6.2. Market size and forecast, by region
4.6.3. Market analysis by country

4.7. SATELLITE

4.7.1. Key market trends, growth factors and opportunities
4.7.2. Market size and forecast, by region
4.7.3. Market analysis by country

CHAPTER 5 GLOBAL CONNECTED LOGISTICS MARKET, BY DEVICES

5.1. OVERVIEW
5.2. GATEWAYS

5.2.1 Key market trends, growth factors and opportunities
5.2.2. Market size and forecast, by region
5.2.3. Market analysis by country

5.3. RFID TAGS

5.3.1 Key market trends, growth factors and opportunities5.3.1. Market size and forecast, by region
5.3.2. Market analysis by country

5.4. SENSOR NODES

5.4.1 Key market trends, growth factors and opportunities
5.4.2. Market size and forecast, by region
5.4.3. Market analysis by country

CHAPTER 6 CONNECTED LOGISTICS MARKET, BY REGION

6.1. OVERVIEW
6.2. NORTH AMERICA

6.2.1. Key market trends, growth factors and opportunities
6.2.2. Market size and forecast by country
6.2.3. Market size and forecast by Technology
6.2.4. Market size and forecast by Devices

6.2.4.1. U.S.

6.2.4.1.1. Market size and forecast by Technology
6.2.4.1.2. Market size and forecast by Devices

6.2.4.2. Canada

6.2.4.2.1. Market size and forecast by Technology
6.2.4.2.2. Market size and forecast by Devices

6.2.4.3. Mexico

6.2.4.3.1. Market size and forecast by Technology
6.2.4.3.2. Market size and forecast by Devices

6.3. EUROPE

6.3.1. Key market trends, growth factors and opportunities
6.3.2. Market size and forecast by country
6.3.3. Market size and forecast by Technology
6.3.4. Market size and forecast by Devices

6.3.4.1. UK

6.3.4.1.1. Market size and forecast by Technology
6.3.4.1.2. Market size and forecast by Devices

6.3.4.2. Germany

6.3.4.2.1. Market size and forecast by Technology
6.3.4.2.2. Market size and forecast by Devices

6.3.4.3. France

6.3.4.3.1. Market size and forecast by Technology
6.3.4.3.2. Market size and forecast by Devices

6.3.4.4. Rest of Europe

6.3.4.4.1. Market size and forecast by Technology
6.3.4.4.2. Market size and forecast by Devices

6.4. ASIA-PACIFIC

6.4.1. Key market trends, growth factors and opportunities
6.4.2. Market size and forecast by country
6.4.3. Market size and forecast by Technology
6.4.4. Market size and forecast by Devices

6.4.4.1. China

6.4.4.1.1. Market size and forecast by Technology
6.4.4.1.2. Market size and forecast by Devices

6.4.4.2. India

6.4.4.2.1. Market size and forecast by Technology
6.4.4.2.2. Market size and forecast by Devices

6.4.4.3. Japan

6.4.4.3.1. Market size and forecast by Technology
6.4.4.3.2. Market size and forecast by Devices

6.4.4.4. Rest of Asia-Pacific

6.4.4.4.1. Market size and forecast by Technology
6.4.4.4.2. Market size and forecast by Devices

6.5. LAMEA

6.5.1. Key market trends, growth factors and opportunities
6.5.2. Market size and forecast by region
6.5.3. Market size and forecast by Technology
6.5.4. Market size and forecast by Devices

6.5.4.1. Latin America

6.5.4.1.1. Market size and forecast by Technology
6.5.4.1.2. Market size and forecast by Devices

6.5.4.2. Middle East

6.5.4.2.1. Market size and forecast by Technology
6.5.4.2.2. Market size and forecast by Devices

6.5.4.3. Africa

6.5.4.3.1. Market size and forecast by Technology
6.5.4.3.2. Market size and forecast by Devices

CHAPTER 7 COMPANY PROFILES

7.1. SAP

7.1.1. Company overview
7.1.2. Company snapshot
7.1.3. Operating business segments
7.1.4. Product portfolio
7.1.5. Business performance
7.1.6. Key strategic moves and developments

7.2. THINGWORX

7.2.1. Company overview
7.2.2. Product portfolio
7.2.3. Key strategic moves and developments

7.3. AT&T INC.

7.3.1. Company overview
7.3.2. Operating business segments
7.3.3. Business performance
7.3.4. Key strategic moves and developments

7.4. SECURERF

7.4.1. Company overview
7.4.2. Company snapshot
7.4.3. Operating business segments
7.4.4. Product portfolio
7.4.5. Business performance
7.4.6. Key strategic moves and developments

7.5. CISCO SYSTEMS, INC.

7.5.1. Company overview
7.5.2. Operating business segments
7.5.3. Business performance
7.5.4. Key strategic moves and developments

7.6. ZEBRA TECHNOLOGIES

7.6.1. Company overview
7.6.2. Operating business segments
7.6.3. Business performance
7.6.4. Key strategic moves and developments

7.7. INTERNATIONAL BUSINESS MACHINES CORPORATION

7.7.1. Company overview
7.7.2. Operating business segments
7.7.3. Business performance
7.7.4. Key strategic moves and developments

7.8. GT NEXUS

7.8.1. Company overview
7.8.2. Operating business segments
7.8.3. Business performance
7.8.4. Key strategic moves and developments

7.9. EUROTECH S.P.A.

7.9.1. Company overview
7.9.2. Company snapshot
7.9.3. Product portfolio
7.9.4. Key strategic moves and developments

7.10. ORACLE

7.10.1. Company overview
7.10.2. Company snapshot
7.10.3. Operating business segments
7.10.4. Business performance
7.10.5. Key strategic moves and developments

LIST OF TABLES

TABLE 1. GLOBAL CONNECTED LOGISTICS MARKET REVENUE, BY TECHNOLOGY, 2016-2023 ($MILLION)
TABLE 2. BLUETOOTH MARKET REVENUE, BY GEOGRAPHY, 2016-2023 ($MILLION)
TABLE 3. CELLULAR MARKET REVENUE, BY GEOGRAPHY, 2016-2023 ($MILLION)
TABLE 4. WI-FI MARKET REVENUE, BY GEOGRAPHY, 2016-2023 ($MILLION)
TABLE 5. ZIGBEE MARKET REVENUE, BY GEOGRAPHY, 2016-2023 ($MILLION)
TABLE 6. NFC MARKET REVENUE, BY GEOGRAPHY, 2016-2023 ($MILLION)
TABLE 7. SATELLITE MARKET REVENUE, BY GEOGRAPHY, 2016-2023 ($MILLION)
TABLE 8. GLOBAL CONNECTED LOGISTICS MARKET REVENUE, BY DEVICES, 2016-2023 ($MILLION)
TABLE 9. GATEWAYS CONNECTED LOGISTICS MARKET, BY REGION, 2016-2023 ($MILLION)
TABLE 10. RFID TAGS CONNECTED LOGISTICS MARKET, BY REGION, 2016-2023 ($MILLION)
TABLE 11. REATIL CONNECTED LOGISTICS MARKET, BY REGION, 2016-2023 ($MILLION)
TABLE 12. CONNECTED LOGISTICS MARKET BY REGION, 2016-2023 ($MILLION)
TABLE 13. NORTH AMERICA: CONNECTED LOGISTICS MARKET BY COUNTRY, 2016-2023 ($MILLION)
TABLE 14. NORTH AMERICA: CONNECTED LOGISTICS MARKET BY TECHNOLOGY, 2016-2023 ($MILLION)
TABLE 15. NORTH AMERICA: CONNECTED LOGISTICS MARKET BY DEVICES, 2016-2023 ($MILLION)
TABLE 16. US: CONNECTED LOGISTICS MARKET BY TECHNOLOGY, 2016-2023 ($MILLION)
TABLE 17. US: CONNECTED LOGISTICS MARKET BY DEVICES, 2016-2023 ($MILLION)
TABLE 18. CANADA: CONNECTED LOGISTICS MARKET BY TECHNOLOGY, 2016-2023 ($MILLION)
TABLE 19. CANADA: CONNECTED LOGISTICS MARKET BY DEVICES, 2016-2023 ($MILLION)
TABLE 20. MEXICO: CONNECTED LOGISTICS MARKET BY TECHNOLOGY, 2016-2023 ($MILLION)
TABLE 21. MEXICO: CONNECTED LOGISTICS MARKET BY DEVICES, 2016-2023 ($MILLION)
TABLE 22. EUROPE: CONNECTED LOGISTICS MARKET BY COUNTRY, 2016-2023 ($MILLION)
TABLE 23. EUROPE: CONNECTED LOGISTICS MARKET BY TECHNOLOGY, 2016-2023 ($MILLION)
TABLE 24. EUROPE: CONNECTED LOGISTICS MARKET BY DEVICES, 2016-2023 ($MILLION)
TABLE 25. UK: CONNECTED LOGISTICS MARKET BY TECHNOLOGY, 2016-2023 ($MILLION)
TABLE 26. UK: CONNECTED LOGISTICS MARKET BY DEVICES, 2016-2023 ($MILLION)
TABLE 27. GERMANY: CONNECTED LOGISTICS MARKET BY TECHNOLOGY, 2016-2023 ($MILLION)
TABLE 28. GERMANY: CONNECTED LOGISTICS MARKET BY DEVICES, 2016-2023 ($MILLION)
TABLE 29. FRANCE: CONNECTED LOGISTICS MARKET BY TECHNOLOGY, 2016-2023 ($MILLION)
TABLE 30. FRANCE: CONNECTED LOGISTICS MARKET BY DEVICES, 2016-2023 ($MILLION)
TABLE 31. REST OF EUROPE: CONNECTED LOGISTICS MARKET BY TECHNOLOGY, 2016-2023 ($MILLION)
TABLE 32. REST OF EUROPE: CONNECTED LOGISTICS MARKET BY DEVICES, 2016-2023 ($MILLION)
TABLE 33. ASIA-PACIFIC: CONNECTED LOGISTICS MARKET BY COUNTRY, 2016-2023 ($MILLION)
TABLE 34. ASIA-PACIFIC: CONNECTED LOGISTICS MARKET BY TECHNOLOGY, 2016-2023 ($MILLION)
TABLE 35. ASIA-PACIFIC: CONNECTED LOGISTICS MARKET BY DEVICES, 2016-2023 ($MILLION)
TABLE 36. CHINA: CONNECTED LOGISTICS MARKET BY TECHNOLOGY, 2016-2023 ($MILLION)
TABLE 37. CHINA: CONNECTED LOGISTICS MARKET BY DEVICES, 2016-2023 ($MILLION)
TABLE 38. INDIA: CONNECTED LOGISTICS MARKET BY TECHNOLOGY, 2016-2023 ($MILLION)
TABLE 39. INDIA: CONNECTED LOGISTICS MARKET BY DEVICES, 2016-2023 ($MILLION)
TABLE 40. JAPAN: CONNECTED LOGISTICS MARKET BY TECHNOLOGY, 2016-2023 ($MILLION)
TABLE 41. JAPAN: CONNECTED LOGISTICS MARKET BY DEVICES, 2016-2023 ($MILLION)
TABLE 42. REST OF ASIA-PACIFIC: CONNECTED LOGISTICS MARKET BY TECHNOLOGY, 2016-2023 ($MILLION)
TABLE 43. REST OF ASIA-PACIFIC: CONNECTED LOGISTICS MARKET BY DEVICES, 2016-2023 ($MILLION)
TABLE 44. LAMEA: CONNECTED LOGISTICS MARKET BY REGION, 2016-2023 ($MILLION)
TABLE 45. LAMEA: CONNECTED LOGISTICS MARKET BY TECHNOLOGY, 2016-2023 ($MILLION)
TABLE 46. LAMEA: CONNECTED LOGISTICS MARKET BY DEVICES, 2016-2023 ($MILLION)
TABLE 47. LATIN AMERICA: CONNECTED LOGISTICS MARKET BY TECHNOLOGY, 2016-2023 ($MILLION)
TABLE 48. LATIN AMERICA: CONNECTED LOGISTICS MARKET BY DEVICES, 2016-2023 ($MILLION)
TABLE 49. MIDDLE EAST: CONNECTED LOGISTICS MARKET BY TECHNOLOGY, 2016-2023 ($MILLION)
TABLE 50. MIDDLE EAST: CONNECTED LOGISTICS MARKET BY DEVICES, 2016-2023 ($MILLION)
TABLE 51. AFRICA: CONNECTED LOGISTICS MARKET BY TECHNOLOGY, 2016-2023 ($MILLION)
TABLE 52. AFRICA: CONNECTED LOGISTICS MARKET BY DEVICES, 2016-2023 ($MILLION)
TABLE 53. SAP: COMPANY SNAPSHOT
TABLE 54. SAP: OPERATING SEGMENTS
TABLE 55. SAP: PRODUCT PORTFOLIO
TABLE 56. THINGWORX: COMPANY SNAPSHOT
TABLE 57. THINGWORX: PRODUCT PORTFOLIO
TABLE 58. AT&T INC: COMPANY SNAPSHOT
TABLE 59. AT&T INC: OPERATING SEGMENTS
TABLE 60. SECURERF: COMPANY SNAPSHOT
TABLE 61. SECURERF: OPERATING SEGMENTS
TABLE 62. SECURERF: PRODUCT PORTFOLIO
TABLE 63. CISCO SYSTEMS: COMPANY SNAPSHOT
TABLE 64. CISCO SYSTEMS: OPERATING SEGMENTS
TABLE 65. ZEBRA TECHNOLOGIES: COMPANY SNAPSHOT
TABLE 66. ZEBRA TECHNOLOGIES: OPERATING SEGMENTS
TABLE 67. IBM CORPORATION: COMPANY SNAPSHOT
TABLE 68. IBM CORPORATION: OPERATING SEGMENTS
TABLE 69. GT NEXUS: COMPANY SNAPSHOT
TABLE 70. GT NEXUS: OPERATING SEGMENTS
TABLE 71. EUROTECH S.P.A.: COMPANY SNAPSHOT
TABLE 72. EUROTECH S.P.A.: PRODUCT PORTFOLIO
TABLE 73. ORACLE: COMPANY SNAPSHOT
TABLE 74. ORACLE: OPERATING SEGMENTS

LIST OF FIGURES

FIGURE 1. KEY MARKET SEGMENTATION
FIGURE 2. TOP IMPACTING FACTORS
FIGURE 3. TOP INVESTMENT POCKETS IN THE GLOBAL CONNECTED LOGISTICSS MARKET
FIGURE 4. TOP WINNING STRATEGIES
FIGURE 5. BARGAINING POWER OF SUPPLIERS
FIGURE 6. BARGAINING POWER OF BUYERS
FIGURE 7. THREAT OF SUBSTITUTES
FIGURE 8. THREAT OF NEW ENTRANTS
FIGURE 9. COMPETITIVE RIVALRY
FIGURE 10. KEY PLAYER POSITIONING OF GLOBAL CONNECTED LOGISTICS MARKET, 2016
FIGURE 11. MARKET DYNAMICS
FIGURE 12. GLOBAL CONNECTED LOGISTICS MARKET, BY TECHNOLOGY
FIGURE 13. COMPARATIVE SHARE ANALYSIS OF BLUETOOTH MARKET, BY COUNTRY, 2016 & 2023 (%)
FIGURE 14. COMPARATIVE SHARE ANALYSIS OF CELLULAR MARKET, BY COUNTRY, 2016 & 2023 (%)
FIGURE 15. COMPARATIVE SHARE ANALYSIS OF WI-FI MARKET, BY COUNTRY, 2016 & 2023 (%)
FIGURE 16. COMPARATIVE SHARE ANALYSIS OF ZIGBEE MARKET, BY COUNTRY, 2016 & 2023 (%)
FIGURE 17. COMPARATIVE SHARE ANALYSIS OF NFC MARKET, BY COUNTRY, 2016 & 2023 (%)
FIGURE 18. COMPARATIVE SHARE ANALYSIS OF SATELLITE MARKET, BY COUNTRY, 2016 & 2023 (%)
FIGURE 19. COMPARATIVE SHARE ANALYSIS OF GATEWAYS MARKET, BY COUNTRY, 2016 & 2023 (%)
FIGURE 20. COMPARATIVE SHARE ANALYSIS OF RFID TAGS MARKET, BY COUNTRY, 2016 & 2023 (%)
FIGURE 21. COMPARATIVE SHARE ANALYSIS OF SENSOR NODES MARKET, BY COUNTRY, 2016 & 2023 (%)
FIGURE 22. CONNECTED LOGISTICS MARKET, BY REGION
FIGURE 23. NORTH AMERICA: CONNECTED LOGISTICS MARKET
FIGURE 24. U.S. CONNECTED LOGISTICS MARKET, 2016-2023 ($MILLION)
FIGURE 25. CANADA CONNECTED LOGISTICS MARKET, 2016-2023 ($MILLION)
FIGURE 26. MEXICO CONNECTED LOGISTICS MARKET, 2016-2023 ($MILLION)
FIGURE 27. EUROPE: CONNECTED LOGISTICS MARKET
FIGURE 28. U.K. CONNECTED LOGISTICS MARKET, 2016-2023 ($MILLION)
FIGURE 29. GERMANY CONNECTED LOGISTICS MARKET, 2016-2023 ($MILLION)
FIGURE 30. FRANCE CONNECTED LOGISTICS MARKET, 2016-2023 ($MILLION)
FIGURE 31. REST OF EUROPE CONNECTED LOGISTICS MARKET, 2016-2023 ($MILLION)
FIGURE 32. ASIA-PACIFIC: CONNECTED LOGISTICS MARKET
FIGURE 33. CHINA CONNECTED LOGISTICS MARKET, 2016-2023 ($MILLION)
FIGURE 34. INDIA CONNECTED LOGISTICS MARKET, 2016-2023 ($MILLION)
FIGURE 35. JAPAN CONNECTED LOGISTICS MARKET, 2016-2023 ($MILLION)
FIGURE 36. REST OF ASIA-PACIFIC CONNECTED LOGISTICS MARKET, 2016-2023 ($MILLION)
FIGURE 37. LAMEA: CONNECTED LOGISTICS MARKET
FIGURE 38. LATIN AMERICA CONNECTED LOGISTICS MARKET, 2016-2023 ($MILLION)
FIGURE 39. MIDDLE EAST CONNECTED LOGISTICS MARKET, 2016-2023 ($MILLION)
FIGURE 40. AFRICA CONNECTED LOGISTICS MARKET, 2016-2023 ($MILLION)
FIGURE 41. SAP: REVENUE, 2014-2016 ($MILLION)
FIGURE 42. SAP: REVENUE SHARE BY SEGMENT, 2016 (%)
FIGURE 43. SAP: REVENUE SHARE BY GEOGRAPHY, 2016 (%)
FIGURE 44. AT&T INC: REVENUE, 2014-2016 ($MILLION)
FIGURE 45. AT&T INC: REVENUE BY SEGMENT, 2016 (%)
FIGURE 46. AT&T INC: REVENUE BY GEOGRAPHY, 2016 (%)
FIGURE 47. SECURERF: REVENUE, 2014-2016 ($MILLION)
FIGURE 48. SECURERF: REVENUE SHARE BY SEGMENT, 2016 (%)
FIGURE 49. SECURERF: REVENUE SHARE BY GEOGRAPHY, 2016 (%)
FIGURE 50. CISCO SYSTEMS: REVENUE, 2015-2017 ($MILLION)
FIGURE 51. CISCO SYSTEMS: REVENUE BY SEGMENT, 2017 (%)
FIGURE 52. CISCO SYSTEMS: REVENUE BY GEOGRAPHY, 2017 (%)
FIGURE 53. ZEBRA TECHNOLOGIES: REVENUE, 2015-2017 ($MILLION)
FIGURE 54. ZEBRA TECHNOLOGIES: REVENUE BY SEGMENT, 2017 (%)
FIGURE 55. ZEBRA TECHNOLOGIES: REVENUE BY GEOGRAPHY, 2017 (%)
FIGURE 56. IBM CORPORATION: REVENUE, 2014-2016 ($MILLION)
FIGURE 57. IBM CORPORATION: REVENUE BY SEGMENT, 2016 (%)
FIGURE 58. IBM CORPORATION: REVENUE BY GEOGRAPHY, 2016 (%)
FIGURE 59. GT NEXUS: REVENUE, 2015-2017 ($MILLION)
FIGURE 60. GT NEXUS: REVENUE BY SEGMENT, 2017 (%)
FIGURE 61. GT NEXUS: REVENUE BY GEOGRAPHY, 2017 (%)
FIGURE 62. ORACLE: REVENUE, 2014-2016 ($MILLION)
FIGURE 63. ORACLE: REVENUE SHARE BY BUSINESS SEGMENT, 2016 (%)


The global connected logistics market is estimated to witness significant growth in Asia-Pacific and LAMEA, owing to high investment in IT, increased adoption of Logistics 4.0, growth associated with Big Data and Analytics & IoT market, and rise in demand for advanced Bluetooth solutions. The connected logistics market share is projected to grow at a CAGR of 7.60% from 2017 to 2023, owing to increase in demand for application-specific solutions in the developed and the developing regions.

Connected logistics is increasingly deployed in North America, followed by Europe, Asia-Pacific, and LAMEA. North America showed the highest market share in 2016 due to increase in penetration of Wi-Fi, enhanced internet infrastructure, government initiatives for smart cities, and rise in number of developmental strategies followed by market leaders for business expansion. The connected logistics market is impacted by the need to improve the overall accessibility & interoperability of the logistics business processes. However, implementation issues limit the connected logistics market growth.

The key players in connected logistics market are involved in the merger, acquisitions, and introduction of new features & capabilities to enhance their existing product portfolio. This is anticipated to increase the product penetration and enable key providers to establish themselves in the emerging markets. For example, in May 2017, Honeywell International Inc. introduced Connected Freight Solution for effective management of goods in transit.

PURCHASE OPTIONS

Call or Email us

U.S.-Canada Toll-free: +1-800-792-5285
Int'l : +1-503-894-6022
Europe : +44-845-528-1300
Email : help@alliedmarketresearch.com

Looking for Customization?

 Customization Request

Have a Question?

 Speak with Analyst

Any Confusion?

 Inquire Before Buying

Have a glance of the Report

  Request Sample

Purchase Full Report of
Connected Logistics Market

Start reading instantly.
This Report and over 68,075+ more Reports, Available with Avenue Library. T&C*.

  • Online Only
  • $3,456
  • Online cloud access only
  • Restricted print, copy, paste & download
  • Read only
  • Free industry update
    (Within 180 days)
  • Free report update in next update cycle
    (Feb 2019 - Feb 2020)
  • Data Pack
  • $3,840
  • Restricted to one authorized user
  • One print only
  • Available in
    Excel
  • Free industry update
    (Within 180 days)
  •   Free report update in next update cycle
    (Feb 2019 - Feb 2020)
  • Single User
  • $5,769
  • Restricted to one authorized user
  • One print only
  • Available in
    PDF
  • Free industry update
    (Within 180 days)
  •   Free report update in next update cycle
    (Feb 2019 - Feb 2020)
  • Five Users
  • $6,450
  • Limited to five authorized users
  • Print upto five copies
  • Available in
    PDF
  • Free industry update
    (Within 180 days)
  •   Free report update in next update cycle
    (Feb 2019 - Feb 2020)
  • Enterprise
    License/PDF

  • $10,995
  • Unlimited
    within
    company/enterprise
  • Available in Excel & PDF
  • Free industry update
    (Within 180 days)
  •   Free report update in next update cycle
    (Feb 2019 - Feb 2020)
  • Library
    Membership

  • $999 $ 1,175
    Per User/ Per month/ Billed annually
  • Published Content
    E-access
  • Company Profiles
    E-access
  • Newly Added Content Access
  • 10 PDF
    Downloads
  • 5 Excel Data
    Pack Downloads
  • 250 Company Profiles PDF Downloads
  • Buy Now

*Taxes/Fees, if applicable will be added during checkout. All prices in USD

RELATED REPORTS
 

Why Allied Market Research?


Infallible Methodology

To ensure high-level data integrity, accurate analysis, and impeccable forecasts

Analyst Support

For complete satisfaction

Customization

On-demand customization of scope of the report to exactly meet your needs

TARGETED MARKET VIEW

Targeted market view to provide pertinent information and save time of readers

Get fresh content delivered

Get insights on topics that are crucial for your business. Stay abreast of your interest areas.

Get Industry Data Alerts

Why Allied Market Research?

Infallible Methodology

To ensure high-level data integrity, accurate analysis, and impeccable forecasts

Analyst Support

For complete satisfaction

Customization

On-demand customization of scope of the report to exactly meet your needs

TARGETED MARKET VIEW

Targeted market view to provide pertinent information and save time of readers