
Connector Market Overview, 2032
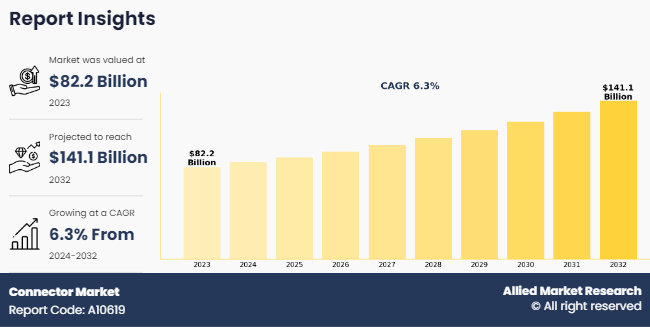
The global connector market was valued at $82.2 billion in 2023, and is projected to reach $141.1 billion by 2032, growing at a CAGR of 6.3% from 2024 to 2032. Connectors are essential electromechanical elements that act as crucial intermediaries within electronic and electrical systems. Their primary function is to establish a secure and dependable connection between different devices, enabling the transmission of signals, power, or data. Connectors are available in a diverse array of types and configurations, each tailored to specific applications. They are distinguished by their pin arrangements, contact materials, and housing designs, all of which enable them to effectively bridge connections in various electronic and electrical circuits.
The global connector market forecast is anticipated to witness significant growth during the forecast period. Factors such as rapid urbanization along with growth in demand for consumer electronic devices, high usage of automation technology across various sectors including industrial, defense, and automotive segment driving the growth of the market. In addition, the automotive segment is fueled by adoption of advanced safety features & the increase in number of electronic components in vehicles and rise in the number of autonomous vehicles globally. However, volatility in the raw material prices such as copper is a major restraint to global connector industry. In addition, surge in demand from telecom and automotive sector owing to emerging 5G, and IoT technology is expected to create opportunities for the market.
In the field of consumer electronics, connectors are integral to the design and assembly of devices such as smartphones, laptops, rca cable connector for televisions, and gaming consoles. They facilitate the interconnection of various internal components, including microprocessors, memory modules, displays, and cameras. This ensures the seamless operation of consumer electronics, guaranteeing they deliver the desired performance and functionality to end-users. Miniature connectors have gained prominence in this industry as the demand for smaller, more portable electronic devices continues to grow. They allow for compact and lightweight designs without compromising on connectivity or performance.
Segment Overview
The connector industry report size is segmented into product, end user and material, and region.

The PCB connector segment is expected to register the largest revenue of $ 22.05 billion in 2023. This is due to the growth of the electronics industry along with advances in semiconductor technology. Increased demand for automotive electronics is expected to drive the market during the forecast period.

A major application of connectors is in the realm of telecommunications, where they play a vital role in setting up and maintaining communication networks. This allows for the efficient transmission of voice, data, and video signals using RCA cable, RJ45, and quick connector for smartphones and electrical appliances. Connectors are widely utilized in a range of telecommunication equipment, including routers, switches, modems, and fiber optic transceivers such as RJ45, and quick connector for data centers. Telecom connectors guarantee reliable connections between different network components, contributing to the smooth operation of modern communication systems. Another significant area where connectors are indispensable is in the automotive industry which is anticipated to garner the highest connector market share during the forecast period. Connectors play a critical role as electronic systems become increasingly integrated into vehicles. They facilitate the connection of various components such as sensors, control units, lighting systems, and entertainment systems.

The copper segment accounted for the largest share of 32.8%. This is due to the rise in need for swift data transfer across various sectors. Copper is recognized for its outstanding electrical conductivity, this trend is especially prominent in fields such as telecommunications, data centers, and innovative technologies such as 5G networks. The other segment is expected to register the highest CAGR of 7.81%. This is due to titanium, gold, nickel, and brass materials in connectors offer diverse opportunities, advancing connectivity solutions across industries.

Asia-Pacific garnered the largest share of 7.11%. This is due to the swift industrialization, notably in nations such as China and India, has increased the requirement for electronic devices and infrastructure, amplifying the necessity for connectors. Furthermore, this region serves as a crucial point for the production and assembly of diverse sectors such as automotive, telecommunications, and consumer electronics, all of which are heavily dependent on connectors. In addition, supportive governmental policies, investments in technological progress, and a growth in consumer population bolster the Asia-Pacific leading position of this region in the market.
Competitive Analysis
Competitive analysis and profiles of the major global connector market players that have been provided in the report include are Koch Industries, Inc. (MOLEX), Aptiv PLC, Japan Aviation Electronics Industry, Ltd., ABB Ltd., TE Connectivity, Nexans, J.S.T. Mfg. Co., Ltd., Prysmian S.p.A., Amphenol Corporation, Foxconn Interconnect Technology Ltd, Huawei Technologies Co., Ltd., Luxshare Precision Industry Co., Ltd., Ametek Inc., 3M, and Hirose Electric Co., Ltd.
Historical Data & Information
The global connector market is highly competitive, owing to the strong presence of existing vendors. Vendors in the market with extensive technical and financial resources are expected to gain a competitive advantage over their competitors because they can cater to market demands. The competitive environment in the market is expected to worsen as technological innovations, product extensions, and different strategies adopted by key vendors increase.
Key Developments/ Strategies
Connector Company List are as follow such as Koch Industries, Inc. (MOLEX), Aptiv PLC, Japan Aviation Electronics Industry, Ltd., ABB Ltd., TE Connectivity, Nexans, J.S.T. Mfg. Co., Ltd., Prysmian S.p.A., Amphenol Corporation, Foxconn Interconnect Technology Ltd, Huawei Technologies Co., Ltd., Luxshare Precision Industry Co., Ltd., Ametek Inc., 3M, and Hirose Electric Co., Ltd. The key strategies adopted by the major players of the Connector market are product launch and business expansion.
- In October 2023, Amphenol will showcase its latest innovation in the field of connectors for electric vehicles at the Avnet Green Days: e-Mobility 2023 event in Hanoi and Ho Chi Minh, Vietnam, from October 24th to October 27th. The showcased products are DuraEV, MicroSpace High Voltage Crimp-to-Wire Connector, MicroSpaceXS 1.27mm Waterproof Crimp-to-Wire/Wire-to-Wire Connector, MicroSpace Crimp-To-Wire Connector, WireLock, USB, Ve-NET, NETBridge+, and HSBridge+.
- In August 2023, Molex, a leading global connectivity and electronics solutions provider, has captured a prestigious IoT Product Award at the recent OFweek 2023 (8th) IoT / AI Conference recently hosted in Shenzhen, China. Molex received the award for Mezz Pro and Mirror Mezz Enhanced high-speed connectors.
- In July 2023, ABB announced the launch of the world’s first full range of hinged high voltage connector backshells to heavy-duty electric vehicles (EV). Harnessflex EVO connector interfaces increase cable-to-connector stability in high voltage applications.
- In June 2023, FIT Hon Teng, a subsidiary of HonHai, received the "Red Dot Design Award", known as the "Oscar of the Design Industry." FIT focused on the hottest topic of AI and showcased its excellent design capabilities with its innovative 800G high-speed connector under the theme "FITCONN," winning the Design Concept Award. This innovative solution not only adheres to the specifications and design rules of existing data centers but also greatly improves data transmission efficiency.
- In March 2023, Hirose Electric announced the launch of the IT14 Series, a hermaphroditic board-to-board connector that supports up to 112Gbps PAM4 transmission speed. IT14 is the licensed second source for “Mirror Mezz”, which was developed by connector manufacturer Molex in 2018 for applications such as servers, data communications, and telecommunications equipment.
- In September 2022, Molex, a leading global electronics leader and connectivity innovator, announced its first-to-market, pluggable module solution for co-packaged optics (CPO). Its newExternal Laser Source Interconnect System (ELSIS) is a complete system of cage, optical and electrical connectors with a pluggable module that uses proven technology to speed the development of hyperscale data center.
Key Benefits For Stakeholders
- This report provides a quantitative analysis of the market segments, current trends, estimations, and dynamics of the connector market analysis from 2023 to 2032 to identify the prevailing connector market opportunities.
- The market research is offered along with information related to key drivers, restraints, and opportunities.
- Porter's five forces analysis highlights the potency of buyers and suppliers to enable stakeholders make profit-oriented business decisions and strengthen their supplier-buyer network.
- In-depth analysis of the global connector market and Connector for US Market segmentation assists to determine the prevailing market opportunities.
- Major countries in each region are mapped according to their revenue contribution to the global market, and connector market size by country, Connector Sector Analysis, Connector Market Data, Connector Market Insights.
- Market player positioning facilitates benchmarking and provides a clear understanding of the present position of the Connector Market Share by Companies, Cable Connectors, and Fiber Optic Connectors.
- The report includes the analysis of the regional as well as global connector market trends, key players, market segments, application areas, and market growth strategies.
Connector Market Report Highlights
| Aspects | Details |
| Market Size By 2032 | USD 141.1 billion |
| Growth Rate | CAGR of 6.3% |
| Forecast period | 2023 - 2032 |
| Report Pages | 309 |
| By Product |
|
| By End User |
|
| By Material |
|
| By Region |
|
| Key Market Players | Aptiv PLC, Huawei Technologies Co. Ltd., Koch Industries, Inc. (MOLEX), Belden Inc., Ametek Inc., ABB Ltd., Nexans, Amphenol Corporation, TE Connectivity, 3M |
Analyst Review
According to the insights of the CXOs of leading companies, a connector is an electromechanical device, which
joins one conductor electrically & mechanically with another conductor. Generally, it covers a wide range of
devices, such as joining small conductors in communication circuits, or at the other extreme, busbars, and large
cables.
It is extensively used on circuits for computers, communications, consumer electronics, and industrial machinery.
It may join two lengths of flexible copper cable or wire, or to connect a cable or wire to an electrical terminal.
However, in computing, a connector is generally known as a physical interface (physical layer of OSI model in
networking).
The key players of the market focus on introducing technologically advanced products to remain competitive
in the market. Product launch, acquisition, partnership, and expansion are expected to be the prominent
strategies adopted by the market players. Asia-Pacific accounted for a major share of the market in 2022, owing
to the presence of major players in the region. Moreover, Asia-Pacific is expected to grow at the highest CAGR,
owing to rise in adoption of connector market in a different sectors.
Rise of miniaturization, increased demand for high-speed data connectors driven by 5G and IoT adoption, and growing focus on environmentally sustainable materials and manufacturing processes are the upcoming trend of connector market in the globe.
Automotive is the leading application of connector market.
Asia-Pacific is the largest market for connector market.
In 2023, $82.1 billion was the estimated industry size of connector market.
Koch Industries, Inc. (MOLEX), Aptiv PLC, ABB Ltd., TE Connectivity, Nexans, Amphenol Corporation, Huawei Technologies Co., Ltd., Ametek Inc., 3M, and Belden Inc. are the top companies top hold the market share in the connector market
Loading Table Of Content...
Loading Research Methodology...

