0
2017
Construction Adhesives & Sealants Chemical Market

Construction Adhesives & Sealants Chemical Market

by Type (Water-Based Adhesives, Solvent-Based Adhesives, Hot Melt Adhesives, Pressure-Sensitive Adhesives, Acrylic Sealant, Silicone Sealant, Polyurethane Sealant, and Butyl Sealant) and Application (Residential, Commercial, Infrastructure, and Repair Structures) - Global Opportunity Analysis and Industry Forecast, 2015-2023

Report Code: A01753
May 2017 | Pages: 190
Tables: 87
Charts: 30
  • Formats*:

  • pdf

    Single User License, Five User
    License & Enterprise User License

  • xls

    Data Pack Excel License

  • ppt

    It comes with the additional cost
    of $2500.00 contact sales.


COVID-19

Pandemic disrupted the entire world and affected many industries.

Get detailed COVID-19 impact analysis on the Construction Adhesives & Sealants Chemical Market

Request Now !

Construction Adhesives & Sealants Chemical Market Overview:

Global Construction Adhesives & Sealants Chemical Market was valued at $7,131 million in 2016, and is expected to reach $12,844 million by 2023, growing at a CAGR of 8.8% from 2016 to 2023. Adhesive is a chemical mixture, which holds at least two surfaces together to form a single unit. Sealant is a semisolid substance, which is used to fill the space between the two surfaces, thereby providing a barrier or protective coating. Adhesives have high shear and tensile strength and are used for holding and bonding applications. Sealants are preferably used for their ability to fill gaps, and resist relative movement of the substrates. They are more flexible, but have lower strength than adhesives.

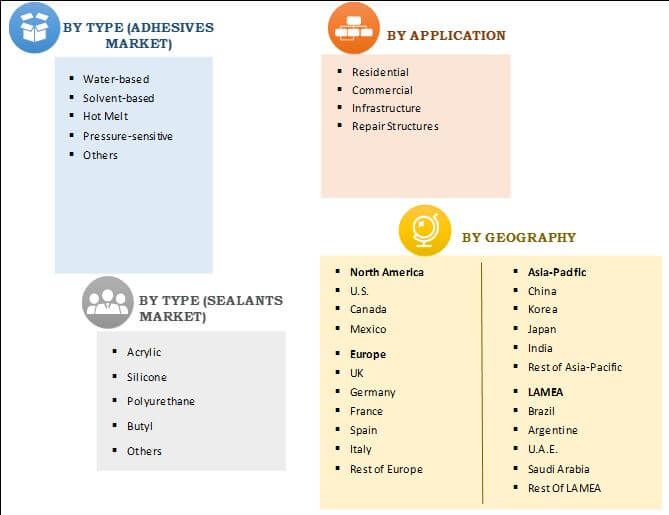
The global construction adhesives & sealants chemical market is segmented based on adhesive type, sealant type, application, and geography. On the basis of adhesive type, the market is divided into water-based, solvent-based, hot melt, pressure-sensitive, and others (reactive and formaldehyde adhesives). Sealants are classified into acrylic, silicone, polyurethane, butyl, and others (polysulfide, latex, and silyl-modified polymers sealants). Applications covered in the study include residential, commercial, infrastructure, and repair structures. Geographically, the market is analyzed across North America, Europe, Asia-Pacific, and LAMEA.

Construction Adhesives & Sealants Chemical Market Segmentation

Construction Adhesives & Sealants Chemical Market Segmentation

Top Investment Pocket

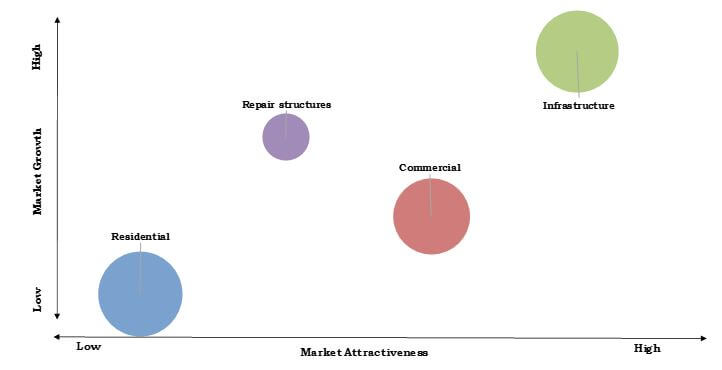
The residential segment accounted for about one-third share in 2016, and is expected to grow at a CAGR of 8.5% during the forecast period. Growth in urbanization has led to increase in construction of residential complexes and buildings, which in turn boosts the demand for adhesives & sealants. Construction firms initiate large number of residential projects with high-grade construction materials to provide improved structural integrity and sustainability.

Construction Adhesives & Sealants Chemical Market: Top Investment Pockets, By Application

Construction Adhesives & Sealants Chemical Market: Top Investment Pockets, By Application

Segment Review

Utilization of adhesives and sealants in infrastructure application was the most lucrative application segment, in terms of both value and volume, with three-tenth of the global market volume share. Developing economies like China, India, Brazil and Saudi Arabia are focusing on construction activities of basic infrastructural facilities, which is expected to boost up the demand for adhesives and sealants during the forecast period. Infrastructure application is expected to grow at a CAGR of 9.2% in terms of revenue.

LAMEA Review

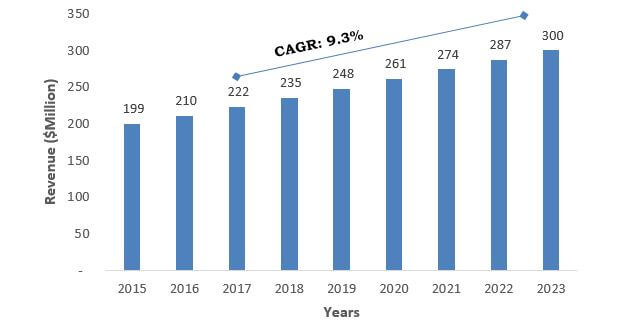
The emergence of new markets in the LAMEA region boosts construction schemes and improves lifestyle. As per the Brazilian Institute of Geography and Statistics, in 2012, the construction industry in Brazil accounted for about $109 billion. Owing to hosting of Rio Summer Olympics 2016, Brazil is an active province market for adhesives & sealants construction chemicals due to increased construction activities of golf course, swimming pools, volleyball stadium, subway links, and others. Thus, development in construction industry is expected to drive the growth of the market.

Brazil Construction Adhesives & Sealants Chemical Market, 2016-2023 ($Million)

Brazil Construction Adhesives & Sealants Chemical Market, 2016-2023 ($Million)

The major players operating in the global Adhesives & sealants construction chemical market are Henkel AG & Company, H.B. Fuller, Bostik SA, Sika AG, 3M Company, Illinois Tool Works Corporation, Avery Dennison Corporation, DAP Products, Royal Adhesives & Sealants, LLC, and Franklin International.

Other key players (not profiled in the report) operating in the market includes Henkel AG & Company, H.B. Fuller, Bostik SA, 3M Company, Illinois Tool Works Corporation, Avery Dennison Corporation, DAP Products, Royal Adhesives & Sealants, LLC and Franklin International

Key Benefits

  • This report provides the quantitative analysis of the current market and estimations from 2015 to 2023, which assists to identify the prevailing market opportunities
  • This report provides an extensive analysis of the current & emerging market trends and dynamics in the market
  • The study covers competitive landscape and value chain analysis, which help to understand the competitive environment across the geographies
  • An in-depth analysis of current R&D activities is provided that helps to understand the behavior of the market
  • Extensive analysis of segment by type helps in understanding the current adhesives & sealants construction chemical being used along with the variants that would gain prominence in the future
  • Extensive analysis of the market is conducted by following key product positioning and monitoring the top competitors within the market framework

Construction Adhesives & Sealants Chemical Market Report Highlights

Aspects Details
By Type
  • WATER-BASED ADHESIVES
  • SOLVENT-BASED ADHESIVES
  • HOT MELT ADHESIVES
  • PRESSURE-SENSITIVE ADHESIVES
  • ACRYLIC SEALANT
  • SILICONE SEALANT
  • POLYURETHANE SEALANT
  • BUTYL SEALANT
By Application
  • Residential
  • Commercial
  • Infrastructure
  • Repair Structures
By Geography
  • North America
    • U.S.
    • Canada
    • Mexico
  • Europe
    • Russia
    • Germany
    • France
    • Turkey
    • UK
    • Rest of Europe
  • Asia-Pacific
    • China
    • Japan
    • India
    • Rest of Asia-Pacific
  • LAMEA
    • Brazil
    • KSA
    • South Africa
    • Rest of LAMEA
Key Market Players BOSTIK SA, H.B. FULLER, HENKEL AG & COMPANY, ILLINOIS TOOL WORKS CORPORATION, AVERY DENNISON CORPORATION, 3M COMPANY, DAP PRODUCTS, FRANKLIN INTERNATIONAL, ROYAL ADHESIVES & SEALANTS, LLC, SIKA AG
 

CHAPTER 1. INTRODUCTION

1.1. REPORT DESCRIPTION
1.2. KEY BENEFITS
1.3. KEY MARKET SEGMENT
1.4. RESEARCH METHODOLOGY

1.4.1. Secondary Research
1.4.2. Primary Research
1.4.3. Analyst Tool & Model

CHAPTER 2. EXECUTIVE SUMMARY

2.1. MARKET SNAPSHOT
2.2. CXO PERSPECTIVES

CHAPTER 3. MARKET OVERVIEW

3.1. MARKET DEFINITION AND SCOPE
3.2. KEY FINDINGS

3.2.1. Top Investment Pockets
3.2.2. Top winning strategies

3.3. PORTERS FIVE FORCES ANALYSIS
3.4. MARKET DYNAMICS

3.4.1. Drivers

3.4.1.1. Growing investments in construction industry
3.4.1.2. Increase in housing and construction projects in emerging economies
3.4.1.3. Shift in preference towards hot-melt adhesives

3.4.2. Restraints

3.4.2.1. Volatility in raw material prices
3.4.2.2. Government regulations

3.4.3. Opportunities

3.4.3.1. Growing demand for low VOC, green and sustainable adhesives & sealants

3.5. MARKET SHARE ANALYSIS, 2015 (%)

CHAPTER 4. GLOBAL CONSTRUCTION ADHESIVES & SEALANTS CHEMICAL MARKET, BY TYPE

4.1. INTRODUCTION

4.1.1. Market Size and Forecast

4.2. WATER-BASED ADHESIVES

4.2.1. Key Market Trends, Growth Factors and Opportunities
4.2.2. Market Size and Forecast

4.3. SOLVENT-BASED ADHESIVES

4.3.1. Key Market Trends, Growth Factors and Opportunities
4.3.2. Market Size and Forecast

4.4. HOT MELT ADHESIVES

4.4.1. Key Market Trends, Growth Factors and Opportunities
4.4.2. Market Size and Forecast

4.5. PRESSURE-SENSITIVE ADHESIVES

4.5.1. Key Market Trends, Growth Factors and Opportunities
4.5.2. Market Size and Forecast

4.6. ACRYLIC SEALANT

4.6.1. Key Market Trends, Growth Factors and Opportunities
4.6.2. Market Size and Forecast

4.7. SILICONE SEALANT

4.7.1. Key Market Trends, Growth Factors and Opportunities
4.7.2. Market Size and Forecast

4.8. POLYURETHANE SEALANT

4.8.1. Key Market Trends, Growth Factors and Opportunities
4.8.2. Market Size and Forecast

4.9. BUTYL SEALANT

4.9.1. Key Market Trends, Growth Factors and Opportunities
4.9.2. Market Size and Forecast

CHAPTER 5. GLOBAL CONSTRUCTION ADHESIVES & SEALANTS CHEMICAL MARKET, BY APPLICATION

5.1. INTRODUCTION

5.1.1. Market Size and Forecast

5.2. RESIDENTIAL

5.2.1. Key Market Trends, Growth Factors and Opportunities
5.2.2. Market Size and Forecast

5.3. COMMERCIAL

5.3.1. Key Market Trends, Growth Factors and Opportunities
5.3.2. Market Size and Forecast

5.4. INFRASTRUCTURE

5.4.1. Key Market Trends, Growth Factors and Opportunities
5.4.2. Market Size and Forecast

5.5. REPAIR STRUCTURES

5.5.1. Key Market Trends, Growth Factors and Opportunities
5.5.2. Market Size and Forecast

CHAPTER 6. GLOBAL CONSTRUCTION ADHESIVES & SEALANTS CHEMICAL MARKET, BY GEOGRAPHY

6.1. INTRODUCTION

6.1.1. Market Size and Forecast

6.2. NORTH AMERICA

6.2.1. Key Market Trends, Growth Factors and Opportunities
6.2.2. Market Size and Forecast
6.2.3. U.S.

6.2.3.1. Market size and forecast, by application

6.2.4. Canada

6.2.4.1. Market size and forecast, by application

6.2.5. Mexico

6.2.5.1. Market size and forecast, by application

6.3. EUROPE

6.3.1. Key Market Trends, Growth Factors and Opportunities
6.3.2. Market Size and Forecast
6.3.3. Russia

6.3.3.1. Market size and forecast, by application

6.3.4. Germany

6.3.4.1. Market size and forecast, by application

6.3.5. France

6.3.5.1. Market size and forecast, by application

6.3.6. Turkey

6.3.6.1. Market size and forecast, by application

6.3.7. UK

6.3.7.1. Market size and forecast, by application

6.3.8. Rest of Europe

6.3.8.1. Market size and forecast, by application

6.4. ASIA-PACIFIC

6.4.1. Key Market Trends, Growth Factors and Opportunities
6.4.2. Market Size and Forecast
6.4.3. China

6.4.3.1. Market size and forecast, by application

6.4.4. Japan

6.4.4.1. Market size and forecast, by application

6.4.5. India

6.4.5.1. Market size and forecast, by application

6.4.6. Rest of Asia-Pacific

6.4.6.1. Market size and forecast, by application

6.5. LAMEA

6.5.1. Key Market Trends, Growth Factors and Opportunities
6.5.2. Market Size and Forecast
6.5.3. Brazil

6.5.3.1. Market size and forecast, by application

6.5.4. KSA

6.5.4.1. Market size and forecast, by application

6.5.5. South Africa

6.5.5.1. Market size and forecast, by application

6.5.6. Rest of LAMEA

6.5.6.1. Market size and forecast, by application

CHAPTER 7. COMPANY PROFILES

7.1. HENKEL AG & COMPANY

7.1.1. Company Overview
7.1.2. Company Snapshot
7.1.3. Operating Business Segments
7.1.4. Business Performance
7.1.5. Key Strategic Moves and Developments

7.2. H.B. FULLER

7.2.1. Company Overview
7.2.2. Company Snapshot
7.2.3. Operating Business Segments
7.2.4. Business Performance
7.2.5. Key Strategic Moves and Developments

7.3. BOSTIK SA

7.3.1. Company Overview
7.3.2. Company Snapshot
7.3.3. Operating Business Segments
7.3.4. Business Performance
7.3.5. Key Strategic Moves and Developments

7.4. SIKA AG

7.4.1. Company Overview
7.4.2. Company Snapshot
7.4.3. Operating Business Segments
7.4.4. Business Performance
7.4.5. Key Strategic Moves and Developments

7.5. 3M COMPANY

7.5.1. Company Overview
7.5.2. Company Snapshot
7.5.3. Operating Business Segments
7.5.4. Business Performance
7.5.5. Key Strategic Moves and Developments

7.6. ILLINOIS TOOL WORKS CORPORATION

7.6.1. Company Overview
7.6.2. Company Snapshot
7.6.3. Operating Business Segments
7.6.4. Business Performance
7.6.5. Key Strategic Moves and Developments

7.7. AVERY DENNISON CORPORATION

7.7.1. Company Overview
7.7.2. Company Snapshot
7.7.3. Operating Business Segments
7.7.4. Business Performance
7.7.5. Key Strategic Moves and Developments

7.8. DAP PRODUCTS

7.8.1. Company Overview
7.8.2. Company Snapshot
7.8.3. Operating Business Segments
7.8.4. Business Performance
7.8.5. Key Strategic Moves and Developments

7.9. ROYAL ADHESIVES & SEALANTS, LLC

7.9.1. Company Overview
7.9.2. Company Snapshot
7.9.3. Operating Business Segments
7.9.4. Business Performance
7.9.5. Key Strategic Moves and Developments

7.10. FRANKLIN INTERNATIONAL

7.10.1. Company Overview
7.10.2. Company Snapshot
7.10.3. Operating Business Segments
7.10.4. Business Performance
7.10.5. Key Strategic Moves and Developments

List of Tables

TABLE 1. GLOBAL CONSTRUCTION ADHESIVES & SEALANTS CHEMICAL MARKET VALUE, BY TYPE, 2015-2023 ($MILLION)
TABLE 2. GLOBAL CONSTRUCTION ADHESIVES & SEALANTS CHEMICAL MARKET VOLUME, BY TYPE, 2015-2023 (KILOTONS)
TABLE 3. GLOBAL WATER-BASED CONSTRUCTION ADHESIVES & SEALANTS CHEMICAL MARKET VALUE, BY REGION, 2015-2023 ($MILLION)
TABLE 4. GLOBAL WATER-BASED CONSTRUCTION ADHESIVES & SEALANTS CHEMICAL MARKET VOLUME, BY REGION, 2015-2023 (KILOTONS)
TABLE 5. GLOBAL SOLVENT-BASED CONSTRUCTION ADHESIVES & SEALANTS CHEMICAL MARKET VALUE, BY REGION, 2015-2023 ($MILLION)
TABLE 6. GLOBAL SOLVENT-BASED CONSTRUCTION ADHESIVES & SEALANTS CHEMICAL MARKET VOLUME, BY REGION, 2015-2023 (KILOTONS)
TABLE 7. GLOBAL HOT MELT CONSTRUCTION ADHESIVES & SEALANTS CHEMICAL MARKET VALUE, BY REGION, 2015-2023 ($MILLION)
TABLE 8. GLOBAL HOT MELT CONSTRUCTION ADHESIVES & SEALANTS CHEMICAL MARKET VOLUME, BY REGION, 2015-2023 (KILOTONS)
TABLE 9. GLOBAL PRESSURE-SENSITIVE CONSTRUCTION ADHESIVES & SEALANTS CHEMICAL MARKET VALUE, BY REGION, 2015-2023 ($MILLION)
TABLE 10. GLOBAL PRESSURE-SENSITIVE CONSTRUCTION ADHESIVES & SEALANTS CHEMICAL MARKET VOLUME, BY REGION, 2015-2023 (KILOTONS)
TABLE 11. GLOBAL ACRYLIC CONSTRUCTION ADHESIVES & SEALANTS CHEMICAL MARKET VALUE, BY REGION, 2015-2023 ($MILLION)
TABLE 12. GLOBAL ACRYLIC CONSTRUCTION ADHESIVES & SEALANTS CHEMICAL MARKET VOLUME, BY REGION, 2015-2023 (KILOTONS)
TABLE 13. GLOBAL SILICONE CONSTRUCTION ADHESIVES & SEALANTS CHEMICAL MARKET VALUE, BY REGION, 2015-2023 ($MILLION)
TABLE 14. GLOBAL SILICONE CONSTRUCTION ADHESIVES & SEALANTS CHEMICAL MARKET VOLUME, BY REGION, 2015-2023 (KILOTONS)
TABLE 15. GLOBAL POLYURETHANE CONSTRUCTION ADHESIVES & SEALANTS CHEMICAL MARKET VALUE, BY REGION, 2015-2023 ($MILLION)
TABLE 16. GLOBAL POLYURETHANE CONSTRUCTION ADHESIVES & SEALANTS CHEMICAL MARKET VOLUME, BY REGION, 2015-2023 (KILOTONS)
TABLE 17. GLOBAL BUTYL CONSTRUCTION ADHESIVES & SEALANTS CHEMICAL MARKET VALUE, BY REGION, 2015-2023 ($MILLION)
TABLE 18. GLOBAL BUTYL CONSTRUCTION ADHESIVES & SEALANTS CHEMICAL MARKET VOLUME, BY REGION, 2015-2023 (KILOTONS)
TABLE 19. GLOBAL CONSTRUCTION ADHESIVES & SEALANTS CHEMICAL MARKET VALUE, BY APPLICATION, 2015-2023 ($MILLION)
TABLE 20. GLOBAL CONSTRUCTION ADHESIVES & SEALANTS CHEMICAL MARKET VOLUME, BY APPLICATION, 2015-2023 (KILOTONS)
TABLE 21. GLOBAL RESIDENTIAL CONSTRUCTION ADHESIVES & SEALANTS CHEMICAL MARKET VALUE, BY REGION, 2015-2023 ($MILLION)
TABLE 22. GLOBAL RESIDENTIAL CONSTRUCTION ADHESIVES & SEALANTS CHEMICAL MARKET VOLUME, BY REGION, 2015-2023 (KILOTONS)
TABLE 23. GLOBAL COMMERCIAL CONSTRUCTION ADHESIVES & SEALANTS CHEMICAL MARKET VALUE, BY REGION, 2015-2023 ($MILLION)
TABLE 24. GLOBAL COMMERCIAL CONSTRUCTION ADHESIVES & SEALANTS CHEMICAL MARKET VOLUME, BY REGION, 2015-2023 (KILOTONS)
TABLE 25. GLOBAL INFRASTRUCTURE CONSTRUCTION ADHESIVES & SEALANTS CHEMICAL MARKET VALUE, BY REGION, 2015-2023 ($MILLION)
TABLE 26. GLOBAL INFRASTRUCTURE CONSTRUCTION ADHESIVES & SEALANTS CHEMICAL MARKET VOLUME, BY REGION, 2015-2023 (KILOTONS)
TABLE 27. GLOBAL REPAIR STRUCTURES CONSTRUCTION ADHESIVES & SEALANTS CHEMICAL MARKET VALUE, BY REGION, 2015-2023 ($MILLION)
TABLE 28. GLOBAL REPAIR STRUCTURES CONSTRUCTION ADHESIVES & SEALANTS CHEMICAL MARKET VOLUME, BY REGION, 2015-2023 (KILOTONS)
TABLE 29. GLOBAL CONSTRUCTION ADHESIVES & SEALANTS CHEMICAL MARKET VALUE, BY REGION, 2015-2023 ($MILLION)
TABLE 30. GLOBAL CONSTRUCTION ADHESIVES & SEALANTS CHEMICAL MARKET VOLUME, BY REGION, 2015-2023 (KILOTONS)
TABLE 31. NORTH AMERICA CONSTRUCTION ADHESIVES & SEALANTS CHEMICAL MARKET VALUE, BY TYPE, 2015-2023 ($MILLION)
TABLE 32. NORTH AMERICA CONSTRUCTION ADHESIVES & SEALANTS CHEMICAL MARKET VOLUME, BY TYPE, 2015-2023 (KILOTONS)
TABLE 33. NORTH AMERICA CONSTRUCTION ADHESIVES & SEALANTS CHEMICAL MARKET VALUE, BY APPLICATION, 2015-2023 ($MILLION)
TABLE 34. NORTH AMERICA CONSTRUCTION ADHESIVES & SEALANTS CHEMICAL MARKET VOLUME, BY APPLICATION, 2015-2023 (KILOTONS)
TABLE 35. NORTH AMERICA CONSTRUCTION ADHESIVES & SEALANTS CHEMICAL MARKET VALUE, BY COUNTRY, 2015-2023 ($MILLION)
TABLE 36. NORTH AMERICA CONSTRUCTION ADHESIVES & SEALANTS CHEMICAL MARKET VOLUME, BY COUNTRY, 2015-2023 (KILOTONS)
TABLE 37. U.S. CONSTRUCTION ADHESIVES & SEALANTS CHEMICAL MARKET VALUE, BY APPLICATION, 2015-2023 ($MILLION)
TABLE 38. CANADA CONSTRUCTION ADHESIVES & SEALANTS CHEMICAL MARKET VALUE, BY APPLICATION, 2015-2023 ($MILLION)
TABLE 39. MEXICO CONSTRUCTION ADHESIVES & SEALANTS CHEMICAL MARKET VALUE, BY APPLICATION, 2015-2023 ($MILLION)
TABLE 40. EUROPE CONSTRUCTION ADHESIVES & SEALANTS CHEMICAL MARKET VALUE, BY TYPE, 2015-2023 ($MILLION)
TABLE 41. EUROPE CONSTRUCTION ADHESIVES & SEALANTS CHEMICAL MARKET VOLUME, BY TYPE, 2015-2023 (KILOTONS)
TABLE 42. EUROPE CONSTRUCTION ADHESIVES & SEALANTS CHEMICAL MARKET VALUE, BY APPLICATION, 2015-2023 ($MILLION)
TABLE 43. EUROPE CONSTRUCTION ADHESIVES & SEALANTS CHEMICAL MARKET VOLUME, BY APPLICATION, 2015-2023 (KILOTONS)
TABLE 44. EUROPE CONSTRUCTION ADHESIVES & SEALANTS CHEMICAL MARKET VALUE, BY COUNTRY, 2015-2023 ($MILLION)
TABLE 45. EUROPE CONSTRUCTION ADHESIVES & SEALANTS CHEMICAL MARKET VOLUME, BY COUNTRY, 2015-2023 (KILOTONS)
TABLE 46. RUSSIA CONSTRUCTION ADHESIVES & SEALANTS CHEMICAL MARKET VALUE, BY APPLICATION, 2015-2023 ($MILLION)
TABLE 47. GERMANY CONSTRUCTION ADHESIVES & SEALANTS CHEMICAL MARKET VALUE, BY APPLICATION, 2015-2023 ($MILLION)
TABLE 48. FRANCE CONSTRUCTION ADHESIVES & SEALANTS CHEMICAL MARKET VALUE, BY APPLICATION, 2015-2023 ($MILLION)
TABLE 49. TURKEY CONSTRUCTION ADHESIVES & SEALANTS CHEMICAL MARKET VALUE, BY APPLICATION, 2015-2023 ($MILLION)
TABLE 50. UK CONSTRUCTION ADHESIVES & SEALANTS CHEMICAL MARKET VALUE, BY APPLICATION, 2015-2023 ($MILLION)
TABLE 51. REST OF EUROPE CONSTRUCTION ADHESIVES & SEALANTS CHEMICAL MARKET VALUE, BY APPLICATION, 2015-2023 ($MILLION)
TABLE 52. ASIA-PACIFIC CONSTRUCTION ADHESIVES & SEALANTS CHEMICAL MARKET VALUE, BY TYPE, 2015-2023 ($MILLION)
TABLE 53. ASIA-PACIFIC CONSTRUCTION ADHESIVES & SEALANTS CHEMICAL MARKET VOLUME, BY TYPE, 2015-2023 (KILOTONS)
TABLE 54. ASIA-PACIFIC CONSTRUCTION ADHESIVES & SEALANTS CHEMICAL MARKET VALUE, BY APPLICATION, 2015-2023 ($MILLION)
TABLE 55. ASIA-PACIFIC CONSTRUCTION ADHESIVES & SEALANTS CHEMICAL MARKET VOLUME, BY APPLICATION, 2015-2023 (KILOTONS)
TABLE 56. ASIA-PACIFIC CONSTRUCTION ADHESIVES & SEALANTS CHEMICAL MARKET VALUE, BY COUNTRY, 2015-2023 ($MILLION)
TABLE 57. ASIA-PACIFIC CONSTRUCTION ADHESIVES & SEALANTS CHEMICAL MARKET VOLUME, BY COUNTRY, 2015-2023 (KILOTONS)
TABLE 58. CHINA CONSTRUCTION ADHESIVES & SEALANTS CHEMICAL MARKET VALUE, BY APPLICATION, 2015-2023 ($MILLION)
TABLE 59. JAPAN CONSTRUCTION ADHESIVES & SEALANTS CHEMICAL MARKET VALUE, BY APPLICATION, 2015-2023 ($MILLION)
TABLE 60. INDIA CONSTRUCTION ADHESIVES & SEALANTS CHEMICAL MARKET VALUE, BY APPLICATION, 2015-2023 ($MILLION)
TABLE 61. REST OF ASIA-PACIFIC CONSTRUCTION ADHESIVES & SEALANTS CHEMICAL MARKET VALUE, BY APPLICATION, 2015-2023 ($MILLION)
TABLE 62. LAMEA CONSTRUCTION ADHESIVES & SEALANTS CHEMICAL MARKET VALUE, BY TYPE, 2015-2023 ($MILLION)
TABLE 63. LAMEA CONSTRUCTION ADHESIVES & SEALANTS CHEMICAL MARKET VOLUME, BY TYPE, 2015-2023 (KILOTONS)
TABLE 64. LAMEA CONSTRUCTION ADHESIVES & SEALANTS CHEMICAL MARKET VALUE, BY APPLICATION, 2015-2023 ($MILLION)
TABLE 65. LAMEA CONSTRUCTION ADHESIVES & SEALANTS CHEMICAL MARKET VOLUME, BY APPLICATION, 2015-2023 (KILOTONS)
TABLE 66. LAMEA CONSTRUCTION ADHESIVES & SEALANTS CHEMICAL MARKET VALUE, BY COUNTRY, 2015-2023 ($MILLION)
TABLE 67. ASIA-PACIFIC CONSTRUCTION ADHESIVES & SEALANTS CHEMICAL MARKET VOLUME, BY COUNTRY, 2015-2023 (KILOTONS)
TABLE 68. BRAZIL CONSTRUCTION ADHESIVES & SEALANTS CHEMICAL MARKET VALUE, BY APPLICATION, 2015-2023 ($MILLION)
TABLE 69. KSA CONSTRUCTION ADHESIVES & SEALANTS CHEMICAL MARKET VALUE, BY APPLICATION, 2015-2023 ($MILLION)
TABLE 70. SOUTH AFRICA CONSTRUCTION ADHESIVES & SEALANTS CHEMICAL MARKET VALUE, BY APPLICATION, 2015-2023 ($MILLION)
TABLE 71. REST OF LAMEA CONSTRUCTION ADHESIVES & SEALANTS CHEMICAL MARKET VALUE, BY APPLICATION, 2015-2023 ($MILLION)
TABLE 72. HENKEL AG & COMPANY: COMPANY SNAPSHOT
TABLE 73. HENKEL AG & COMPANY: OPERATING SEGMENTS
TABLE 74. H.B. FULLER: COMPANY SNAPSHOT
TABLE 75. H.B. FULLER: OPERATING SEGMENTS
TABLE 76. BOSTIK SA: COMPANY SNAPSHOT
TABLE 77. BOSTIK SA: OPERATING SEGMENTS
TABLE 78. SIKA AG: COMPANY SNAPSHOT
TABLE 79. SIKA AG: OPERATING SEGMENTS
TABLE 80. 3M COMPANY: COMPANY SNAPSHOT
TABLE 81. 3M COMPANY: OPERATING SEGMENTS
TABLE 82. ILLINOIS TOOL WORKS CORPORATION: COMPANY SNAPSHOT
TABLE 83. ILLINOIS TOOL WORKS CORPORATION: OPERATING SEGMENTS
TABLE 84. AVERY DENNISON CORPORATION: COMPANY SNAPSHOT
TABLE 85. AVERY DENNISON CORPORATION: OPERATING SEGMENTS
TABLE 86. DAP PRODUCTS: COMPANY SNAPSHOT
TABLE 87. DAP PRODUCTS: OPERATING SEGMENTS
TABLE 88. ROYAL ADHESIVES & SEALANTS, LLC: COMPANY SNAPSHOT
TABLE 89. ROYAL ADHESIVES & SEALANTS, LLC: OPERATING SEGMENTS
TABLE 90. FRANKLIN INTERNATIONAL: COMPANY SNAPSHOT
TABLE 91. FRANKLIN INTERNATIONAL: OPERATING SEGMENTS

List of Figures

FIGURE 1. GLOBAL CONSTRUCTION ADHESIVES & SEALANTS CHEMICAL MARKET, 2015-2023
FIGURE 2. GLOBAL CONSTRUCTION ADHESIVES & SEALANTS CHEMICAL MARKET: SEGMENTATION
FIGURE 3. TOP INVESTMENT POCKETS, BY APPLICATION
FIGURE 4. TOP WINNING STRATEGIES
FIGURE 5. BARGAINING POWER OF SUPPLIERS
FIGURE 6. BARGAINING POWER OF BUYERS
FIGURE 7. THREAT OF NEW ENTRANTS
FIGURE 8. THREAT OF SUBSTITUTES
FIGURE 9. COMPETITIVE RIVALRY
FIGURE 10. GLOBAL CONSTRUCTION ADHESIVES & SEALANTS CHEMICAL MARKET: DRIVERS AND RESTRAINTS
FIGURE 11. GLOBAL CONSTRUCTION ADHESIVES & SEALANTS CHEMICAL MARKET SHARE, BY TYPE, 2016 (%)
FIGURE12. GLOBAL CONSTRUCTION ADHESIVES & SEALANTS CHEMICAL MARKET SHARE, BY APPLICATION, 2016 (%)
FIGURE 13. GLOBAL CONSTRUCTION ADHESIVES & SEALANTS CHEMICAL MARKET SHARE, BY REGION, 2016 (%)
FIGURE 14. U.S. CONSTRUCTION ADHESIVES & SEALANTS CHEMICAL MARKET VALUE, 2015-2023 ($MILLION)
FIGURE 15. CANADA CONSTRUCTION ADHESIVES & SEALANTS CHEMICAL MARKET VALUE, 2015-2023 ($MILLION)
FIGURE 16. MEXICO CONSTRUCTION ADHESIVES & SEALANTS CHEMICAL MARKET VALUE, 2015-2023 ($MILLION)
FIGURE 17. RUSSIA CONSTRUCTION ADHESIVES & SEALANTS CHEMICAL MARKET VALUE, 2015-2023 ($MILLION)
FIGURE 18. GERMANY CONSTRUCTION ADHESIVES & SEALANTS CHEMICAL MARKET VALUE, 2015-2023 ($MILLION)
FIGURE 19. FRANCE CONSTRUCTION ADHESIVES & SEALANTS CHEMICAL MARKET VALUE, 2015-2023 ($MILLION)
FIGURE 20. TURKEY CONSTRUCTION ADHESIVES & SEALANTS CHEMICAL MARKET VALUE, 2015-2023 ($MILLION)
FIGURE 21. UK CONSTRUCTION ADHESIVES & SEALANTS CHEMICAL MARKET VALUE, 2015-2023 ($MILLION)
FIGURE 22. REST OF EUROPE CONSTRUCTION ADHESIVES & SEALANTS CHEMICAL MARKET VALUE, 2015-2023 ($MILLION)
FIGURE 23. CHINA CONSTRUCTION ADHESIVES & SEALANTS CHEMICAL MARKET VALUE, 2015-2023 ($MILLION)
FIGURE 24. JAPAN CONSTRUCTION ADHESIVES & SEALANTS CHEMICAL MARKET VALUE, 2015-2023 ($MILLION)
FIGURE 25. INDIA CONSTRUCTION ADHESIVES & SEALANTS CHEMICAL MARKET VALUE, 2015-2023 ($MILLION)
FIGURE 26. REST OF ASIA-PACIFIC CONSTRUCTION ADHESIVES & SEALANTS CHEMICAL MARKET VALUE, 2015-2023 ($MILLION)
FIGURE 27. BRAZIL CONSTRUCTION ADHESIVES & SEALANTS CHEMICAL MARKET VALUE, 2015-2023 ($MILLION)
FIGURE 28. KSA CONSTRUCTION ADHESIVES & SEALANTS CHEMICAL MARKET VALUE, 2015-2023 ($MILLION)
FIGURE 29. SOUTH AFRICA CONSTRUCTION ADHESIVES & SEALANTS CHEMICAL MARKET VALUE, 2015-2023 ($MILLION)
FIGURE 30. REST OF LAMEA CONSTRUCTION ADHESIVES & SEALANTS CHEMICAL MARKET VALUE, 2015-2023 ($MILLION)


Adhesives are chemical mixtures, which are used to hold two or more surfaces together to form a single unit. Sealants are semisolid substances, which are used to fill the space between the two surfaces, thereby providing a barrier or protective coating. Adhesives have high shear and tensile strength and are used for holding and bonding applications. Sealants are used for their ability to fill gaps, and resist relative movement of the substrates. They are more flexible, but have lower strength than adhesives. Adhesives & sealants improve the stress distribution in the structures, help enhance structural integrity, dampen vibration or movement in structure, seal dissimilar substrates, and act as protective seal in harsh environmental conditions. These characteristics drive the demand for adhesives & sealants construction chemicals in complex modern structures.

Improvements in lifestyle patterns in emerging countries such as China, India, Brazil, Middle East, and Africa boost the demand for housing and commercial infrastructure. Expansion of production facilities of adhesives & sealants to meet the surging demands in the emerging economies such as India and China has a positive impact on the market growth.

PURCHASE OPTIONS

Call or Email us

U.S.-Canada Toll-free: +1-800-792-5285
Int'l : +1-503-894-6022
Europe : +44-845-528-1300
Email : help@alliedmarketresearch.com

Looking for Customization?

 Customization Request

Have a Question?

 Speak with Analyst

Any Confusion?

 Inquire Before Buying

Have a glance of the Report

  Request Sample

Purchase Full Report of
Construction Adhesives & Sealants Chemical Market

Start reading instantly.
This Report and over 67,404+ more Reports, Available with Avenue Library. T&C*.

  • Online Only
  • $3,217
  • Online cloud access only
  • Restricted print, copy, paste & download
  • Read only
  • Free industry update
    (Within 180 days)
  • Free report update in next update cycle
    (May 2018 - May 2019)
  • Data Pack
  • $3,574
  • Restricted to one authorized user
  • One print only
  • Available in
    Excel
  • Free industry update
    (Within 180 days)
  •   Free report update in next update cycle
    (May 2018 - May 2019)
  • Single User
  • $4,999
  • Restricted to one authorized user
  • One print only
  • Available in
    PDF
  • Free industry update
    (Within 180 days)
  •   Free report update in next update cycle
    (May 2018 - May 2019)
  • Five Users
  • $6,004
  • Limited to five authorized users
  • Print upto five copies
  • Available in
    PDF
  • Free industry update
    (Within 180 days)
  •   Free report update in next update cycle
    (May 2018 - May 2019)
  • Enterprise
    License/PDF

  • $9,373
  • Unlimited
    within
    company/enterprise
  • Available in Excel & PDF
  • Free industry update
    (Within 180 days)
  •   Free report update in next update cycle
    (May 2018 - May 2019)
  • Library
    Membership

  • $999 $ 1,175
    Per User/ Per month/ Billed annually
  • Published Content
    E-access
  • Company Profiles
    E-access
  • Newly Added Content Access
  • 10 PDF
    Downloads
  • 5 Excel Data
    Pack Downloads
  • 250 Company Profiles PDF Downloads
  • Buy Now

*Taxes/Fees, if applicable will be added during checkout. All prices in USD

RELATED REPORTS
 

Why Allied Market Research?


Infallible Methodology

To ensure high-level data integrity, accurate analysis, and impeccable forecasts

Analyst Support

For complete satisfaction

Customization

On-demand customization of scope of the report to exactly meet your needs

TARGETED MARKET VIEW

Targeted market view to provide pertinent information and save time of readers

Get fresh content delivered

Get insights on topics that are crucial for your business. Stay abreast of your interest areas.

Get Industry Data Alerts

Why Allied Market Research?

Infallible Methodology

To ensure high-level data integrity, accurate analysis, and impeccable forecasts

Analyst Support

For complete satisfaction

Customization

On-demand customization of scope of the report to exactly meet your needs

TARGETED MARKET VIEW

Targeted market view to provide pertinent information and save time of readers