0
New
New
2023
Construction Aggregates Market

Construction Aggregates Market

by Type (Crushed Stone, Sand and Gravel), by Application (Non-Residential, Residential), by Transportation Mode (Truck, Train, Ship): Global Opportunity Analysis and Industry Forecast, 2023-2032

Report Code: A07987
Aug 2023 | Pages: 192
Tables: 118
Charts: 69
  • Formats*:

  • pdf

    Single User License, Five User
    License & Enterprise User License

  • xls

    Data Pack Excel License

  • ppt

    It comes with the additional cost
    of $2500.00 contact sales.


Construction Aggregates Market Research, 2032

The global construction aggregates market size was valued at $375.3 billion in 2021, and is projected to reach $667.8 billion by 2032, growing at a CAGR of 5.2% from 2023 to 2032. 
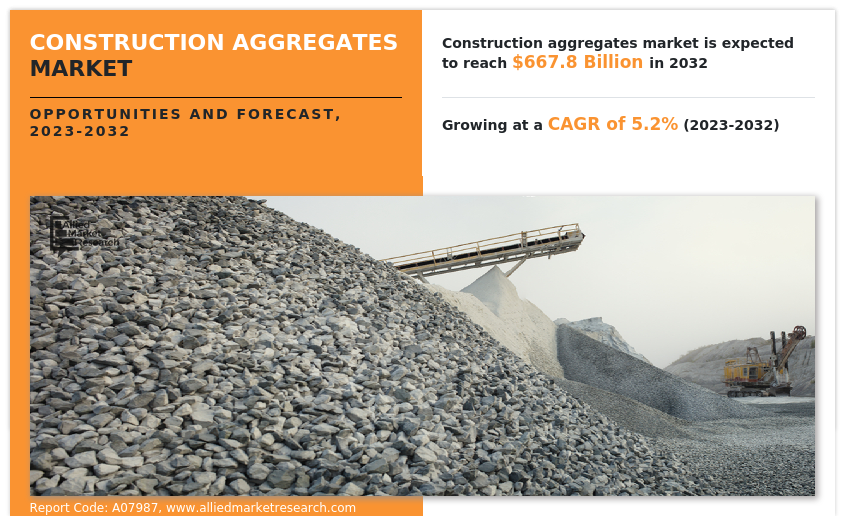
Aggregate is the most mined granular product in the world. It is the basic component of composite materials such as concrete and asphalt concrete. These materials are extracted from natural sediments such as granite, limestone, and falling rocks by finely drilling and blasting them. These aggregates are used as foundation materials under airport runaways, highways, railroads, and parking lots. Aggregates are also used for water filtration, purification, and control of soil erosion. As the supply-demand gap for natural sand remains unfilled, construction aggregates have emerged as a viable solution to solve infrastructure problems. Moreover, owing to serious concerns about depletion of natural resources, construction aggregate remains a component of infrastructure, commercial, industrial, and housing development projects.

The construction aggregates market is anticipated to grow with a considerable CAGR in the coming decade, however, the market is negatively impacted by the inflation triggered by the war in Ukraine and the impact of the coronavirus pandemic. The high prices of raw materials and the continued rise in the cost of energy have severe impacts on the end-users of construction aggregates; thereby, limiting the construction aggregates market growth.

Construction Aggregates Market

Market Dynamics

Rapidly growing urbanization and industrialization across the world are positively affecting the construction industry, eventually leading to an increase in demand for various construction materials including construction aggregates. According to the United Nations, the global population will rise to 9.7 billion by 2050, an increase of 1.7 billion as compared to 2023. This will lead to the overcrowding of the cities in the world, which will require new buildings to be constructed and will also increase the built-up area. For instance, according to the World Bank, there were 794,432 Built Up Areas (BUAs) globally in 2016, which it had estimated to reach 849,407 by 2022. Additionally, the construction of residential and commercial buildings such as shopping malls, hospitals, schools, and others are also rising all across the world. For instance, as of January 2023, a well-known building developer ‘Triple Five Group’ has planned to construct American Dream Mall near Everglades National Park in Florida. Furthermore, innovation in the construction sector, and rise in tourism activities, and rapid infrastructural development are some other factors expected to support the growth of the construction aggregates market to a significant extent. For example, the U.S. spends significantly in the construction and repair of new and old road infrastructure, respectively. According to the Council on Foreign Relations of the U.S., the projected investment by public and private entities on the roads between 2016 and 2040 is $3.42 trillion. In addition, the U.S. Bipartisan Infrastructure Law which was passed in November 2021, allocated $110 billion to be spent on construction and repair & maintenance of roads, and bridges as well as other major projects. This and many other such projects are anticipated to have a positive influence on the construction aggregates market.

However, the high transportation cost of construction aggregates is expected to restrict the market growth. Transportation cost amounts to around 50% of the overall administrative cost incurred on construction aggregates as construction locations are far away from mining sites. Hence, high transportation costs of aggregates are expected to negatively affect the construction aggregates market outlook during the forecast period.

Moreover, innovations in technologies for the production of aggregates to increase the efficiency of the manufacturing process and productivity with high-quality products are expected to drive global construction aggregates market growth during the forecast period. For instance, Hydro-Clean washing unit by Haver & Boecker cleans toxic materials from aggregates and reduces water consumption by around 75% as compared to conventional wooden washers. Furthermore, the initiation of Building Information Modeling (BIM) is rapidly accompanying digital transformation in the construction sector. BIM provides support in terms of time management, cost planning, and sustainability for the use of raw materials, waste reduction, and overall project performance improvement. These factors are expected to drive the market growth.

The construction aggregates market witnesses various obstructions in its regular operations due to the COVID-19 pandemic and inflation. Earlier, the global lockdowns resulted in reduced construction activities, eventually leading to reduced demand for construction aggregates. However, COVID-19 has subsided, and the major aggregate producers in 2023 are performing well. Contrarily, the rise in global inflation is a new major obstructing factor for the entire construction and manufacturing industry. The inflation, which is a direct result of the Ukraine-Russia war and few long-term impacts of the coronavirus pandemic, has introduced volatility in the prices of construction aggregates. In addition, the cost of oil & gas has also increased substantially, and in many countries; it has increased the cost of shipping which further negatively affects the construction aggregates market. However, India and China are performing relatively well, and there is no notable decline in the demand for construction aggregates. Inflation has also resulted in increased interest rates, which eventually discourages builders from initiating any construction project.  In addition, inflation is expected to worsen in the coming years, as the possibility of the ending of the war between Ukraine and Russia is less. However, with the continued talks between different countries, a peace agreement between Ukraine and Russia can be devised, which is expected to end the war between them and reduce the global inflation.

Segmental Overview

The construction aggregates market is segmented into type, applications, transportation mode, and region. By type, the market is divided into crushed stone and sand & gravel. As per application, it is categorized into residential and non-residential. According to transportation method, it is segmented into trucks, trains, and ships. Region wise, the market analysis is conducted across North America (the U.S., Canada, and Mexico), Europe (the UK, France, Germany, Italy, and rest of Europe), Asia-Pacific (China, Japan, India, South Korea, and rest of Asia-Pacific), and LAMEA (Latin America, the Middle East, and Africa).

Construction Aggregates Market

By type: The construction aggregates market is divided into crushed stone and sand & gravel. In 2022, the sand & gravel segment dominated the construction aggregates market share in terms of revenue, and the crushed stone segment is expected to grow with a higher CAGR during the forecast period. Demand for crushed stones is growing, owing to demand from building & construction, and transport infrastructure sectors for different applications such as roadway construction and manufacturing of concrete. Moreover, rapid urbanization and growth in demand for construction materials in different developing countries drive demand for sand and gravel, which is the crucial ingredient. In addition, sand is used for various applications such as sand-blasting, industrial casting, oil & water filtration, coal-burning boilers, foundries, glass making, and paving road.

Construction Aggregates Market

By application: The construction aggregates market is divided into residential and non-residential. In 2022, the non-residential segment dominated the construction aggregates market, in terms of revenue, and the residential segment is expected to dominate the construction aggregates market forecast by growing with a higher CAGR. The saturation of major cities has led governments to expand the boundaries of existing cities or planning of a completely new city to balance the development and economy of all parts of a country. Such city expansion and development plans are likely to result in the building of new residential developments, providing attractive potential for the growth of the construction aggregate industry. Furthermore, commercialization, urbanisation, and industrialisation have resulted in the creation of new and luxury office premises in major cities across the world. In addition, as part of development programmes, numerous new airports and shopping complexes are being developed in several nations.

Construction Aggregates Market

By transportation mode: The construction aggregates market is divided into trucks, trains, and ships. The truck segment accounted for the highest market share in 2022, owing to its ability to reach the last mile, which is impossible with trains and ships. However, the trains segment is anticipated to register a higher growth rate during the forecast period, owing to advancements in trains and ever-increasing distance between the mining site and the construction sites.

Construction Aggregates Market

By region: Asia-Pacific accounted for the highest market share in 2022 and LAMEA is expected to grow with the highest CAGR during the forecast period. Asia-Pacific is a highly developing region with the fastest-growing population. According to the United Nations, nearly two-thirds of the world population resides in Asia-Pacific, with China and India alone accounting for one-third of the global population. In addition, the rate of urbanization in Asia-Pacific is also high. Thus, owing to high population growth and urbanization in the region, the construction sector has witnessed a rapid rise, thereby, demand for construction aggregates, which are extensively used in the construction sector is anticipated to rise in the coming years. However, LAMEA holds a greater potential for growth, which is anticipated to be a major reason for the rise in demand for construction aggregates. In addition, countries in Africa are experiencing rapid economic and population growth, which is expected to bring demand for construction aggregates to construct residential and non-residential projects.

  Competition Analysis

Competitive analysis and profiles of the major players in the construction aggregates market are provided in the report. Major companies in the report include Adelaide Brighton Ltd., CEMEX S.A.B. de C.V., CRH plc, Heidelberg Cement AG, HOLCIM, Martin Marietta Materials Inc., ROGERS GROUP INC., SIKA Group, Vicat SA, and Vulcan Materials Company.

To remain competitive major players adopt development strategies such as product launches, acquisitions, and expansion. For instance, in January 2023, Holcim US acquired the sand and aggregate operations of Pioneer Landscape Centers. This acquisition is anticipated to help Holcim to acquire a significant aggregates market share of Denver, Colorado Springs, and Phoenix in the U.S. Similarly, in June 2023, Afrimat, a major building materials provider, acquired Lafarge South Africa Holdings (Pty) Ltd. (LSA). This acquisition is expected to help Afrimat expand its product portfolio as well as customer base in Africa region.


Key Benefits for Stakeholders

  • The report provides an extensive analysis of the current and emerging construction aggregates market trends and historic data. 
  • In-depth construction aggregates market analysis is conducted by constructing market estimations for key market segments between 2021 and 2032.
  • Extensive analysis of the construction aggregates market is conducted by following key product positioning and monitoring of top competitors within the market framework.
  • A comprehensive analysis of all the regions is provided to determine the prevailing opportunities.
  • The construction aggregates market revenue and volume forecast analysis from 2023 to 2032 is included in the report.
  • The key players within the construction aggregates market are profiled in this report and their strategies are analyzed thoroughly, which help understand the competitive outlook of the construction aggregates industry.

Construction Aggregates Market Report Highlights

Aspects Details
Market Size By 2032 USD 667.8 billion
Growth Rate CAGR of 5.2%
Forecast period 2021 - 2032
Report Pages 192
By Type
  • Crushed Stone
  • Sand and Gravel
By Application
  • Non-Residential
  • Residential
By Transportation Mode
  • Truck
  • Train
  • Ship
By Region
  • North America  (U.S., Canada, Mexico)
  • Europe  (Germany, UK, France, Italy, Rest of Europe)
  • Asia-Pacific  (China, Japan, South Korea, India, Rest of Asia-Pacific)
  • LAMEA  (Latin America, Middle East, Africa)
Key Market Players CRH, HeidelbergCement AG, Vulcan Materials Company, CEMEX S.A.B. de C.V., Vicat SA, Holcim Ltd., Adelaide Brighton Ltd., Martin Marietta Materials Inc., Sika AG, Rogers Group Inc.

Analyst Review

The global construction aggregates market witnessed a huge demand in Asia-Pacific followed by Europe & North America. The highest share of the Asia-Pacific market is attributed to increased awareness regarding concrete construction and the use of cheaper crushed stone aggregates.

Global population is increasing with rise in urbanization. Hence, increasing population is leading to challenges for road network and public transportation services. Thus, countries are building smart cities to ease congestion caused due to growing population. In addition, this leads to increasing government expenditures for infrastructural development, such as improvement of roads and bridges. Growth in demand for construction & infrastructure developments largely drives the construction aggregate market.

Industries such as construction and tunnels require construction aggregates and other construction materials. By 2040, the global population is estimated to grow by approximately two billion with the urban population growing by 46%, triggering massive demand for infrastructure support such as roads, subways, tunnels, common areas, and commercial infrastructures. Therefore, this, in turn, is expected to drive the construction aggregates market.

Furthermore, drone-based inspection, autonomous equipment, collaborative robots, and labor terrain mapping helps in reducing labor cost and increasing accuracy along with the productivity of work. This helps in reducing the cost of overall construction project, eventually propelling the construction sector.

 
  • CHAPTER 1: INTRODUCTION

    • 1.1. Report description

    • 1.2. Key market segments

    • 1.3. Key benefits to the stakeholders

    • 1.4. Research Methodology

      • 1.4.1. Primary research

      • 1.4.2. Secondary research

      • 1.4.3. Analyst tools and models

  • CHAPTER 2: EXECUTIVE SUMMARY

    • 2.1. CXO Perspective

  • CHAPTER 3: MARKET OVERVIEW

    • 3.1. Market definition and scope

    • 3.2. Key findings

      • 3.2.1. Top impacting factors

      • 3.2.2. Top investment pockets

    • 3.3. Porter’s five forces analysis

      • 3.3.1. Low bargaining power of suppliers

      • 3.3.2. Low threat of new entrants

      • 3.3.3. Low threat of substitutes

      • 3.3.4. Low intensity of rivalry

      • 3.3.5. Low bargaining power of buyers

    • 3.4. Market dynamics

      • 3.4.1. Drivers

        • 3.4.1.1. Rise in construction & infrastructure industry
        • 3.4.1.2. Growth in focus on public-private partnerships (PPP)
        • 3.4.1.3. Technological advancements in construction machinery

      • 3.4.2. Restraints

        • 3.4.2.1. High initial investments
        • 3.4.2.2. Strict government regulations in construction industry

      • 3.4.3. Opportunities

        • 3.4.3.1. Rise in efforts toward sustainability

    • 3.5. COVID-19 Impact Analysis on the market

  • CHAPTER 4: CONSTRUCTION AGGREGATES MARKET, BY TYPE

    • 4.1. Overview

      • 4.1.1. Market size and forecast

    • 4.2. Crushed Stone

      • 4.2.1. Key market trends, growth factors and opportunities

      • 4.2.2. Market size and forecast, by region

      • 4.2.3. Market share analysis by country

    • 4.3. Sand and Gravel

      • 4.3.1. Key market trends, growth factors and opportunities

      • 4.3.2. Market size and forecast, by region

      • 4.3.3. Market share analysis by country

  • CHAPTER 5: CONSTRUCTION AGGREGATES MARKET, BY APPLICATION

    • 5.1. Overview

      • 5.1.1. Market size and forecast

    • 5.2. Non-Residential

      • 5.2.1. Key market trends, growth factors and opportunities

      • 5.2.2. Market size and forecast, by region

      • 5.2.3. Market share analysis by country

    • 5.3. Residential

      • 5.3.1. Key market trends, growth factors and opportunities

      • 5.3.2. Market size and forecast, by region

      • 5.3.3. Market share analysis by country

  • CHAPTER 6: CONSTRUCTION AGGREGATES MARKET, BY TRANSPORTATION MODE

    • 6.1. Overview

      • 6.1.1. Market size and forecast

    • 6.2. Truck

      • 6.2.1. Key market trends, growth factors and opportunities

      • 6.2.2. Market size and forecast, by region

      • 6.2.3. Market share analysis by country

    • 6.3. Train

      • 6.3.1. Key market trends, growth factors and opportunities

      • 6.3.2. Market size and forecast, by region

      • 6.3.3. Market share analysis by country

    • 6.4. Ship

      • 6.4.1. Key market trends, growth factors and opportunities

      • 6.4.2. Market size and forecast, by region

      • 6.4.3. Market share analysis by country

  • CHAPTER 7: CONSTRUCTION AGGREGATES MARKET, BY REGION

    • 7.1. Overview

      • 7.1.1. Market size and forecast By Region

    • 7.2. North America

      • 7.2.1. Key market trends, growth factors and opportunities

      • 7.2.2. Market size and forecast, by Type

      • 7.2.3. Market size and forecast, by Application

      • 7.2.4. Market size and forecast, by Transportation Mode

      • 7.2.5. Market size and forecast, by country

        • 7.2.5.1. U.S.
          • 7.2.5.1.1. Market size and forecast, by Type
          • 7.2.5.1.2. Market size and forecast, by Application
          • 7.2.5.1.3. Market size and forecast, by Transportation Mode
        • 7.2.5.2. Canada
          • 7.2.5.2.1. Market size and forecast, by Type
          • 7.2.5.2.2. Market size and forecast, by Application
          • 7.2.5.2.3. Market size and forecast, by Transportation Mode
        • 7.2.5.3. Mexico
          • 7.2.5.3.1. Market size and forecast, by Type
          • 7.2.5.3.2. Market size and forecast, by Application
          • 7.2.5.3.3. Market size and forecast, by Transportation Mode
    • 7.3. Europe

      • 7.3.1. Key market trends, growth factors and opportunities

      • 7.3.2. Market size and forecast, by Type

      • 7.3.3. Market size and forecast, by Application

      • 7.3.4. Market size and forecast, by Transportation Mode

      • 7.3.5. Market size and forecast, by country

        • 7.3.5.1. Germany
          • 7.3.5.1.1. Market size and forecast, by Type
          • 7.3.5.1.2. Market size and forecast, by Application
          • 7.3.5.1.3. Market size and forecast, by Transportation Mode
        • 7.3.5.2. UK
          • 7.3.5.2.1. Market size and forecast, by Type
          • 7.3.5.2.2. Market size and forecast, by Application
          • 7.3.5.2.3. Market size and forecast, by Transportation Mode
        • 7.3.5.3. France
          • 7.3.5.3.1. Market size and forecast, by Type
          • 7.3.5.3.2. Market size and forecast, by Application
          • 7.3.5.3.3. Market size and forecast, by Transportation Mode
        • 7.3.5.4. Italy
          • 7.3.5.4.1. Market size and forecast, by Type
          • 7.3.5.4.2. Market size and forecast, by Application
          • 7.3.5.4.3. Market size and forecast, by Transportation Mode
        • 7.3.5.5. Rest of Europe
          • 7.3.5.5.1. Market size and forecast, by Type
          • 7.3.5.5.2. Market size and forecast, by Application
          • 7.3.5.5.3. Market size and forecast, by Transportation Mode
    • 7.4. Asia-Pacific

      • 7.4.1. Key market trends, growth factors and opportunities

      • 7.4.2. Market size and forecast, by Type

      • 7.4.3. Market size and forecast, by Application

      • 7.4.4. Market size and forecast, by Transportation Mode

      • 7.4.5. Market size and forecast, by country

        • 7.4.5.1. China
          • 7.4.5.1.1. Market size and forecast, by Type
          • 7.4.5.1.2. Market size and forecast, by Application
          • 7.4.5.1.3. Market size and forecast, by Transportation Mode
        • 7.4.5.2. Japan
          • 7.4.5.2.1. Market size and forecast, by Type
          • 7.4.5.2.2. Market size and forecast, by Application
          • 7.4.5.2.3. Market size and forecast, by Transportation Mode
        • 7.4.5.3. South Korea
          • 7.4.5.3.1. Market size and forecast, by Type
          • 7.4.5.3.2. Market size and forecast, by Application
          • 7.4.5.3.3. Market size and forecast, by Transportation Mode
        • 7.4.5.4. India
          • 7.4.5.4.1. Market size and forecast, by Type
          • 7.4.5.4.2. Market size and forecast, by Application
          • 7.4.5.4.3. Market size and forecast, by Transportation Mode
        • 7.4.5.5. Rest of Asia-Pacific
          • 7.4.5.5.1. Market size and forecast, by Type
          • 7.4.5.5.2. Market size and forecast, by Application
          • 7.4.5.5.3. Market size and forecast, by Transportation Mode
    • 7.5. LAMEA

      • 7.5.1. Key market trends, growth factors and opportunities

      • 7.5.2. Market size and forecast, by Type

      • 7.5.3. Market size and forecast, by Application

      • 7.5.4. Market size and forecast, by Transportation Mode

      • 7.5.5. Market size and forecast, by country

        • 7.5.5.1. Latin America
          • 7.5.5.1.1. Market size and forecast, by Type
          • 7.5.5.1.2. Market size and forecast, by Application
          • 7.5.5.1.3. Market size and forecast, by Transportation Mode
        • 7.5.5.2. Middle East
          • 7.5.5.2.1. Market size and forecast, by Type
          • 7.5.5.2.2. Market size and forecast, by Application
          • 7.5.5.2.3. Market size and forecast, by Transportation Mode
        • 7.5.5.3. Africa
          • 7.5.5.3.1. Market size and forecast, by Type
          • 7.5.5.3.2. Market size and forecast, by Application
          • 7.5.5.3.3. Market size and forecast, by Transportation Mode
  • CHAPTER 8: COMPETITIVE LANDSCAPE

    • 8.1. Introduction

    • 8.2. Top winning strategies

    • 8.3. Product Mapping of Top 10 Player

    • 8.4. Competitive Dashboard

    • 8.5. Competitive Heatmap

    • 8.6. Top player positioning, 2021

  • CHAPTER 9: COMPANY PROFILES

    • 9.1. Holcim Ltd.

      • 9.1.1. Company overview

      • 9.1.2. Key Executives

      • 9.1.3. Company snapshot

      • 9.1.4. Operating business segments

      • 9.1.5. Product portfolio

      • 9.1.6. Business performance

      • 9.1.7. Key strategic moves and developments

    • 9.2. Vicat SA

      • 9.2.1. Company overview

      • 9.2.2. Key Executives

      • 9.2.3. Company snapshot

      • 9.2.4. Operating business segments

      • 9.2.5. Product portfolio

      • 9.2.6. Business performance

    • 9.3. Adelaide Brighton Ltd.

      • 9.3.1. Company overview

      • 9.3.2. Key Executives

      • 9.3.3. Company snapshot

      • 9.3.4. Operating business segments

      • 9.3.5. Product portfolio

      • 9.3.6. Business performance

    • 9.4. Rogers Group Inc.

      • 9.4.1. Company overview

      • 9.4.2. Key Executives

      • 9.4.3. Company snapshot

      • 9.4.4. Operating business segments

      • 9.4.5. Product portfolio

    • 9.5. CEMEX S.A.B. de C.V.

      • 9.5.1. Company overview

      • 9.5.2. Key Executives

      • 9.5.3. Company snapshot

      • 9.5.4. Operating business segments

      • 9.5.5. Product portfolio

      • 9.5.6. Business performance

      • 9.5.7. Key strategic moves and developments

    • 9.6. HeidelbergCement AG

      • 9.6.1. Company overview

      • 9.6.2. Key Executives

      • 9.6.3. Company snapshot

      • 9.6.4. Operating business segments

      • 9.6.5. Product portfolio

      • 9.6.6. Business performance

    • 9.7. Sika AG

      • 9.7.1. Company overview

      • 9.7.2. Key Executives

      • 9.7.3. Company snapshot

      • 9.7.4. Operating business segments

      • 9.7.5. Product portfolio

      • 9.7.6. Business performance

    • 9.8. Martin Marietta Materials Inc.

      • 9.8.1. Company overview

      • 9.8.2. Key Executives

      • 9.8.3. Company snapshot

      • 9.8.4. Operating business segments

      • 9.8.5. Product portfolio

      • 9.8.6. Business performance

      • 9.8.7. Key strategic moves and developments

    • 9.9. Vulcan Materials Company

      • 9.9.1. Company overview

      • 9.9.2. Key Executives

      • 9.9.3. Company snapshot

      • 9.9.4. Operating business segments

      • 9.9.5. Product portfolio

      • 9.9.6. Business performance

    • 9.10. CRH

      • 9.10.1. Company overview

      • 9.10.2. Key Executives

      • 9.10.3. Company snapshot

      • 9.10.4. Operating business segments

      • 9.10.5. Product portfolio

      • 9.10.6. Business performance

  • LIST OF TABLES

  • TABLE 01. GLOBAL CONSTRUCTION AGGREGATES MARKET, BY TYPE, 2021-2032 ($MILLION)
    TABLE 02. CONSTRUCTION AGGREGATES MARKET FOR CRUSHED STONE, BY REGION, 2021-2032 ($MILLION)
    TABLE 03. CONSTRUCTION AGGREGATES MARKET FOR SAND AND GRAVEL, BY REGION, 2021-2032 ($MILLION)
    TABLE 04. GLOBAL CONSTRUCTION AGGREGATES MARKET, BY APPLICATION, 2021-2032 ($MILLION)
    TABLE 05. CONSTRUCTION AGGREGATES MARKET FOR NON-RESIDENTIAL, BY REGION, 2021-2032 ($MILLION)
    TABLE 06. CONSTRUCTION AGGREGATES MARKET FOR RESIDENTIAL, BY REGION, 2021-2032 ($MILLION)
    TABLE 07. GLOBAL CONSTRUCTION AGGREGATES MARKET, BY TRANSPORTATION MODE, 2021-2032 ($MILLION)
    TABLE 08. CONSTRUCTION AGGREGATES MARKET FOR TRUCK, BY REGION, 2021-2032 ($MILLION)
    TABLE 09. CONSTRUCTION AGGREGATES MARKET FOR TRAIN, BY REGION, 2021-2032 ($MILLION)
    TABLE 10. CONSTRUCTION AGGREGATES MARKET FOR SHIP, BY REGION, 2021-2032 ($MILLION)
    TABLE 11. CONSTRUCTION AGGREGATES MARKET, BY REGION, 2021-2032 ($MILLION)
    TABLE 12. NORTH AMERICA CONSTRUCTION AGGREGATES MARKET, BY TYPE, 2021-2032 ($MILLION)
    TABLE 13. NORTH AMERICA CONSTRUCTION AGGREGATES MARKET, BY APPLICATION, 2021-2032 ($MILLION)
    TABLE 14. NORTH AMERICA CONSTRUCTION AGGREGATES MARKET, BY TRANSPORTATION MODE, 2021-2032 ($MILLION)
    TABLE 15. NORTH AMERICA CONSTRUCTION AGGREGATES MARKET, BY COUNTRY, 2021-2032 ($MILLION)
    TABLE 16. U.S. CONSTRUCTION AGGREGATES MARKET, BY TYPE, 2021-2032 ($MILLION)
    TABLE 17. U.S. CONSTRUCTION AGGREGATES MARKET, BY APPLICATION, 2021-2032 ($MILLION)
    TABLE 18. U.S. CONSTRUCTION AGGREGATES MARKET, BY TRANSPORTATION MODE, 2021-2032 ($MILLION)
    TABLE 19. CANADA CONSTRUCTION AGGREGATES MARKET, BY TYPE, 2021-2032 ($MILLION)
    TABLE 20. CANADA CONSTRUCTION AGGREGATES MARKET, BY APPLICATION, 2021-2032 ($MILLION)
    TABLE 21. CANADA CONSTRUCTION AGGREGATES MARKET, BY TRANSPORTATION MODE, 2021-2032 ($MILLION)
    TABLE 22. MEXICO CONSTRUCTION AGGREGATES MARKET, BY TYPE, 2021-2032 ($MILLION)
    TABLE 23. MEXICO CONSTRUCTION AGGREGATES MARKET, BY APPLICATION, 2021-2032 ($MILLION)
    TABLE 24. MEXICO CONSTRUCTION AGGREGATES MARKET, BY TRANSPORTATION MODE, 2021-2032 ($MILLION)
    TABLE 25. EUROPE CONSTRUCTION AGGREGATES MARKET, BY TYPE, 2021-2032 ($MILLION)
    TABLE 26. EUROPE CONSTRUCTION AGGREGATES MARKET, BY APPLICATION, 2021-2032 ($MILLION)
    TABLE 27. EUROPE CONSTRUCTION AGGREGATES MARKET, BY TRANSPORTATION MODE, 2021-2032 ($MILLION)
    TABLE 28. EUROPE CONSTRUCTION AGGREGATES MARKET, BY COUNTRY, 2021-2032 ($MILLION)
    TABLE 29. GERMANY CONSTRUCTION AGGREGATES MARKET, BY TYPE, 2021-2032 ($MILLION)
    TABLE 30. GERMANY CONSTRUCTION AGGREGATES MARKET, BY APPLICATION, 2021-2032 ($MILLION)
    TABLE 31. GERMANY CONSTRUCTION AGGREGATES MARKET, BY TRANSPORTATION MODE, 2021-2032 ($MILLION)
    TABLE 32. UK CONSTRUCTION AGGREGATES MARKET, BY TYPE, 2021-2032 ($MILLION)
    TABLE 33. UK CONSTRUCTION AGGREGATES MARKET, BY APPLICATION, 2021-2032 ($MILLION)
    TABLE 34. UK CONSTRUCTION AGGREGATES MARKET, BY TRANSPORTATION MODE, 2021-2032 ($MILLION)
    TABLE 35. FRANCE CONSTRUCTION AGGREGATES MARKET, BY TYPE, 2021-2032 ($MILLION)
    TABLE 36. FRANCE CONSTRUCTION AGGREGATES MARKET, BY APPLICATION, 2021-2032 ($MILLION)
    TABLE 37. FRANCE CONSTRUCTION AGGREGATES MARKET, BY TRANSPORTATION MODE, 2021-2032 ($MILLION)
    TABLE 38. ITALY CONSTRUCTION AGGREGATES MARKET, BY TYPE, 2021-2032 ($MILLION)
    TABLE 39. ITALY CONSTRUCTION AGGREGATES MARKET, BY APPLICATION, 2021-2032 ($MILLION)
    TABLE 40. ITALY CONSTRUCTION AGGREGATES MARKET, BY TRANSPORTATION MODE, 2021-2032 ($MILLION)
    TABLE 41. REST OF EUROPE CONSTRUCTION AGGREGATES MARKET, BY TYPE, 2021-2032 ($MILLION)
    TABLE 42. REST OF EUROPE CONSTRUCTION AGGREGATES MARKET, BY APPLICATION, 2021-2032 ($MILLION)
    TABLE 43. REST OF EUROPE CONSTRUCTION AGGREGATES MARKET, BY TRANSPORTATION MODE, 2021-2032 ($MILLION)
    TABLE 44. ASIA-PACIFIC CONSTRUCTION AGGREGATES MARKET, BY TYPE, 2021-2032 ($MILLION)
    TABLE 45. ASIA-PACIFIC CONSTRUCTION AGGREGATES MARKET, BY APPLICATION, 2021-2032 ($MILLION)
    TABLE 46. ASIA-PACIFIC CONSTRUCTION AGGREGATES MARKET, BY TRANSPORTATION MODE, 2021-2032 ($MILLION)
    TABLE 47. ASIA-PACIFIC CONSTRUCTION AGGREGATES MARKET, BY COUNTRY, 2021-2032 ($MILLION)
    TABLE 48. CHINA CONSTRUCTION AGGREGATES MARKET, BY TYPE, 2021-2032 ($MILLION)
    TABLE 49. CHINA CONSTRUCTION AGGREGATES MARKET, BY APPLICATION, 2021-2032 ($MILLION)
    TABLE 50. CHINA CONSTRUCTION AGGREGATES MARKET, BY TRANSPORTATION MODE, 2021-2032 ($MILLION)
    TABLE 51. JAPAN CONSTRUCTION AGGREGATES MARKET, BY TYPE, 2021-2032 ($MILLION)
    TABLE 52. JAPAN CONSTRUCTION AGGREGATES MARKET, BY APPLICATION, 2021-2032 ($MILLION)
    TABLE 53. JAPAN CONSTRUCTION AGGREGATES MARKET, BY TRANSPORTATION MODE, 2021-2032 ($MILLION)
    TABLE 54. SOUTH KOREA CONSTRUCTION AGGREGATES MARKET, BY TYPE, 2021-2032 ($MILLION)
    TABLE 55. SOUTH KOREA CONSTRUCTION AGGREGATES MARKET, BY APPLICATION, 2021-2032 ($MILLION)
    TABLE 56. SOUTH KOREA CONSTRUCTION AGGREGATES MARKET, BY TRANSPORTATION MODE, 2021-2032 ($MILLION)
    TABLE 57. INDIA CONSTRUCTION AGGREGATES MARKET, BY TYPE, 2021-2032 ($MILLION)
    TABLE 58. INDIA CONSTRUCTION AGGREGATES MARKET, BY APPLICATION, 2021-2032 ($MILLION)
    TABLE 59. INDIA CONSTRUCTION AGGREGATES MARKET, BY TRANSPORTATION MODE, 2021-2032 ($MILLION)
    TABLE 60. REST OF ASIA-PACIFIC CONSTRUCTION AGGREGATES MARKET, BY TYPE, 2021-2032 ($MILLION)
    TABLE 61. REST OF ASIA-PACIFIC CONSTRUCTION AGGREGATES MARKET, BY APPLICATION, 2021-2032 ($MILLION)
    TABLE 62. REST OF ASIA-PACIFIC CONSTRUCTION AGGREGATES MARKET, BY TRANSPORTATION MODE, 2021-2032 ($MILLION)
    TABLE 63. LAMEA CONSTRUCTION AGGREGATES MARKET, BY TYPE, 2021-2032 ($MILLION)
    TABLE 64. LAMEA CONSTRUCTION AGGREGATES MARKET, BY APPLICATION, 2021-2032 ($MILLION)
    TABLE 65. LAMEA CONSTRUCTION AGGREGATES MARKET, BY TRANSPORTATION MODE, 2021-2032 ($MILLION)
    TABLE 66. LAMEA CONSTRUCTION AGGREGATES MARKET, BY COUNTRY, 2021-2032 ($MILLION)
    TABLE 67. LATIN AMERICA CONSTRUCTION AGGREGATES MARKET, BY TYPE, 2021-2032 ($MILLION)
    TABLE 68. LATIN AMERICA CONSTRUCTION AGGREGATES MARKET, BY APPLICATION, 2021-2032 ($MILLION)
    TABLE 69. LATIN AMERICA CONSTRUCTION AGGREGATES MARKET, BY TRANSPORTATION MODE, 2021-2032 ($MILLION)
    TABLE 70. MIDDLE EAST CONSTRUCTION AGGREGATES MARKET, BY TYPE, 2021-2032 ($MILLION)
    TABLE 71. MIDDLE EAST CONSTRUCTION AGGREGATES MARKET, BY APPLICATION, 2021-2032 ($MILLION)
    TABLE 72. MIDDLE EAST CONSTRUCTION AGGREGATES MARKET, BY TRANSPORTATION MODE, 2021-2032 ($MILLION)
    TABLE 73. AFRICA CONSTRUCTION AGGREGATES MARKET, BY TYPE, 2021-2032 ($MILLION)
    TABLE 74. AFRICA CONSTRUCTION AGGREGATES MARKET, BY APPLICATION, 2021-2032 ($MILLION)
    TABLE 75. AFRICA CONSTRUCTION AGGREGATES MARKET, BY TRANSPORTATION MODE, 2021-2032 ($MILLION)
    TABLE 76. HOLCIM LTD.: KEY EXECUTIVES
    TABLE 77. HOLCIM LTD.: COMPANY SNAPSHOT
    TABLE 78. HOLCIM LTD.: PRODUCT SEGMENTS
    TABLE 79. HOLCIM LTD.: PRODUCT PORTFOLIO
    TABLE 80. HOLCIM LTD.: KEY STRATERGIES
    TABLE 81. VICAT SA: KEY EXECUTIVES
    TABLE 82. VICAT SA: COMPANY SNAPSHOT
    TABLE 83. VICAT SA: PRODUCT SEGMENTS
    TABLE 84. VICAT SA: PRODUCT PORTFOLIO
    TABLE 85. ADELAIDE BRIGHTON LTD.: KEY EXECUTIVES
    TABLE 86. ADELAIDE BRIGHTON LTD.: COMPANY SNAPSHOT
    TABLE 87. ADELAIDE BRIGHTON LTD.: PRODUCT SEGMENTS
    TABLE 88. ADELAIDE BRIGHTON LTD.: PRODUCT PORTFOLIO
    TABLE 89. ROGERS GROUP INC.: KEY EXECUTIVES
    TABLE 90. ROGERS GROUP INC.: COMPANY SNAPSHOT
    TABLE 91. ROGERS GROUP INC.: PRODUCT SEGMENTS
    TABLE 92. ROGERS GROUP INC.: PRODUCT PORTFOLIO
    TABLE 93. CEMEX S.A.B. DE C.V.: KEY EXECUTIVES
    TABLE 94. CEMEX S.A.B. DE C.V.: COMPANY SNAPSHOT
    TABLE 95. CEMEX S.A.B. DE C.V.: PRODUCT SEGMENTS
    TABLE 96. CEMEX S.A.B. DE C.V.: PRODUCT PORTFOLIO
    TABLE 97. CEMEX S.A.B. DE C.V.: KEY STRATERGIES
    TABLE 98. HEIDELBERGCEMENT AG: KEY EXECUTIVES
    TABLE 99. HEIDELBERGCEMENT AG: COMPANY SNAPSHOT
    TABLE 100. HEIDELBERGCEMENT AG: PRODUCT SEGMENTS
    TABLE 101. HEIDELBERGCEMENT AG: PRODUCT PORTFOLIO
    TABLE 102. SIKA AG: KEY EXECUTIVES
    TABLE 103. SIKA AG: COMPANY SNAPSHOT
    TABLE 104. SIKA AG: PRODUCT SEGMENTS
    TABLE 105. SIKA AG: PRODUCT PORTFOLIO
    TABLE 106. MARTIN MARIETTA MATERIALS INC.: KEY EXECUTIVES
    TABLE 107. MARTIN MARIETTA MATERIALS INC.: COMPANY SNAPSHOT
    TABLE 108. MARTIN MARIETTA MATERIALS INC.: PRODUCT SEGMENTS
    TABLE 109. MARTIN MARIETTA MATERIALS INC.: PRODUCT PORTFOLIO
    TABLE 110. MARTIN MARIETTA MATERIALS INC.: KEY STRATERGIES
    TABLE 111. VULCAN MATERIALS COMPANY: KEY EXECUTIVES
    TABLE 112. VULCAN MATERIALS COMPANY: COMPANY SNAPSHOT
    TABLE 113. VULCAN MATERIALS COMPANY: SERVICE SEGMENTS
    TABLE 114. VULCAN MATERIALS COMPANY: PRODUCT PORTFOLIO
    TABLE 115. CRH: KEY EXECUTIVES
    TABLE 116. CRH: COMPANY SNAPSHOT
    TABLE 117. CRH: PRODUCT SEGMENTS
    TABLE 118. CRH: PRODUCT PORTFOLIO
  • LIST OF FIGURES

  • FIGURE 01. CONSTRUCTION AGGREGATES MARKET, 2021-2032
    FIGURE 02. SEGMENTATION OF CONSTRUCTION AGGREGATES MARKET,2021-2032
    FIGURE 03. TOP INVESTMENT POCKETS IN CONSTRUCTION AGGREGATES MARKET (2023-2032)
    FIGURE 04. LOW BARGAINING POWER OF SUPPLIERS
    FIGURE 05. LOW THREAT OF NEW ENTRANTS
    FIGURE 06. LOW THREAT OF SUBSTITUTES
    FIGURE 07. LOW INTENSITY OF RIVALRY
    FIGURE 08. LOW BARGAINING POWER OF BUYERS
    FIGURE 09. GLOBAL CONSTRUCTION AGGREGATES MARKET:DRIVERS, RESTRAINTS AND OPPORTUNITIES
    FIGURE 10. CONSTRUCTION AGGREGATES MARKET, BY TYPE, 2021(%)
    FIGURE 11. COMPARATIVE SHARE ANALYSIS OF CONSTRUCTION AGGREGATES MARKET FOR CRUSHED STONE, BY COUNTRY 2021 AND 2032(%)
    FIGURE 12. COMPARATIVE SHARE ANALYSIS OF CONSTRUCTION AGGREGATES MARKET FOR SAND AND GRAVEL, BY COUNTRY 2021 AND 2032(%)
    FIGURE 13. CONSTRUCTION AGGREGATES MARKET, BY APPLICATION, 2021(%)
    FIGURE 14. COMPARATIVE SHARE ANALYSIS OF CONSTRUCTION AGGREGATES MARKET FOR NON-RESIDENTIAL, BY COUNTRY 2021 AND 2032(%)
    FIGURE 15. COMPARATIVE SHARE ANALYSIS OF CONSTRUCTION AGGREGATES MARKET FOR RESIDENTIAL, BY COUNTRY 2021 AND 2032(%)
    FIGURE 16. CONSTRUCTION AGGREGATES MARKET, BY TRANSPORTATION MODE, 2021(%)
    FIGURE 17. COMPARATIVE SHARE ANALYSIS OF CONSTRUCTION AGGREGATES MARKET FOR TRUCK, BY COUNTRY 2021 AND 2032(%)
    FIGURE 18. COMPARATIVE SHARE ANALYSIS OF CONSTRUCTION AGGREGATES MARKET FOR TRAIN, BY COUNTRY 2021 AND 2032(%)
    FIGURE 19. COMPARATIVE SHARE ANALYSIS OF CONSTRUCTION AGGREGATES MARKET FOR SHIP, BY COUNTRY 2021 AND 2032(%)
    FIGURE 20. CONSTRUCTION AGGREGATES MARKET BY REGION, 2021(%)
    FIGURE 21. U.S. CONSTRUCTION AGGREGATES MARKET, 2021-2032 ($MILLION)
    FIGURE 22. CANADA CONSTRUCTION AGGREGATES MARKET, 2021-2032 ($MILLION)
    FIGURE 23. MEXICO CONSTRUCTION AGGREGATES MARKET, 2021-2032 ($MILLION)
    FIGURE 24. GERMANY CONSTRUCTION AGGREGATES MARKET, 2021-2032 ($MILLION)
    FIGURE 25. UK CONSTRUCTION AGGREGATES MARKET, 2021-2032 ($MILLION)
    FIGURE 26. FRANCE CONSTRUCTION AGGREGATES MARKET, 2021-2032 ($MILLION)
    FIGURE 27. ITALY CONSTRUCTION AGGREGATES MARKET, 2021-2032 ($MILLION)
    FIGURE 28. REST OF EUROPE CONSTRUCTION AGGREGATES MARKET, 2021-2032 ($MILLION)
    FIGURE 29. CHINA CONSTRUCTION AGGREGATES MARKET, 2021-2032 ($MILLION)
    FIGURE 30. JAPAN CONSTRUCTION AGGREGATES MARKET, 2021-2032 ($MILLION)
    FIGURE 31. SOUTH KOREA CONSTRUCTION AGGREGATES MARKET, 2021-2032 ($MILLION)
    FIGURE 32. INDIA CONSTRUCTION AGGREGATES MARKET, 2021-2032 ($MILLION)
    FIGURE 33. REST OF ASIA-PACIFIC CONSTRUCTION AGGREGATES MARKET, 2021-2032 ($MILLION)
    FIGURE 34. LATIN AMERICA CONSTRUCTION AGGREGATES MARKET, 2021-2032 ($MILLION)
    FIGURE 35. MIDDLE EAST CONSTRUCTION AGGREGATES MARKET, 2021-2032 ($MILLION)
    FIGURE 36. AFRICA CONSTRUCTION AGGREGATES MARKET, 2021-2032 ($MILLION)
    FIGURE 37. TOP WINNING STRATEGIES, BY YEAR (2021-2023)
    FIGURE 38. TOP WINNING STRATEGIES, BY DEVELOPMENT (2021-2023)
    FIGURE 39. TOP WINNING STRATEGIES, BY COMPANY (2021-2023)
    FIGURE 40. PRODUCT MAPPING OF TOP 10 PLAYERS
    FIGURE 41. COMPETITIVE DASHBOARD
    FIGURE 42. COMPETITIVE HEATMAP: CONSTRUCTION AGGREGATES MARKET
    FIGURE 43. TOP PLAYER POSITIONING, 2021
    FIGURE 44. HOLCIM LTD.: NET REVENUE, 2020-2022 ($MILLION)
    FIGURE 45. HOLCIM LTD.: REVENUE SHARE BY SEGMENT, 2022 (%)
    FIGURE 46. HOLCIM LTD.: REVENUE SHARE BY REGION, 2022 (%)
    FIGURE 47. VICAT SA: NET REVENUE, 2020-2022 ($MILLION)
    FIGURE 48. VICAT SA: REVENUE SHARE BY SEGMENT, 2022 (%)
    FIGURE 49. VICAT SA: REVENUE SHARE BY REGION, 2022 (%)
    FIGURE 50. ADELAIDE BRIGHTON LTD.: NET REVENUE, 2020-2022 ($MILLION)
    FIGURE 51. ADELAIDE BRIGHTON LTD.: REVENUE SHARE BY SEGMENT, 2022 (%)
    FIGURE 52. CEMEX S.A.B. DE C.V.: NET REVENUE, 2020-2022 ($MILLION)
    FIGURE 53. CEMEX S.A.B. DE C.V.: REVENUE SHARE BY SEGMENT, 2022 (%)
    FIGURE 54. CEMEX S.A.B. DE C.V.: REVENUE SHARE BY REGION, 2022 (%)
    FIGURE 55. HEIDELBERGCEMENT AG: NET SALES, 2020-2022 ($MILLION)
    FIGURE 56. HEIDELBERGCEMENT AG: RESEARCH & DEVELOPMENT EXPENDITURE, 2020-2022 ($MILLION)
    FIGURE 57. HEIDELBERGCEMENT AG: REVENUE SHARE BY SEGMENT, 2022 (%)
    FIGURE 58. HEIDELBERGCEMENT AG: REVENUE SHARE BY REGION, 2022 (%)
    FIGURE 59. SIKA AG: RESEARCH & DEVELOPMENT EXPENDITURE, 2020-2022 ($MILLION)
    FIGURE 60. SIKA AG: NET REVENUE, 2020-2022 ($MILLION)
    FIGURE 61. SIKA AG: REVENUE SHARE BY SEGMENT, 2022 (%)
    FIGURE 62. SIKA AG: REVENUE SHARE BY REGION, 2022 (%)
    FIGURE 63. MARTIN MARIETTA MATERIALS INC.: NET REVENUE, 2020-2022 ($MILLION)
    FIGURE 64. MARTIN MARIETTA MATERIALS INC.: REVENUE SHARE BY SEGMENT, 2022 (%)
    FIGURE 65. MARTIN MARIETTA MATERIALS INC.: REVENUE SHARE BY REGION, 2022 (%)
    FIGURE 66. VULCAN MATERIALS COMPANY: SALES REVENUE, 2020-2022 ($MILLION)
    FIGURE 67. VULCAN MATERIALS COMPANY: REVENUE SHARE BY SEGMENT, 2022 (%)
    FIGURE 68. CRH: NET REVENUE, 2020-2022 ($MILLION)
    FIGURE 69. CRH: REVENUE SHARE BY SEGMENT, 2022 (%)


PURCHASE OPTIONS

Call or Email us

U.S.-Canada Toll-free: +1-800-792-5285
Int'l : +1-503-894-6022
Europe : +44-845-528-1300
Email : help@alliedmarketresearch.com
 
FREQUENTLY ASKED QUESTIONS?

A. Key factors driving the growth of the construction aggregates market include a rise in the construction & infrastructure industry, growth in focus on public-private partnerships (PPP), and technological advancements in construction machinery.

A. The latest version of the global construction aggregates market report can be obtained on demand from the website.

A. The global construction aggregates market size was valued at $3,75,269.3 million in 2021.

A. The global construction aggregates market size is projected to reach $6,67,844.4 million by 2032, registering a CAGR of 5.2% from 2023 to 2032.

A. The forecast period considered for the global construction aggregates market is 2023 to 2032, wherein, 2022 is the base year, 2023 is the estimated year, and 2032 is the forecast year. In addition, 2021 is analysed as a historic year.

A. Asia-Pacific is the largest regional market for construction aggregates market.

A. Key companies profiled in the tire recycling market report include Adelaide Brighton Ltd., CEMEX S.A.B. de C.V., CRH plc, Heidelberg Cement AG, HOLCIM, Martin Marietta Materials Inc., ROGERS GROUP INC., SIKA Group, Vicat SA, and Vulcan Materials Company.

A. The report contains an exclusive company profile section, where leading companies in the market are profiled. These profiles typically cover company overview, geographical presence, market dominance (in terms of revenue and volume sales), various strategies, and recent developments.

Looking for Customization?

 Customization Request

Have a Question?

 Speak with Analyst

Any Confusion?

 Inquire Before Buying

Have a glance of the Report

  Request Sample
RELATED TAGS

Purchase Full Report of
Construction Aggregates Market

Start reading instantly.
This Report and over 68,131+ more Reports, Available with Avenue Library. T&C*.

  • Online Only
  • $3,570
  • Online cloud access only
  • Restricted print, copy, paste & download
  • Read only
  • Free industry update
    (Within 180 days)
  • Free report update in next update cycle
    (Aug 2024 - Aug 2025)
  • Data Pack
  • $3,840
  • Restricted to one authorized user
  • One print only
  • Available in
    Excel
  • Free industry update
    (Within 180 days)
  •   Free report update in next update cycle
    (Aug 2024 - Aug 2025)
  • Single User
  • $5,730
  • Restricted to one authorized user
  • One print only
  • Available in
    PDF
  • Free industry update
    (Within 180 days)
  •   Free report update in next update cycle
    (Aug 2024 - Aug 2025)
  • Five Users
  • $6,450
  • Limited to five authorized users
  • Print upto five copies
  • Available in
    PDF
  • Free industry update
    (Within 180 days)
  •   Free report update in next update cycle
    (Aug 2024 - Aug 2025)
  • Enterprise
    License/PDF

  • $9,600
  • Unlimited
    within
    company/enterprise
  • Available in Excel & PDF
  • Free industry update
    (Within 180 days)
  •   Free report update in next update cycle
    (Aug 2024 - Aug 2025)
  • Library
    Membership

  • $999 $ 1,175
    Per User/ Per month/ Billed annually
  • Published Content
    E-access
  • Company Profiles
    E-access
  • Newly Added Content Access
  • 10 PDF
    Downloads
  • 5 Excel Data
    Pack Downloads
  • 250 Company Profiles PDF Downloads
  • Buy Now

*Taxes/Fees, if applicable will be added during checkout. All prices in USD

RELATED REPORTS
 

Why Allied Market Research?


Infallible Methodology

To ensure high-level data integrity, accurate analysis, and impeccable forecasts

Analyst Support

For complete satisfaction

Customization

On-demand customization of scope of the report to exactly meet your needs

TARGETED MARKET VIEW

Targeted market view to provide pertinent information and save time of readers

Get fresh content delivered

Get insights on topics that are crucial for your business. Stay abreast of your interest areas.

Get Industry Data Alerts

Why Allied Market Research?

Infallible Methodology

To ensure high-level data integrity, accurate analysis, and impeccable forecasts

Analyst Support

For complete satisfaction

Customization

On-demand customization of scope of the report to exactly meet your needs

TARGETED MARKET VIEW

Targeted market view to provide pertinent information and save time of readers