0
New
New
2023
Consumer Electronics Repair And Maintenance Market

Consumer Electronics Repair And Maintenance Market

by Equipment Type (Mobiles, PC, Washing Machine, Refrigerator, Others), by End Users (Residential, Commercial), by Service Type (In-warranty, Out of Warranty): Global Opportunity Analysis and Industry Forecast, 2022-2031

Report Code: A16257
Apr 2023 | Pages: 360
Tables: 129
Charts: 50
  • Formats*:

  • pdf

    Single User License, Five User
    License & Enterprise User License

  • xls

    Data Pack Excel License

  • ppt

    It comes with the additional cost
    of $2500.00 contact sales.


Consumer Electronics Repair And Maintenance Market Research, 2031

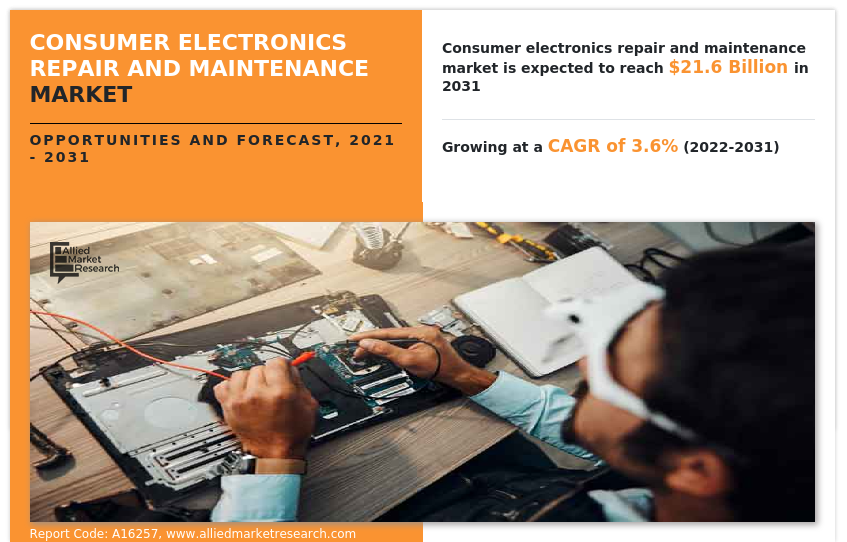
The global consumer electronics repair and maintenance market size was valued at $15.3 billion in 2021, and is projected to reach $21.6 billion by 2031, growing at a CAGR of 3.6% from 2022 to 2031.

Consumer electronics repair and maintenance is the process of repairing and replacing the physical components of electronic tools, gadgets, appliances, and devices that are used by end users for both professional and non-professional purposes. Along with selling used consumer goods, refurbished electronic product providers also work on televisions, stereos, speakers, video recorders, CD and DVD players, radios, and cameras.

The majority of organized service is found in industrialized nations, particularly the developed nations, which have a highly organized service sector.
Consumers prefer to have their items repaired at approved service facilities, thus their market worth is significantly higher in developed economies. Organized sector service providers are employed on an annual or biannual contract basis in malls and the food service sector. They have yearly agreements for the repair and upkeep of electronic devices such as air conditioners, chillers, refrigerators, computers, and washing machines. To offer repair and maintenance services, the global brands have partnered with foreign hotels, shopping centers, theatres, launderettes, and IT firms. The organized commercial services industry in India, where the bulk of IT companies are based, is very promising, giving market participants lucrative chances to broaden their service offerings and build up their clients. Thus, the presence of the organized sector will propel the global consumer electronics repair and maintenance market demand.

Consumer Electronics Repair And Maintenance Market

All electronic equipment has undergone a greater digitalization or metamorphosis during the past few years. Hence, the availability of equipment with AI-driven smart features has increased as a result of increased digitalization. With the market's selection of smart gadgets, repair and maintenance are required. Digitalization is also required in the consumer electronics repair and maintenance industry, which includes the release of digitalized kitchen appliances, AI-powered technology, touchscreen computers, and washing machines. The digitization of most consumer goods has grown exponentially in recent years, which has led to a phenomenon known as the consumerization of information technology. Consumer electronics and IT may soon have even closer ties due to the Internet of Things (IoT), which is bringing a large number of connected devices to the market. Electronic devices now are more technologically advanced than they were fifty years ago, and they are also more readily available, more diverse, and more reasonably priced. The requirement for upkeep and repair consequently grows. To meet this need, market participants are enlarging their service locations in developing nations. The market is already established in industrialized nations.

Moreover, predictive maintenance refers to a process for estimating when to repair and maintain any electrical equipment utilizing logic, technique, experience, and the equipment's lifespan. For years, both commercial and residential end users have had their equipment repaired using manual maintenance approaches. With the use of cutting-edge technology called predictive maintenance, technicians can now optimize their work in real time, extending the equipment's life and minimizing downtime. Inadequate maintenance practices can lower the efficiency of any device by 5% to 20%. To address these issues, predictive maintenance is necessary, and new approaches are being used by business end users to access this technology for their electronic equipment. To determine the current timetable, predictive maintenance systems use a variety of inputs. Predicting the maintenance of electronic equipment can be done using sources such as vital equipment sensors, ERP systems, computerized maintenance management systems, and smart factory management systems. These strategies allow market participants to collaborate with industrial end users to offer annual, biannual, quarterly, and monthly maintenance and repair contracts for their electronic equipment. The global consumer electronics repair and maintenance market is growing because of this new technology.

Consumer electronics are increasingly becoming affordable or less costly, and because there are few infrastructures for fixing them and the costs are often considerable, customers are generally not inclined to repair them. Furthermore, technological, operational, and financial challenges limit the expansion of the repair industry. Moreover, electronic devices like computers and cell phones have some costly spare parts. Residential end consumers will rather purchase new products than repair or maintain their existing ones because replacing  electronic components is more expensive. The cost of a display screen is significantly higher for mobile phones. As a result, consumers limit their investment to screen repairs and instead opt to purchase new mobile devices, hence in turn, limiting market expansion. Replacing a laptop's motherboard costs almost as much as buying a new one, therefore, buyers rarely rely on repairs for computers. Instead of just repairing the laptop and using it for another two to three years, customers opt to purchase a new laptop that will last them an additional eight to ten years. As a result, the market's expansion is constrained by the high cost of replacement parts.

Impact of COVID-19 on consumer electronics repair and maintenance market –

The discretionary nature of consumer electronics repair and maintenance is making the global market some of the most adversely affected by the pandemic, especially in light of the combined effect of retail closures and frugality as a result of the rapidly deteriorating economic environment. The stoppage of activities due to the pandemic comes first, followed by the impact of lack of accessibility on sales of goods offered in the consumer electronics repair and maintenance industry. Since most markets are heading toward recession, the industries are imitating the situation of 2008 in anticipation of the recessionary consumer attitude and extremely frugal approach to consumer electronics that would certainly follow the pandemic.

Additionally, it is anticipated that demand for consumer electronics repairs and maintenance would continue to expand in the post-pandemic period. The market's active participants will use their creativity to develop new distribution channels for the consumer electronics repair and maintenance industry, which will attract customers and spur market expansion. Also, the expansion of the market will be facilitated by the rise in online penetration.

Additionally, it is anticipated that demand for consumer electronics repairs and maintenance would rise substantially in the next years due to the resumption of all economic operations in the post-pandemic period. Since active stakeholders are likely to introduce effective tactics, improved quality, and marketing plans to achieve growth in the consumer electronics repair and maintenance market, demand for consumer electronics repair and maintenance is also anticipated to rise. The consumer electronics repair and maintenance market will have plenty of room to grow as a result of these technological advancements as well as an improvement in the quality of consumer electronics peripherals and repairs in the post-pandemic period.

Segmental Overview

The consumer electronics repair and maintenance market is segmented into Equipment Type, End Users and Service Type. 

Based on equipment type, the market is categorized into mobile, PC, washing machine, refrigerator, and others. According to the end user, it is fragmented into residential and commercial. Based on service type, the market is categorized into in-warranty and out-of-warranty. Region-wise, the market is analyzed across North America (the U.S., Canada, and Mexico), Europe (Germany, France, UK, Italy, Spain, and the rest of Europe), Asia-Pacific (China, India, Japan, South Korea, Australia, and the rest of Asia-Pacific), and LAMEA (Brazil, South Africa, and the rest of LAMEA).
Consumer Electronics Repair And Maintenance Market

By Equipment Type

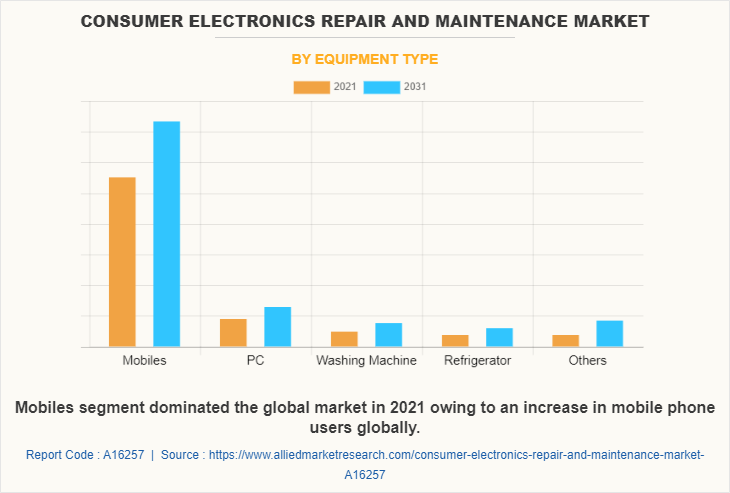
By equipment type, mobile garnered the highest consumer electronics repair and maintenance market share in 2021 with a CAGR of 2.95%. The fastest-growing nations in the globe are those in the developing world, such as Brazil and India. Due to the fact that these nations are developing, there is a growth in the number of mobile phone users in these nations. As more market players show an interest in making their phones available in these areas, there is an increase in the demand for service centers. Some of the key participants in the market include Motorola, Samsung, Apple, BlackBerry, and Microsoft. Some market participants run their own mobile phone repair shops. The mobile service sector is largely organized in developed markets, but there is also a parallel unorganized economy, and the bulk of customers there cannot afford the expensive accessories that are sold in the businesses' official service centers. These factors will collectively propel the consumer electronics repair and maintenance market demand.
Consumer Electronics Repair And Maintenance Market

By End User

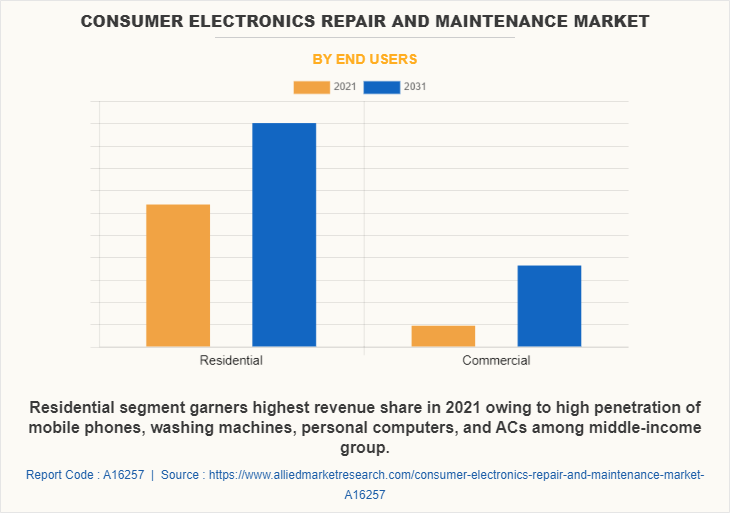
By end user, the residential segment was the highest revenue contributor i.e., $10,364.31 million in 2021, and is expected to reach $14,003.49 million by 2031 at a CAGR of 3.13%. Due to an improvement in the level of living, consumers tend to spend more money on appliances like washing machines and air conditioners. Service stations are now more necessary as a result. While there are many unorganized service providers in developed regions, approved service centers predominate in developed nations. Since their consumer bases are growing in these cities, many market participants have been extending their service centers in tier 2 and tier 3 cities. Additionally, the middle-income group is becoming increasingly reliant on mobile phones, washing machines, personal computers, and air conditioning, necessitating a strong need for service stations. Thus, the increasing middle-class population along with the increasing use of home appliances in emerging as well as developed countries will spur the consumer electronics repair and maintenance market growth.
Consumer Electronics Repair And Maintenance Market

By Service Type

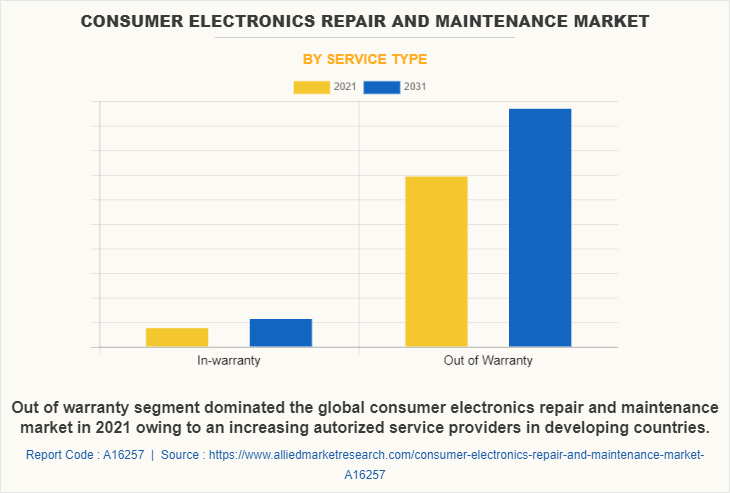
By service type, the out-of-warranty segment was the highest revenue contributor i.e., $13,819.01 million in 2021, and is expected to reach $19,359.96 million by 2031 at a CAGR of 3.5%. Consumer electronics are typically utilized for more than two years, although the warranties on items like mobile phones, laptops, and air conditioners are typically two to three years. Depending on the brand and the product type, a product's lifespan might range from one to ten years. Because of this, a product typically outlives its warranty and requires additional maintenance and repair work. Either approved service centers or unlicensed individual service providers offer these services. With the rising adoption of these items in smaller cities, there are many unorganized independent service providers in Brazil and India. Unorganized service providers offer services at low prices, therefore, they have a substantial market share in these nations. The organized sector dominates the market in the U.S. where most customers visit authorized service centers even after the product has passed its warranty period. In contrast, the unorganized sector dominates the markets in Brazil and India where small business owners offer services at lower prices. As a result, the marketplaces in Brazil and India present profitable chances for the established market players to offer services at lower prices in order to counter the rivalry from the local independent service providers.
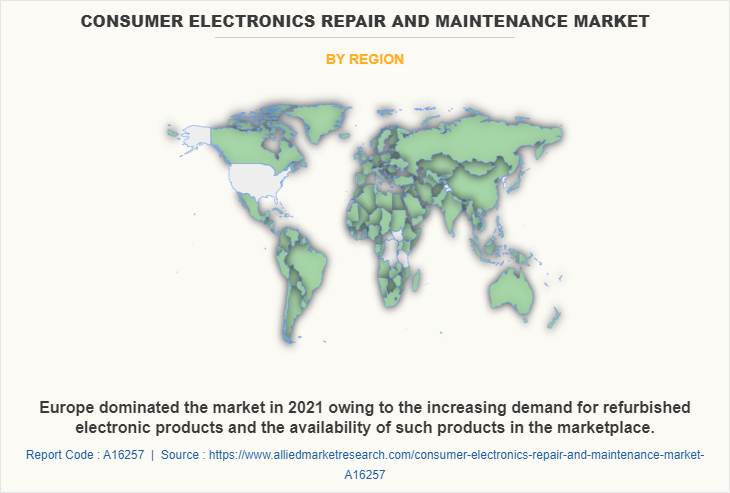
Consumer Electronics Repair And Maintenance Market

By Region

By region, Europe holds the largest share i.e., $5,085.63 million in 2021, and is expected to reach $6,332.7 million by 2031 at a CAGR of 2.28%. Also, the region is expected to dominate during the consumer electronics repair and maintenance market forecast period. The consumer electronics repair and maintenance market is anticipated to be driven by rising consumer spending on online or e-commerce for consumer electronic items including PCs, mobile phones, washing machines, and kitchen appliances, among others. In 2020, more than 280 million European customers are expected to buy online and spend more than $150 billion on consumer electronics, according to AMR study. Hence, the market for consumer electronics repair and maintenance will grow as a result of increased consumer spending on consumer electronics devices and the necessity for repair and maintenance to keep the products in working order. In addition, the market for consumer electronics repair and maintenance will be driven by the rising demand for reconditioned electronic items and the availability of such products in the marketplace. For instance, tasteful and updated refurbished gadgets are available on Refurbed, a European marketplace for used electronics. Back Market, Swappa, and Amazon Renew are more companies in the market for reconditioned gadgets.

The market is being driven by factors such as rapid growth in infrastructural development as well as various advancements in developing countries. The major players operating in the global consumer electronics repair and maintenance are Encompass Supply Chain Solutions, Inc., American Home Shield Corporation, Asurion, LLC, Ensure Services, Best Buy Co., Inc., iCracked Inc., B2X Care Solutions GmbH, Electronix Services, CNS Brasil Informatica LTDA, and UrbanClap Technologies Private limited.

Recent Key Developments in the market

  • In September 2022, Asurion, LLC opened its new electronics repair shop, Asurion Tech Repair & Solutions in the Eagan. This new store offers professional fixes for consumer electronics and numerous repair services.
  • In July 2022, Best Buy Co., Inc. announced to establish its first small-format, digital-first store in Monroe. This new store features a curated selection of best-in-category products along with the expert services.
  • In July 2022, Best Buy Co., Inc. expanded its Samsung authorized service and repair services in more than 250 Best Buy stores to offer its customers with a full suite of repair solutions for their Samsung smartphones.
  • In April 2022, Encompass Supply Chain Solutions, Inc. was acquired by Parts Town, LLC, which is a technology-enabled global distributor of genuine OEM parts in order to expand its portfolio and business. 

Key Benefits For Stakeholders

  • This report provides a quantitative analysis of the market segments, current trends, estimations, and dynamics of the consumer electronics repair and maintenance market analysis from 2021 to 2031 to identify the prevailing consumer electronics repair and maintenance market opportunities.
  • The market research is offered along with information related to key drivers, restraints, and opportunities.
  • Porter's five forces analysis highlights the potency of buyers and suppliers to enable stakeholders make profit-oriented business decisions and strengthen their supplier-buyer network.
  • In-depth analysis of the consumer electronics repair and maintenance market segmentation assists to determine the prevailing market opportunities.
  • Major countries in each region are mapped according to their revenue contribution to the global market.
  • Market player positioning facilitates benchmarking and provides a clear understanding of the present position of the market players.
  • The report includes the analysis of the regional as well as global consumer electronics repair and maintenance market trends, key players, market segments, application areas, and market growth strategies.

Consumer Electronics Repair And Maintenance Market Report Highlights

Aspects Details
Market Size By 2031 USD 21.6 billion
Growth Rate CAGR of 3.6%
Forecast period 2021 - 2031
Report Pages 360
By Equipment Type
  • Mobiles
  • PC
  • Washing Machine
    • Function
      • Semi-Automatic
      • Automatic
  • Refrigerator
  • Others
By End Users
  • Residential
  • Commercial
By Service Type
  • In-warranty
  • Out of Warranty
By Region
  • North America  (U.S., Canada, Mexico)
  • Europe  (Germany, France, UK, Italy, Spain, Rest of Europe)
  • Asia-Pacific  (China, Japan, India, South Korea, Australia, Rest of Asia-Pacific)
  • LAMEA  (Brazil, South Africa,, Rest of LAMEA)
Key Market Players Encompass Supply Chain Solutions, Inc., Electronix Services, Best Buy Co., Inc., Asurion, LLC, Ensure Services, iCracked Inc., UrbanClap Technologies Private limited, CNS Brasil Informatica LTDA, American Home Shield Corporation, B2X Care Solutions GmbH
 
  • CHAPTER 1: INTRODUCTION

    • 1.1. Report description

    • 1.2. Key market segments

    • 1.3. Key benefits to the stakeholders

    • 1.4. Research Methodology

      • 1.4.1. Primary research

      • 1.4.2. Secondary research

      • 1.4.3. Analyst tools and models

  • CHAPTER 2: EXECUTIVE SUMMARY

    • 2.1. CXO Perspective

  • CHAPTER 3: MARKET OVERVIEW

    • 3.1. Market definition and scope

    • 3.2. Key findings

      • 3.2.1. Top impacting factors

      • 3.2.2. Top investment pockets

    • 3.3. Porter’s five forces analysis

      • 3.3.1. Bargaining power of suppliers

      • 3.3.2. Bargaining power of buyers

      • 3.3.3. Threat of substitutes

      • 3.3.4. Threat of new entrants

      • 3.3.5. Intensity of rivalry

    • 3.4. Market dynamics

      • 3.4.1. Drivers

        • 3.4.1.1. Increase in digitization
        • 3.4.1.2. Rise in the use of consumer electronic goods
        • 3.4.1.3. Predictive maintenance

      • 3.4.2. Restraints

        • 3.4.2.1. Higher maintenance cost of some equipment for residential end users

      • 3.4.3. Opportunities

        • 3.4.3.1. Increase in growth of online aggregators
        • 3.4.3.2. Increase in social media advertisement and promotion

    • 3.5. COVID-19 Impact Analysis on the market

  • CHAPTER 4: CONSUMER ELECTRONICS REPAIR AND MAINTENANCE MARKET, BY EQUIPMENT TYPE

    • 4.1. Overview

      • 4.1.1. Market size and forecast

    • 4.2. Mobiles

      • 4.2.1. Key market trends, growth factors and opportunities

      • 4.2.2. Market size and forecast, by region

      • 4.2.3. Market share analysis by country

    • 4.3. PC

      • 4.3.1. Key market trends, growth factors and opportunities

      • 4.3.2. Market size and forecast, by region

      • 4.3.3. Market share analysis by country

    • 4.4. Washing Machine

      • 4.4.1. Key market trends, growth factors and opportunities

      • 4.4.2. Market size and forecast, by region

      • 4.4.3. Market share analysis by country

      • 4.4.4. Washing Machine Consumer Electronics Repair And Maintenance Market by Function

    • 4.5. Refrigerator

      • 4.5.1. Key market trends, growth factors and opportunities

      • 4.5.2. Market size and forecast, by region

      • 4.5.3. Market share analysis by country

    • 4.6. Others

      • 4.6.1. Key market trends, growth factors and opportunities

      • 4.6.2. Market size and forecast, by region

      • 4.6.3. Market share analysis by country

  • CHAPTER 5: CONSUMER ELECTRONICS REPAIR AND MAINTENANCE MARKET, BY END USERS

    • 5.1. Overview

      • 5.1.1. Market size and forecast

    • 5.2. Residential

      • 5.2.1. Key market trends, growth factors and opportunities

      • 5.2.2. Market size and forecast, by region

      • 5.2.3. Market share analysis by country

    • 5.3. Commercial

      • 5.3.1. Key market trends, growth factors and opportunities

      • 5.3.2. Market size and forecast, by region

      • 5.3.3. Market share analysis by country

  • CHAPTER 6: CONSUMER ELECTRONICS REPAIR AND MAINTENANCE MARKET, BY SERVICE TYPE

    • 6.1. Overview

      • 6.1.1. Market size and forecast

    • 6.2. In-warranty

      • 6.2.1. Key market trends, growth factors and opportunities

      • 6.2.2. Market size and forecast, by region

      • 6.2.3. Market share analysis by country

    • 6.3. Out of Warranty

      • 6.3.1. Key market trends, growth factors and opportunities

      • 6.3.2. Market size and forecast, by region

      • 6.3.3. Market share analysis by country

  • CHAPTER 7: CONSUMER ELECTRONICS REPAIR AND MAINTENANCE MARKET, BY REGION

    • 7.1. Overview

      • 7.1.1. Market size and forecast By Region

    • 7.2. North America

      • 7.2.1. Key trends and opportunities

      • 7.2.2. Market size and forecast, by Equipment Type

      • 7.2.3. Market size and forecast, by End Users

      • 7.2.4. Market size and forecast, by Service Type

      • 7.2.5. Market size and forecast, by country

        • 7.2.5.1. U.S.
          • 7.2.5.1.1. Key market trends, growth factors and opportunities
          • 7.2.5.1.2. Market size and forecast, by Equipment Type
          • 7.2.5.1.3. Market size and forecast, by End Users
          • 7.2.5.1.4. Market size and forecast, by Service Type
        • 7.2.5.2. Canada
          • 7.2.5.2.1. Key market trends, growth factors and opportunities
          • 7.2.5.2.2. Market size and forecast, by Equipment Type
          • 7.2.5.2.3. Market size and forecast, by End Users
          • 7.2.5.2.4. Market size and forecast, by Service Type
        • 7.2.5.3. Mexico
          • 7.2.5.3.1. Key market trends, growth factors and opportunities
          • 7.2.5.3.2. Market size and forecast, by Equipment Type
          • 7.2.5.3.3. Market size and forecast, by End Users
          • 7.2.5.3.4. Market size and forecast, by Service Type
    • 7.3. Europe

      • 7.3.1. Key trends and opportunities

      • 7.3.2. Market size and forecast, by Equipment Type

      • 7.3.3. Market size and forecast, by End Users

      • 7.3.4. Market size and forecast, by Service Type

      • 7.3.5. Market size and forecast, by country

        • 7.3.5.1. Germany
          • 7.3.5.1.1. Key market trends, growth factors and opportunities
          • 7.3.5.1.2. Market size and forecast, by Equipment Type
          • 7.3.5.1.3. Market size and forecast, by End Users
          • 7.3.5.1.4. Market size and forecast, by Service Type
        • 7.3.5.2. France
          • 7.3.5.2.1. Key market trends, growth factors and opportunities
          • 7.3.5.2.2. Market size and forecast, by Equipment Type
          • 7.3.5.2.3. Market size and forecast, by End Users
          • 7.3.5.2.4. Market size and forecast, by Service Type
        • 7.3.5.3. UK
          • 7.3.5.3.1. Key market trends, growth factors and opportunities
          • 7.3.5.3.2. Market size and forecast, by Equipment Type
          • 7.3.5.3.3. Market size and forecast, by End Users
          • 7.3.5.3.4. Market size and forecast, by Service Type
        • 7.3.5.4. Italy
          • 7.3.5.4.1. Key market trends, growth factors and opportunities
          • 7.3.5.4.2. Market size and forecast, by Equipment Type
          • 7.3.5.4.3. Market size and forecast, by End Users
          • 7.3.5.4.4. Market size and forecast, by Service Type
        • 7.3.5.5. Spain
          • 7.3.5.5.1. Key market trends, growth factors and opportunities
          • 7.3.5.5.2. Market size and forecast, by Equipment Type
          • 7.3.5.5.3. Market size and forecast, by End Users
          • 7.3.5.5.4. Market size and forecast, by Service Type
        • 7.3.5.6. Rest of Europe
          • 7.3.5.6.1. Key market trends, growth factors and opportunities
          • 7.3.5.6.2. Market size and forecast, by Equipment Type
          • 7.3.5.6.3. Market size and forecast, by End Users
          • 7.3.5.6.4. Market size and forecast, by Service Type
    • 7.4. Asia-Pacific

      • 7.4.1. Key trends and opportunities

      • 7.4.2. Market size and forecast, by Equipment Type

      • 7.4.3. Market size and forecast, by End Users

      • 7.4.4. Market size and forecast, by Service Type

      • 7.4.5. Market size and forecast, by country

        • 7.4.5.1. China
          • 7.4.5.1.1. Key market trends, growth factors and opportunities
          • 7.4.5.1.2. Market size and forecast, by Equipment Type
          • 7.4.5.1.3. Market size and forecast, by End Users
          • 7.4.5.1.4. Market size and forecast, by Service Type
        • 7.4.5.2. Japan
          • 7.4.5.2.1. Key market trends, growth factors and opportunities
          • 7.4.5.2.2. Market size and forecast, by Equipment Type
          • 7.4.5.2.3. Market size and forecast, by End Users
          • 7.4.5.2.4. Market size and forecast, by Service Type
        • 7.4.5.3. India
          • 7.4.5.3.1. Key market trends, growth factors and opportunities
          • 7.4.5.3.2. Market size and forecast, by Equipment Type
          • 7.4.5.3.3. Market size and forecast, by End Users
          • 7.4.5.3.4. Market size and forecast, by Service Type
        • 7.4.5.4. South Korea
          • 7.4.5.4.1. Key market trends, growth factors and opportunities
          • 7.4.5.4.2. Market size and forecast, by Equipment Type
          • 7.4.5.4.3. Market size and forecast, by End Users
          • 7.4.5.4.4. Market size and forecast, by Service Type
        • 7.4.5.5. Australia
          • 7.4.5.5.1. Key market trends, growth factors and opportunities
          • 7.4.5.5.2. Market size and forecast, by Equipment Type
          • 7.4.5.5.3. Market size and forecast, by End Users
          • 7.4.5.5.4. Market size and forecast, by Service Type
        • 7.4.5.6. Rest of Asia-Pacific
          • 7.4.5.6.1. Key market trends, growth factors and opportunities
          • 7.4.5.6.2. Market size and forecast, by Equipment Type
          • 7.4.5.6.3. Market size and forecast, by End Users
          • 7.4.5.6.4. Market size and forecast, by Service Type
    • 7.5. LAMEA

      • 7.5.1. Key trends and opportunities

      • 7.5.2. Market size and forecast, by Equipment Type

      • 7.5.3. Market size and forecast, by End Users

      • 7.5.4. Market size and forecast, by Service Type

      • 7.5.5. Market size and forecast, by country

        • 7.5.5.1. Brazil
          • 7.5.5.1.1. Key market trends, growth factors and opportunities
          • 7.5.5.1.2. Market size and forecast, by Equipment Type
          • 7.5.5.1.3. Market size and forecast, by End Users
          • 7.5.5.1.4. Market size and forecast, by Service Type
        • 7.5.5.2. South Africa,
          • 7.5.5.2.1. Key market trends, growth factors and opportunities
          • 7.5.5.2.2. Market size and forecast, by Equipment Type
          • 7.5.5.2.3. Market size and forecast, by End Users
          • 7.5.5.2.4. Market size and forecast, by Service Type
        • 7.5.5.3. Rest of LAMEA
          • 7.5.5.3.1. Key market trends, growth factors and opportunities
          • 7.5.5.3.2. Market size and forecast, by Equipment Type
          • 7.5.5.3.3. Market size and forecast, by End Users
          • 7.5.5.3.4. Market size and forecast, by Service Type
  • CHAPTER 8: COMPETITIVE LANDSCAPE

    • 8.1. Introduction

    • 8.2. Top winning strategies

    • 8.3. Product Mapping of Top 10 Player

    • 8.4. Competitive Dashboard

    • 8.5. Competitive Heatmap

    • 8.6. Top player positioning, 2021

  • CHAPTER 9: COMPANY PROFILES

    • 9.1. Encompass Supply Chain Solutions, Inc.

      • 9.1.1. Company overview

      • 9.1.2. Key Executives

      • 9.1.3. Company snapshot

      • 9.1.4. Operating business segments

      • 9.1.5. Product portfolio

      • 9.1.6. Key strategic moves and developments

    • 9.2. American Home Shield Corporation

      • 9.2.1. Company overview

      • 9.2.2. Key Executives

      • 9.2.3. Company snapshot

      • 9.2.4. Operating business segments

      • 9.2.5. Product portfolio

    • 9.3. Asurion, LLC

      • 9.3.1. Company overview

      • 9.3.2. Key Executives

      • 9.3.3. Company snapshot

      • 9.3.4. Operating business segments

      • 9.3.5. Product portfolio

      • 9.3.6. Key strategic moves and developments

    • 9.4. Best Buy Co., Inc.

      • 9.4.1. Company overview

      • 9.4.2. Key Executives

      • 9.4.3. Company snapshot

      • 9.4.4. Operating business segments

      • 9.4.5. Product portfolio

      • 9.4.6. Business performance

      • 9.4.7. Key strategic moves and developments

    • 9.5. iCracked Inc.

      • 9.5.1. Company overview

      • 9.5.2. Key Executives

      • 9.5.3. Company snapshot

      • 9.5.4. Operating business segments

      • 9.5.5. Product portfolio

    • 9.6. B2X Care Solutions GmbH

      • 9.6.1. Company overview

      • 9.6.2. Key Executives

      • 9.6.3. Company snapshot

      • 9.6.4. Operating business segments

      • 9.6.5. Product portfolio

      • 9.6.6. Key strategic moves and developments

    • 9.7. Electronix Services

      • 9.7.1. Company overview

      • 9.7.2. Key Executives

      • 9.7.3. Company snapshot

      • 9.7.4. Operating business segments

      • 9.7.5. Product portfolio

    • 9.8. CNS Brasil Informatica LTDA

      • 9.8.1. Company overview

      • 9.8.2. Key Executives

      • 9.8.3. Company snapshot

      • 9.8.4. Operating business segments

      • 9.8.5. Product portfolio

    • 9.9. Ensure Services

      • 9.9.1. Company overview

      • 9.9.2. Key Executives

      • 9.9.3. Company snapshot

      • 9.9.4. Operating business segments

      • 9.9.5. Product portfolio

    • 9.10. UrbanClap Technologies Private limited

      • 9.10.1. Company overview

      • 9.10.2. Key Executives

      • 9.10.3. Company snapshot

      • 9.10.4. Operating business segments

      • 9.10.5. Product portfolio

  • LIST OF TABLES

  • TABLE 01. GLOBAL CONSUMER ELECTRONICS REPAIR AND MAINTENANCE MARKET, BY EQUIPMENT TYPE, 2021-2031 ($MILLION)
    TABLE 02. CONSUMER ELECTRONICS REPAIR AND MAINTENANCE MARKET FOR MOBILES, BY REGION, 2021-2031 ($MILLION)
    TABLE 03. CONSUMER ELECTRONICS REPAIR AND MAINTENANCE MARKET FOR PC, BY REGION, 2021-2031 ($MILLION)
    TABLE 04. CONSUMER ELECTRONICS REPAIR AND MAINTENANCE MARKET FOR WASHING MACHINE, BY REGION, 2021-2031 ($MILLION)
    TABLE 05. GLOBAL WASHING MACHINE CONSUMER ELECTRONICS REPAIR AND MAINTENANCE MARKET, BY FUNCTION, 2021-2031 ($MILLION)
    TABLE 06. CONSUMER ELECTRONICS REPAIR AND MAINTENANCE MARKET FOR REFRIGERATOR, BY REGION, 2021-2031 ($MILLION)
    TABLE 07. CONSUMER ELECTRONICS REPAIR AND MAINTENANCE MARKET FOR OTHERS, BY REGION, 2021-2031 ($MILLION)
    TABLE 08. GLOBAL CONSUMER ELECTRONICS REPAIR AND MAINTENANCE MARKET, BY END USERS, 2021-2031 ($MILLION)
    TABLE 09. CONSUMER ELECTRONICS REPAIR AND MAINTENANCE MARKET FOR RESIDENTIAL, BY REGION, 2021-2031 ($MILLION)
    TABLE 10. CONSUMER ELECTRONICS REPAIR AND MAINTENANCE MARKET FOR COMMERCIAL, BY REGION, 2021-2031 ($MILLION)
    TABLE 11. GLOBAL CONSUMER ELECTRONICS REPAIR AND MAINTENANCE MARKET, BY SERVICE TYPE, 2021-2031 ($MILLION)
    TABLE 12. CONSUMER ELECTRONICS REPAIR AND MAINTENANCE MARKET FOR IN-WARRANTY, BY REGION, 2021-2031 ($MILLION)
    TABLE 13. CONSUMER ELECTRONICS REPAIR AND MAINTENANCE MARKET FOR OUT OF WARRANTY, BY REGION, 2021-2031 ($MILLION)
    TABLE 14. CONSUMER ELECTRONICS REPAIR AND MAINTENANCE MARKET, BY REGION, 2021-2031 ($MILLION)
    TABLE 15. NORTH AMERICA CONSUMER ELECTRONICS REPAIR AND MAINTENANCE MARKET, BY EQUIPMENT TYPE, 2021-2031 ($MILLION)
    TABLE 16. NORTH AMERICA CONSUMER ELECTRONICS REPAIR AND MAINTENANCE MARKET, BY END USERS, 2021-2031 ($MILLION)
    TABLE 17. NORTH AMERICA CONSUMER ELECTRONICS REPAIR AND MAINTENANCE MARKET, BY SERVICE TYPE, 2021-2031 ($MILLION)
    TABLE 18. NORTH AMERICA CONSUMER ELECTRONICS REPAIR AND MAINTENANCE MARKET, BY COUNTRY, 2021-2031 ($MILLION)
    TABLE 19. U.S. CONSUMER ELECTRONICS REPAIR AND MAINTENANCE MARKET, BY EQUIPMENT TYPE, 2021-2031 ($MILLION)
    TABLE 20. U.S. CONSUMER ELECTRONICS REPAIR AND MAINTENANCE MARKET, BY END USERS, 2021-2031 ($MILLION)
    TABLE 21. U.S. CONSUMER ELECTRONICS REPAIR AND MAINTENANCE MARKET, BY SERVICE TYPE, 2021-2031 ($MILLION)
    TABLE 22. CANADA CONSUMER ELECTRONICS REPAIR AND MAINTENANCE MARKET, BY EQUIPMENT TYPE, 2021-2031 ($MILLION)
    TABLE 23. CANADA CONSUMER ELECTRONICS REPAIR AND MAINTENANCE MARKET, BY END USERS, 2021-2031 ($MILLION)
    TABLE 24. CANADA CONSUMER ELECTRONICS REPAIR AND MAINTENANCE MARKET, BY SERVICE TYPE, 2021-2031 ($MILLION)
    TABLE 25. MEXICO CONSUMER ELECTRONICS REPAIR AND MAINTENANCE MARKET, BY EQUIPMENT TYPE, 2021-2031 ($MILLION)
    TABLE 26. MEXICO CONSUMER ELECTRONICS REPAIR AND MAINTENANCE MARKET, BY END USERS, 2021-2031 ($MILLION)
    TABLE 27. MEXICO CONSUMER ELECTRONICS REPAIR AND MAINTENANCE MARKET, BY SERVICE TYPE, 2021-2031 ($MILLION)
    TABLE 28. EUROPE CONSUMER ELECTRONICS REPAIR AND MAINTENANCE MARKET, BY EQUIPMENT TYPE, 2021-2031 ($MILLION)
    TABLE 29. EUROPE CONSUMER ELECTRONICS REPAIR AND MAINTENANCE MARKET, BY END USERS, 2021-2031 ($MILLION)
    TABLE 30. EUROPE CONSUMER ELECTRONICS REPAIR AND MAINTENANCE MARKET, BY SERVICE TYPE, 2021-2031 ($MILLION)
    TABLE 31. EUROPE CONSUMER ELECTRONICS REPAIR AND MAINTENANCE MARKET, BY COUNTRY, 2021-2031 ($MILLION)
    TABLE 32. GERMANY CONSUMER ELECTRONICS REPAIR AND MAINTENANCE MARKET, BY EQUIPMENT TYPE, 2021-2031 ($MILLION)
    TABLE 33. GERMANY CONSUMER ELECTRONICS REPAIR AND MAINTENANCE MARKET, BY END USERS, 2021-2031 ($MILLION)
    TABLE 34. GERMANY CONSUMER ELECTRONICS REPAIR AND MAINTENANCE MARKET, BY SERVICE TYPE, 2021-2031 ($MILLION)
    TABLE 35. FRANCE CONSUMER ELECTRONICS REPAIR AND MAINTENANCE MARKET, BY EQUIPMENT TYPE, 2021-2031 ($MILLION)
    TABLE 36. FRANCE CONSUMER ELECTRONICS REPAIR AND MAINTENANCE MARKET, BY END USERS, 2021-2031 ($MILLION)
    TABLE 37. FRANCE CONSUMER ELECTRONICS REPAIR AND MAINTENANCE MARKET, BY SERVICE TYPE, 2021-2031 ($MILLION)
    TABLE 38. UK CONSUMER ELECTRONICS REPAIR AND MAINTENANCE MARKET, BY EQUIPMENT TYPE, 2021-2031 ($MILLION)
    TABLE 39. UK CONSUMER ELECTRONICS REPAIR AND MAINTENANCE MARKET, BY END USERS, 2021-2031 ($MILLION)
    TABLE 40. UK CONSUMER ELECTRONICS REPAIR AND MAINTENANCE MARKET, BY SERVICE TYPE, 2021-2031 ($MILLION)
    TABLE 41. ITALY CONSUMER ELECTRONICS REPAIR AND MAINTENANCE MARKET, BY EQUIPMENT TYPE, 2021-2031 ($MILLION)
    TABLE 42. ITALY CONSUMER ELECTRONICS REPAIR AND MAINTENANCE MARKET, BY END USERS, 2021-2031 ($MILLION)
    TABLE 43. ITALY CONSUMER ELECTRONICS REPAIR AND MAINTENANCE MARKET, BY SERVICE TYPE, 2021-2031 ($MILLION)
    TABLE 44. SPAIN CONSUMER ELECTRONICS REPAIR AND MAINTENANCE MARKET, BY EQUIPMENT TYPE, 2021-2031 ($MILLION)
    TABLE 45. SPAIN CONSUMER ELECTRONICS REPAIR AND MAINTENANCE MARKET, BY END USERS, 2021-2031 ($MILLION)
    TABLE 46. SPAIN CONSUMER ELECTRONICS REPAIR AND MAINTENANCE MARKET, BY SERVICE TYPE, 2021-2031 ($MILLION)
    TABLE 47. REST OF EUROPE CONSUMER ELECTRONICS REPAIR AND MAINTENANCE MARKET, BY EQUIPMENT TYPE, 2021-2031 ($MILLION)
    TABLE 48. REST OF EUROPE CONSUMER ELECTRONICS REPAIR AND MAINTENANCE MARKET, BY END USERS, 2021-2031 ($MILLION)
    TABLE 49. REST OF EUROPE CONSUMER ELECTRONICS REPAIR AND MAINTENANCE MARKET, BY SERVICE TYPE, 2021-2031 ($MILLION)
    TABLE 50. ASIA-PACIFIC CONSUMER ELECTRONICS REPAIR AND MAINTENANCE MARKET, BY EQUIPMENT TYPE, 2021-2031 ($MILLION)
    TABLE 51. ASIA-PACIFIC CONSUMER ELECTRONICS REPAIR AND MAINTENANCE MARKET, BY END USERS, 2021-2031 ($MILLION)
    TABLE 52. ASIA-PACIFIC CONSUMER ELECTRONICS REPAIR AND MAINTENANCE MARKET, BY SERVICE TYPE, 2021-2031 ($MILLION)
    TABLE 53. ASIA-PACIFIC CONSUMER ELECTRONICS REPAIR AND MAINTENANCE MARKET, BY COUNTRY, 2021-2031 ($MILLION)
    TABLE 54. CHINA CONSUMER ELECTRONICS REPAIR AND MAINTENANCE MARKET, BY EQUIPMENT TYPE, 2021-2031 ($MILLION)
    TABLE 55. CHINA CONSUMER ELECTRONICS REPAIR AND MAINTENANCE MARKET, BY END USERS, 2021-2031 ($MILLION)
    TABLE 56. CHINA CONSUMER ELECTRONICS REPAIR AND MAINTENANCE MARKET, BY SERVICE TYPE, 2021-2031 ($MILLION)
    TABLE 57. JAPAN CONSUMER ELECTRONICS REPAIR AND MAINTENANCE MARKET, BY EQUIPMENT TYPE, 2021-2031 ($MILLION)
    TABLE 58. JAPAN CONSUMER ELECTRONICS REPAIR AND MAINTENANCE MARKET, BY END USERS, 2021-2031 ($MILLION)
    TABLE 59. JAPAN CONSUMER ELECTRONICS REPAIR AND MAINTENANCE MARKET, BY SERVICE TYPE, 2021-2031 ($MILLION)
    TABLE 60. INDIA CONSUMER ELECTRONICS REPAIR AND MAINTENANCE MARKET, BY EQUIPMENT TYPE, 2021-2031 ($MILLION)
    TABLE 61. INDIA CONSUMER ELECTRONICS REPAIR AND MAINTENANCE MARKET, BY END USERS, 2021-2031 ($MILLION)
    TABLE 62. INDIA CONSUMER ELECTRONICS REPAIR AND MAINTENANCE MARKET, BY SERVICE TYPE, 2021-2031 ($MILLION)
    TABLE 63. SOUTH KOREA CONSUMER ELECTRONICS REPAIR AND MAINTENANCE MARKET, BY EQUIPMENT TYPE, 2021-2031 ($MILLION)
    TABLE 64. SOUTH KOREA CONSUMER ELECTRONICS REPAIR AND MAINTENANCE MARKET, BY END USERS, 2021-2031 ($MILLION)
    TABLE 65. SOUTH KOREA CONSUMER ELECTRONICS REPAIR AND MAINTENANCE MARKET, BY SERVICE TYPE, 2021-2031 ($MILLION)
    TABLE 66. AUSTRALIA CONSUMER ELECTRONICS REPAIR AND MAINTENANCE MARKET, BY EQUIPMENT TYPE, 2021-2031 ($MILLION)
    TABLE 67. AUSTRALIA CONSUMER ELECTRONICS REPAIR AND MAINTENANCE MARKET, BY END USERS, 2021-2031 ($MILLION)
    TABLE 68. AUSTRALIA CONSUMER ELECTRONICS REPAIR AND MAINTENANCE MARKET, BY SERVICE TYPE, 2021-2031 ($MILLION)
    TABLE 69. REST OF ASIA-PACIFIC CONSUMER ELECTRONICS REPAIR AND MAINTENANCE MARKET, BY EQUIPMENT TYPE, 2021-2031 ($MILLION)
    TABLE 70. REST OF ASIA-PACIFIC CONSUMER ELECTRONICS REPAIR AND MAINTENANCE MARKET, BY END USERS, 2021-2031 ($MILLION)
    TABLE 71. REST OF ASIA-PACIFIC CONSUMER ELECTRONICS REPAIR AND MAINTENANCE MARKET, BY SERVICE TYPE, 2021-2031 ($MILLION)
    TABLE 72. LAMEA CONSUMER ELECTRONICS REPAIR AND MAINTENANCE MARKET, BY EQUIPMENT TYPE, 2021-2031 ($MILLION)
    TABLE 73. LAMEA CONSUMER ELECTRONICS REPAIR AND MAINTENANCE MARKET, BY END USERS, 2021-2031 ($MILLION)
    TABLE 74. LAMEA CONSUMER ELECTRONICS REPAIR AND MAINTENANCE MARKET, BY SERVICE TYPE, 2021-2031 ($MILLION)
    TABLE 75. LAMEA CONSUMER ELECTRONICS REPAIR AND MAINTENANCE MARKET, BY COUNTRY, 2021-2031 ($MILLION)
    TABLE 76. BRAZIL CONSUMER ELECTRONICS REPAIR AND MAINTENANCE MARKET, BY EQUIPMENT TYPE, 2021-2031 ($MILLION)
    TABLE 77. BRAZIL CONSUMER ELECTRONICS REPAIR AND MAINTENANCE MARKET, BY END USERS, 2021-2031 ($MILLION)
    TABLE 78. BRAZIL CONSUMER ELECTRONICS REPAIR AND MAINTENANCE MARKET, BY SERVICE TYPE, 2021-2031 ($MILLION)
    TABLE 79. SOUTH AFRICA, CONSUMER ELECTRONICS REPAIR AND MAINTENANCE MARKET, BY EQUIPMENT TYPE, 2021-2031 ($MILLION)
    TABLE 80. SOUTH AFRICA, CONSUMER ELECTRONICS REPAIR AND MAINTENANCE MARKET, BY END USERS, 2021-2031 ($MILLION)
    TABLE 81. SOUTH AFRICA, CONSUMER ELECTRONICS REPAIR AND MAINTENANCE MARKET, BY SERVICE TYPE, 2021-2031 ($MILLION)
    TABLE 82. REST OF LAMEA CONSUMER ELECTRONICS REPAIR AND MAINTENANCE MARKET, BY EQUIPMENT TYPE, 2021-2031 ($MILLION)
    TABLE 83. REST OF LAMEA CONSUMER ELECTRONICS REPAIR AND MAINTENANCE MARKET, BY END USERS, 2021-2031 ($MILLION)
    TABLE 84. REST OF LAMEA CONSUMER ELECTRONICS REPAIR AND MAINTENANCE MARKET, BY SERVICE TYPE, 2021-2031 ($MILLION)
    TABLE 85. ENCOMPASS SUPPLY CHAIN SOLUTIONS, INC.: KEY EXECUTIVES
    TABLE 86. ENCOMPASS SUPPLY CHAIN SOLUTIONS, INC.: COMPANY SNAPSHOT
    TABLE 87. ENCOMPASS SUPPLY CHAIN SOLUTIONS, INC.: PRODUCT SEGMENTS
    TABLE 88. ENCOMPASS SUPPLY CHAIN SOLUTIONS, INC.: SERVICE SEGMENTS
    TABLE 89. ENCOMPASS SUPPLY CHAIN SOLUTIONS, INC.: PRODUCT PORTFOLIO
    TABLE 90. ENCOMPASS SUPPLY CHAIN SOLUTIONS, INC.: KEY STRATERGIES
    TABLE 91. AMERICAN HOME SHIELD CORPORATION: KEY EXECUTIVES
    TABLE 92. AMERICAN HOME SHIELD CORPORATION: COMPANY SNAPSHOT
    TABLE 93. AMERICAN HOME SHIELD CORPORATION: SERVICE SEGMENTS
    TABLE 94. AMERICAN HOME SHIELD CORPORATION: PRODUCT PORTFOLIO
    TABLE 95. ASURION, LLC: KEY EXECUTIVES
    TABLE 96. ASURION, LLC: COMPANY SNAPSHOT
    TABLE 97. ASURION, LLC: SERVICE SEGMENTS
    TABLE 98. ASURION, LLC: PRODUCT PORTFOLIO
    TABLE 99. ASURION, LLC: KEY STRATERGIES
    TABLE 100. BEST BUY CO., INC.: KEY EXECUTIVES
    TABLE 101. BEST BUY CO., INC.: COMPANY SNAPSHOT
    TABLE 102. BEST BUY CO., INC.: PRODUCT SEGMENTS
    TABLE 103. BEST BUY CO., INC.: PRODUCT PORTFOLIO
    TABLE 104. BEST BUY CO., INC.: KEY STRATERGIES
    TABLE 105. ICRACKED INC.: KEY EXECUTIVES
    TABLE 106. ICRACKED INC.: COMPANY SNAPSHOT
    TABLE 107. ICRACKED INC.: SERVICE SEGMENTS
    TABLE 108. ICRACKED INC.: PRODUCT PORTFOLIO
    TABLE 109. B2X CARE SOLUTIONS GMBH: KEY EXECUTIVES
    TABLE 110. B2X CARE SOLUTIONS GMBH: COMPANY SNAPSHOT
    TABLE 111. B2X CARE SOLUTIONS GMBH: SERVICE SEGMENTS
    TABLE 112. B2X CARE SOLUTIONS GMBH: PRODUCT PORTFOLIO
    TABLE 113. B2X CARE SOLUTIONS GMBH: KEY STRATERGIES
    TABLE 114. ELECTRONIX SERVICES: KEY EXECUTIVES
    TABLE 115. ELECTRONIX SERVICES: COMPANY SNAPSHOT
    TABLE 116. ELECTRONIX SERVICES: SERVICE SEGMENTS
    TABLE 117. ELECTRONIX SERVICES: PRODUCT PORTFOLIO
    TABLE 118. CNS BRASIL INFORMATICA LTDA: KEY EXECUTIVES
    TABLE 119. CNS BRASIL INFORMATICA LTDA: COMPANY SNAPSHOT
    TABLE 120. CNS BRASIL INFORMATICA LTDA: SERVICE SEGMENTS
    TABLE 121. CNS BRASIL INFORMATICA LTDA: PRODUCT PORTFOLIO
    TABLE 122. ENSURE SERVICES: KEY EXECUTIVES
    TABLE 123. ENSURE SERVICES: COMPANY SNAPSHOT
    TABLE 124. ENSURE SERVICES: SERVICE SEGMENTS
    TABLE 125. ENSURE SERVICES: PRODUCT PORTFOLIO
    TABLE 126. URBANCLAP TECHNOLOGIES PRIVATE LIMITED: KEY EXECUTIVES
    TABLE 127. URBANCLAP TECHNOLOGIES PRIVATE LIMITED: COMPANY SNAPSHOT
    TABLE 128. URBANCLAP TECHNOLOGIES PRIVATE LIMITED: SERVICE SEGMENTS
    TABLE 129. URBANCLAP TECHNOLOGIES PRIVATE LIMITED: PRODUCT PORTFOLIO
  • LIST OF FIGURES

  • FIGURE 01. CONSUMER ELECTRONICS REPAIR AND MAINTENANCE MARKET, 2021-2031
    FIGURE 02. SEGMENTATION OF CONSUMER ELECTRONICS REPAIR AND MAINTENANCE MARKET, 2021-2031
    FIGURE 03. TOP INVESTMENT POCKETS IN CONSUMER ELECTRONICS REPAIR AND MAINTENANCE MARKET (2022-2031)
    FIGURE 04. LOW BARGAINING POWER OF SUPPLIERS
    FIGURE 05. LOW BARGAINING POWER OF BUYERS
    FIGURE 06. LOW THREAT OF SUBSTITUTES
    FIGURE 07. LOW THREAT OF NEW ENTRANTS
    FIGURE 08. LOW INTENSITY OF RIVALRY
    FIGURE 09. DRIVERS, RESTRAINTS AND OPPORTUNITIES: GLOBALCONSUMER ELECTRONICS REPAIR AND MAINTENANCE MARKET
    FIGURE 10. CONSUMER ELECTRONICS REPAIR AND MAINTENANCE MARKET, BY EQUIPMENT TYPE, 2021(%)
    FIGURE 11. COMPARATIVE SHARE ANALYSIS OF CONSUMER ELECTRONICS REPAIR AND MAINTENANCE MARKET FOR MOBILES, BY COUNTRY 2021-2031(%)
    FIGURE 12. COMPARATIVE SHARE ANALYSIS OF CONSUMER ELECTRONICS REPAIR AND MAINTENANCE MARKET FOR PC, BY COUNTRY 2021-2031(%)
    FIGURE 13. COMPARATIVE SHARE ANALYSIS OF CONSUMER ELECTRONICS REPAIR AND MAINTENANCE MARKET FOR WASHING MACHINE, BY COUNTRY 2021-2031(%)
    FIGURE 14. COMPARATIVE SHARE ANALYSIS OF CONSUMER ELECTRONICS REPAIR AND MAINTENANCE MARKET FOR REFRIGERATOR, BY COUNTRY 2021-2031(%)
    FIGURE 15. COMPARATIVE SHARE ANALYSIS OF CONSUMER ELECTRONICS REPAIR AND MAINTENANCE MARKET FOR OTHERS, BY COUNTRY 2021-2031(%)
    FIGURE 16. CONSUMER ELECTRONICS REPAIR AND MAINTENANCE MARKET, BY END USERS, 2021(%)
    FIGURE 17. COMPARATIVE SHARE ANALYSIS OF CONSUMER ELECTRONICS REPAIR AND MAINTENANCE MARKET FOR RESIDENTIAL, BY COUNTRY 2021-2031(%)
    FIGURE 18. COMPARATIVE SHARE ANALYSIS OF CONSUMER ELECTRONICS REPAIR AND MAINTENANCE MARKET FOR COMMERCIAL, BY COUNTRY 2021-2031(%)
    FIGURE 19. CONSUMER ELECTRONICS REPAIR AND MAINTENANCE MARKET, BY SERVICE TYPE, 2021(%)
    FIGURE 20. COMPARATIVE SHARE ANALYSIS OF CONSUMER ELECTRONICS REPAIR AND MAINTENANCE MARKET FOR IN-WARRANTY, BY COUNTRY 2021-2031(%)
    FIGURE 21. COMPARATIVE SHARE ANALYSIS OF CONSUMER ELECTRONICS REPAIR AND MAINTENANCE MARKET FOR OUT OF WARRANTY, BY COUNTRY 2021-2031(%)
    FIGURE 22. CONSUMER ELECTRONICS REPAIR AND MAINTENANCE MARKET BY REGION, 2021
    FIGURE 23. U.S. CONSUMER ELECTRONICS REPAIR AND MAINTENANCE MARKET, 2021-2031 ($MILLION)
    FIGURE 24. CANADA CONSUMER ELECTRONICS REPAIR AND MAINTENANCE MARKET, 2021-2031 ($MILLION)
    FIGURE 25. MEXICO CONSUMER ELECTRONICS REPAIR AND MAINTENANCE MARKET, 2021-2031 ($MILLION)
    FIGURE 26. GERMANY CONSUMER ELECTRONICS REPAIR AND MAINTENANCE MARKET, 2021-2031 ($MILLION)
    FIGURE 27. FRANCE CONSUMER ELECTRONICS REPAIR AND MAINTENANCE MARKET, 2021-2031 ($MILLION)
    FIGURE 28. UK CONSUMER ELECTRONICS REPAIR AND MAINTENANCE MARKET, 2021-2031 ($MILLION)
    FIGURE 29. ITALY CONSUMER ELECTRONICS REPAIR AND MAINTENANCE MARKET, 2021-2031 ($MILLION)
    FIGURE 30. SPAIN CONSUMER ELECTRONICS REPAIR AND MAINTENANCE MARKET, 2021-2031 ($MILLION)
    FIGURE 31. REST OF EUROPE CONSUMER ELECTRONICS REPAIR AND MAINTENANCE MARKET, 2021-2031 ($MILLION)
    FIGURE 32. CHINA CONSUMER ELECTRONICS REPAIR AND MAINTENANCE MARKET, 2021-2031 ($MILLION)
    FIGURE 33. JAPAN CONSUMER ELECTRONICS REPAIR AND MAINTENANCE MARKET, 2021-2031 ($MILLION)
    FIGURE 34. INDIA CONSUMER ELECTRONICS REPAIR AND MAINTENANCE MARKET, 2021-2031 ($MILLION)
    FIGURE 35. SOUTH KOREA CONSUMER ELECTRONICS REPAIR AND MAINTENANCE MARKET, 2021-2031 ($MILLION)
    FIGURE 36. AUSTRALIA CONSUMER ELECTRONICS REPAIR AND MAINTENANCE MARKET, 2021-2031 ($MILLION)
    FIGURE 37. REST OF ASIA-PACIFIC CONSUMER ELECTRONICS REPAIR AND MAINTENANCE MARKET, 2021-2031 ($MILLION)
    FIGURE 38. BRAZIL CONSUMER ELECTRONICS REPAIR AND MAINTENANCE MARKET, 2021-2031 ($MILLION)
    FIGURE 39. SOUTH AFRICA, CONSUMER ELECTRONICS REPAIR AND MAINTENANCE MARKET, 2021-2031 ($MILLION)
    FIGURE 40. REST OF LAMEA CONSUMER ELECTRONICS REPAIR AND MAINTENANCE MARKET, 2021-2031 ($MILLION)
    FIGURE 41. TOP WINNING STRATEGIES, BY YEAR
    FIGURE 42. TOP WINNING STRATEGIES, BY DEVELOPMENT
    FIGURE 43. TOP WINNING STRATEGIES, BY COMPANY
    FIGURE 44. PRODUCT MAPPING OF TOP 10 PLAYERS
    FIGURE 45. COMPETITIVE DASHBOARD
    FIGURE 46. COMPETITIVE HEATMAP: CONSUMER ELECTRONICS REPAIR AND MAINTENANCE MARKET
    FIGURE 47. TOP PLAYER POSITIONING, 2021
    FIGURE 48. BEST BUY CO., INC.: NET REVENUE, 2019-2021 ($MILLION)
    FIGURE 49. BEST BUY CO., INC.: REVENUE SHARE BY SEGMENT, 2021 (%)
    FIGURE 50. BEST BUY CO., INC.: REVENUE SHARE BY REGION, 2021 (%)


PURCHASE OPTIONS

Call or Email us

U.S.-Canada Toll-free: +1-800-792-5285
Int'l : +1-503-894-6022
Europe : +44-845-528-1300
Email : help@alliedmarketresearch.com
 
FREQUENTLY ASKED QUESTIONS?

A. The global consumer electronics repair and maintenance market size was valued at $15,290.52 million in 2021.

A. Mobile is the leading equipment type of Consumer Electronics Repair And Maintenance Market.

A. Increase in digitization, rise in use of consumer electronic goods, predictive maintenance, and increase in growth of online aggregators are some of the upcoming trends of the Consumer Electronics Repair And Maintenance Market in the world.

A. Europe is the largest regional market for Consumer Electronics Repair And Maintenance .

A. Encompass Supply Chain Solutions, Inc., American Home Shield Corporation, Asurion, LLC, Ensure Services, Best Buy Co., Inc., iCracked Inc., B2X Care Solutions GmbH, Electronix Services, CNS Brasil Informatica LTDA, and UrbanClap Technologies Private Limited are some of the leading companies in global Consumer Electronics Repair And Maintenance market.

A. The forecast period in the report is from 2022 to 2031.

Looking for Customization?

 Customization Request

Have a Question?

 Speak with Analyst

Any Confusion?

 Inquire Before Buying

Have a glance of the Report

  Request Sample
RELATED TAGS

Purchase Full Report of
Consumer Electronics Repair And Maintenance Market

Start reading instantly.
This Report and over 66,804+ more Reports, Available with Avenue Library. T&C*.

  • Online Only
  • $3,570
  • Online cloud access only
  • Restricted print, copy, paste & download
  • Read only
  • Free industry update
    (Within 180 days)
  • Free report update in next update cycle
    (Apr 2024 - Apr 2025)
  • Data Pack
  • $3,840
  • Restricted to one authorized user
  • One print only
  • Available in
    Excel
  • Free industry update
    (Within 180 days)
  •   Free report update in next update cycle
    (Apr 2024 - Apr 2025)
  • Single User
  • $5,730
  • Restricted to one authorized user
  • One print only
  • Available in
    PDF
  • Free industry update
    (Within 180 days)
  •   Free report update in next update cycle
    (Apr 2024 - Apr 2025)
  • Five Users
  • $6,450
  • Limited to five authorized users
  • Print upto five copies
  • Available in
    PDF
  • Free industry update
    (Within 180 days)
  •   Free report update in next update cycle
    (Apr 2024 - Apr 2025)
  • Enterprise
    License/PDF

  • $9,600
  • Unlimited
    within
    company/enterprise
  • Available in Excel & PDF
  • Free industry update
    (Within 180 days)
  •   Free report update in next update cycle
    (Apr 2024 - Apr 2025)
  • Library
    Membership

  • $999 $ 1,175
    Per User/ Per month/ Billed annually
  • Published Content
    E-access
  • Company Profiles
    E-access
  • Newly Added Content Access
  • 10 PDF
    Downloads
  • 5 Excel Data
    Pack Downloads
  • 250 Company Profiles PDF Downloads
  • Buy Now

*Taxes/Fees, if applicable will be added during checkout. All prices in USD

RELATED REPORTS
 

Why Allied Market Research?


Infallible Methodology

To ensure high-level data integrity, accurate analysis, and impeccable forecasts

Analyst Support

For complete satisfaction

Customization

On-demand customization of scope of the report to exactly meet your needs

TARGETED MARKET VIEW

Targeted market view to provide pertinent information and save time of readers

Get fresh content delivered

Get insights on topics that are crucial for your business. Stay abreast of your interest areas.

Get Industry Data Alerts

Why Allied Market Research?

Infallible Methodology

To ensure high-level data integrity, accurate analysis, and impeccable forecasts

Analyst Support

For complete satisfaction

Customization

On-demand customization of scope of the report to exactly meet your needs

TARGETED MARKET VIEW

Targeted market view to provide pertinent information and save time of readers