0
New
New
2023
Contactless Payment Market

Contactless Payment Market

by Device Type (Smartphones and Wearables, Smart Cards, PoS Terminals), by Application (Food and Groceries, Pharmacy and Drug Stores, Restaurants and Bars, Consumer Electronics, Media and Entertainment, Others): Global Opportunity Analysis and Industry Forecast, 2023-2032

Report Code: A02181
Aug 2023 | Pages: 315
Tables: 107
Charts: 71
  • Formats*:

  • pdf

    Single User License, Five User
    License & Enterprise User License

  • xls

    Data Pack Excel License

  • ppt

    It comes with the additional cost
    of $2500.00 contact sales.


Contactless Payment Market Research, 2032

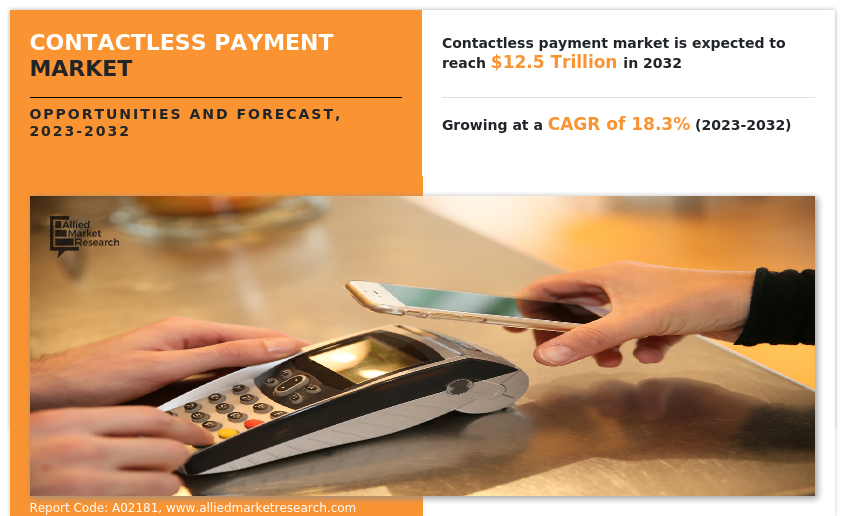
The global contactless payment market was valued at $2.4 trillion in 2022, and is projected to reach $12.5 trillion by 2032, growing at a CAGR of 18.3% from 2023 to 2032.

Contactless payment is a secure method for consumers to purchase products or services, with the use of devices such as smart cards, wearables, key fobs, smartphones, and others. Primarily, contactless payment uses radio-frequency Identification (RFID) and near field communication (NFC) technologies to facilitate contactless transactions in the market. In addition, the embedded chip & antenna placed in transaction devices enable consumers to wave or tap their smart cards, key fob, or handheld device over a reader at the point of sale (POS) terminal.

An increase in the potential of cashless payments across the globe and a rise in demand for wearable devices along with contactless payments for secure and safer payment transactions are driving the growth of the contactless payment market. Furthermore, the rise in the adoption of mobile and contactless payments by merchants and businesses is driving the contactless payment market growth. More retailers, restaurants, service providers, and other businesses are accepting and offering mobile and contactless payments, to attract and retain customers, increase sales, and reduce costs. In addition, with contactless payment trends, NFC card adoption has increased, with an increasing number of merchants accepting NFC-enabled cards. This, in turn, attracts all types of companies to offer their goods and services via contactless NFC card payments, thus driving the growth of the market. However, the rise in data privacy and security issues while conducting payments hampers the growth of the market. On the contrary, the integration of IoT in contactless payment technology and untapped potential of emerging economies are expected to provide lucrative growth opportunities to the contactless payment market in the upcoming years.

The report focuses on growth prospects, restraints, and trends of the contactless payment market forecast. The study provides Porter’s five forces analysis to understand the impact of various factors such as bargaining power of suppliers, competitive intensity of competitors, threat of new entrants, threat of substitutes, and bargaining power of buyers on the contactless payment market outlook.

The COVID-19 pandemic positively impacted the contactless payment market, owing to the increase in use and adoption of online and digitalized payment methods globally. The pandemic across the globe prompted widespread changes in consumer behavior and preferences, accelerating the adoption of contactless payments.

Contactless Payment Market

Segment Review

The contactless payment market is segmented on the basis of device type, application, and region. By device type, the market is divided into smartphones and wearables, smart cards, and point-of-sale (POS) terminals. By application, it is segmented into food and groceries, pharmacy and drug stores, restaurants and bars, consumer electronics, media and entertainment, and others. Region wise, the market is analyzed across North America, Europe, Asia-Pacific, and LAMEA.

Contactless Payment Market

By device type, the smartphones and wearable segment acquired a major contactless payment market share in 2022. This is attributed to the rising penetration of smartphone devices used for making payments among the youth population across the globe. The use of digital wallets for making contactless payments through smartphones has increased the usage of smartphones in everyday tasks and activities. Furthermore, innovations in wearables, such as payment watches for making contactless payments, are expected to propel the segment's growth. However, the smart cards segment is expected to grow at the fastest CAGR during the forecast period. This is attributed to the growing adoption of contactless cards, such as credit and debit cards for making payments in sectors such as BSFI, retail, transportation, and hospitality.

Contactless Payment Market

By region, the contactless payment market was dominated by Europe in 2022, due to increased adoption of technologies, which has changed consumer behavior toward booking taxies, lodging, entertainment, and others. In addition, the launch of easy-to-use and new contactless applications, such as Samsung Pay, Apple Pay, and Google Wallet, has accelerated the usage of contactless payment by customers primarily in the retail and hospitality industries. These major factors influence the growth of the contactless payment market in Europe. However, Asia-Pacific is expected to grow at the fastest CAGR during the forecast period. This is attributed to the fact that as several consumers are adopting contactless payment for day-to-day transactions, increased government support toward investment in technologies are becoming a major growth factor in the region.

The key players operating in the contactless payment market include Visa Inc., American Express Company, PayPal, Inc., Apple Inc., Mastercard, Amazon.com, Inc., Square, Inc., Ingenico, VeriFone, Inc., and Thales. These players have adopted various strategies to increase their market penetration and strengthen their position in the contactless payment industry.

Market Landscape and Trends

Wearable devices are proven to be up to 10 times faster than traditional payment methods due to the removal of verifying a user’s identity with a PIN or signature during the transaction process. Through near-field communication (NFC) technology, wearable payments link a user’s smart device to a credit, debit, or prepaid card, eliminating the need to touch public surfaces and point of sale (POS) terminals. NFC technology only activates when there is a minimal distance between a smart device and a payment terminal, ensuring that consumers only pay for their purchases. Thus, this factor is expected to provide lucrative growth opportunities for the contactless payment industry in the upcoming years.

Furthermore, in February 2022, Apple introduced Tap to Pay on iPhone. The new capability empowers millions of merchants across the U.S., from small businesses to large retailers, to use their iPhone to accept Apple Pay, contactless credit and debit cards seamlessly and securely, and other digital wallets through a simple tap to their iPhone with no additional hardware or payment terminal needed.

The COVID-19 pandemic accelerated the adoption of contactless payment and has resulted in greater investments in the contactless payment industry, with a focus on digital transformation. With social distancing measures, contactless payment methods faced higher acceptance among merchants and consumers. The fear of virus transmission through cash or card handling led to a surge in demand for the contactless payment industry. Many governments and businesses encouraged the use of contactless payment to reduce the spread of the virus. Thus, these factors drive the growth of the contactless payment market size during the pandemic.

Top Impacting Factors

Surge in demand for mobile & wearable payment devices

An increase in the potential of cashless payments across the globe and a rise in demand for wearable devices along with contactless payment for secure and safer payment transactions are driving the growth of the contactless payment market. Moreover, during the COVID-19 pandemic, the payments industry saw rapid adoption of contactless payment in India. According to a global consumer survey, 79% of participants prefer to use contactless payment methods due to safety and sanitary reasons. Furthermore, key players in the market adopted various strategies such as partnership and product launch during the pandemic to improve their product portfolio and provide contactless payment methods to stay protected from the spread of virus.

For instance, in September 2020, keeping pandemic and social distancing as the focus, watch maker Titan launched five new models in India in partnership with State Bank of India. These are not smartwatches but still come with a ‘smart' feature – contactless payment. All users need to do is to tap the Titan watch to the contactless payment POS machines so the transaction take place.

Rise in adoption of contactless payment among merchants

The rise in the adoption of mobile and contactless payment by merchants and businesses is driving the contactless payment market growth. More retailers, restaurants, service providers, and other businesses are accepting and offering mobile and contactless payment, to attract and retain customers, increase sales, and reduce costs. Moreover, they are investing in new and improved payment systems, terminals, and software, to enable and integrate mobile and contactless payment with their operations, marketing, and customer service.

In addition, as contactless payments are executed through smartphones, which use Near-Field-Communication (NFC) technology, consumers are increasingly using mobile payment systems. In addition, customers swipe their smartphone over a card reader to make a purchase without using credit and debit cards or counting out cash. Therefore, merchants & retailers are largely adopting contactless payment technology in their businesses, with consumers using contactless payment for day-to-day transactions. Thus, adoption & implementation of contactless payment technology among merchants is one of the major factors that propels the market growth.

Adoption of NFC card payments

The COVID-19 pandemic catalyzed the accelerated adoption of contactless payment. NFC-enabled cards played a crucial role in promoting touchless transactions, reducing the need for physical contact, and minimizing the spread of virus. With contactless payment trends, NFC cards adoption has increased, with an increasing number of merchants accepting NFC-enabled cards. From local businesses to global retailers, one confidently tap their card at an expanding range of locations, including grocery stores, restaurants, and even vending machines. The widespread availability of NFC-enabled cards from various issuers further enhances their convenience and usability promoting the contactless payment market growth.

Integration of IoT in contactless payment technology

Contactless transaction is considered as a key factor that significantly contributes toward the growth of the contactless payment market. For instance, Apple Pay and Android Pay enable new technologies such as NFC and contactless payment with QR codes and pre-staged mobile transactions, which are gaining increased traction in the market. Moreover, advancement in technology through integration of Internet of Things (IoT) with contactless payment has led to the development of innovative devices to customers.

For instance, in July 2021, Mastercard and Verizon formed a partnership focused on 5G contactless payment for consumers as well as small- and medium-sized businesses. The collaboration aimed to enable businesses to use emerging payment technologies to turn smartphones into cash registers, to turn wearables such as watches as payment devices, and to facilitate touchless retail similar to Amazon Go stores. Therefore, these factors are expected to remain major trends in the market.

Key Benefits for Stakeholders

  • This report provides a quantitative analysis of the market segments, current trends, estimations, and dynamics of the contactless payment market analysis from 2022 to 2032 to identify the prevailing contactless payment market opportunity.
  • Market research is offered along with information related to key drivers, restraints, and opportunities.
  • The Porter's five forces analysis highlights the potency of buyers and suppliers to enable stakeholders to make profit-oriented business decisions and strengthen their supplier-buyer network.
  • In-depth analysis of the contactless payment market segmentation assists to determine the prevailing contactless payment market opportunities.
  •  Major countries in each region are mapped according to their revenue contribution to the market.
  •  Market player positioning facilitates benchmarking and provides a clear understanding of the present position of the market players.
  • The report includes the analysis of the regional as well as contactless payment market trends, key players, market segments, application areas, and market growth strategies.

Contactless Payment Market Report Highlights

Aspects Details
Market Size By 2032 USD 12.5 trillion
Growth Rate CAGR of 18.3%
Forecast period 2022 - 2032
Report Pages 315
By Device Type
  • Smartphones and Wearables
  • Smart Cards
  • PoS Terminals
By Application
  • Food and Groceries
  • Pharmacy and Drug Stores
  • Restaurants and Bars
  • Consumer Electronics
  • Media and Entertainment
  • Others
By Region
  • North America  (U.S., Canada)
  • Europe  (UK, Germany, France, Italy, Spain, Rest of Europe)
  • Asia-Pacific  (China, Japan, India, Australia, South Korea, Rest of Asia-Pacific)
  • LAMEA  (Latin America, Middle East, Africa)
Key Market Players VeriFone, Inc., Square, Inc., Ingenico, Visa Inc., American Express Company, Apple Inc., Amazon.com, Inc., Mastercard, PayPal, Inc., Thales

Analyst Review

The exponential growth in contactless payment is attributed to the development of businesses and a greater adoption rate of contactless payment in areas such as North America, emerging economies of Asia-Pacific, and Latin America. Even early adopters such as Australia, Canada, and the UK are also picking up the pace to support the overall growth. Quick bank approvals and the widespread existence of 5G internet are the specific reasons that help these regions register such phenomenal growth.

Contactless payments have become a transformational force in the retail business, revolutionizing the way transactions are handled. This mode of payment has numerous benefits for small retailers, ranging from improved customer experiences and lower costs to increased security and market reach. Accepting contactless payment helps retailers speed up their transaction processes and develop a more resilient and future-ready business. Furthermore, in India, to educate and encourage consumers to upgrade their card payment experience, an upgrade that spurs innovations in the timeliness, convenience, safety, and security of contactless payment, RuPay launched a strategic campaign to promote contactless payment.

The COVID-19 pandemic accelerated the shift to mobile and contactless payment, as people avoided physical contact and sought safer and more hygienic ways to pay. The pandemic increased the demand for online shopping, delivery, and digital services, which require mobile and contactless payment. Thus, these factors boosted the adoption of contactless payment during the pandemic.

The key players in the contactless payment market are Visa Inc., American Express Company, PayPal, Inc., Apple Inc., Mastercard, Amazon.com, Inc., Square, Inc., Ingenico, VeriFone, Inc., and Thales. Major players that operate in this market have witnessed significant adoption of strategies that include business expansion and partnership to reduce supply and demand gap. With increase in awareness & demand for contactless payment across the globe, major players have collaborated with their product portfolio to provide differentiated and innovative products.

 
  • CHAPTER 1: INTRODUCTION

    • 1.1. Report description

    • 1.2. Key market segments

    • 1.3. Key benefits to the stakeholders

    • 1.4. Research Methodology

      • 1.4.1. Primary research

      • 1.4.2. Secondary research

      • 1.4.3. Analyst tools and models

  • CHAPTER 2: EXECUTIVE SUMMARY

    • 2.1. CXO Perspective

  • CHAPTER 3: MARKET OVERVIEW

    • 3.1. Market definition and scope

    • 3.2. Key findings

      • 3.2.1. Top impacting factors

      • 3.2.2. Top investment pockets

    • 3.3. Porter’s five forces analysis

      • 3.3.1. Low bargaining power of suppliers

      • 3.3.2. Low threat of new entrants

      • 3.3.3. Low threat of substitutes

      • 3.3.4. Low intensity of rivalry

      • 3.3.5. Low bargaining power of buyers

    • 3.4. Market dynamics

      • 3.4.1. Drivers

        • 3.4.1.1. Surge in demand for mobile & wearable payment devices
        • 3.4.1.2. Rise in adoption of contactless payments among merchants
        • 3.4.1.3. Adoption of NFC card payments
      • 3.4.2. Restraints

        • 3.4.2.1. Security and data privacy risks
      • 3.4.3. Opportunities

        • 3.4.3.1. Integration of IoT in contactless payment technology
        • 3.4.3.2. Untapped potential of emerging economies
  • CHAPTER 4: CONTACTLESS PAYMENT MARKET, BY DEVICE TYPE

    • 4.1. Overview

      • 4.1.1. Market size and forecast

    • 4.2. Smartphones and Wearables

      • 4.2.1. Key market trends, growth factors and opportunities

      • 4.2.2. Market size and forecast, by region

      • 4.2.3. Market share analysis by country

    • 4.3. Smart Cards

      • 4.3.1. Key market trends, growth factors and opportunities

      • 4.3.2. Market size and forecast, by region

      • 4.3.3. Market share analysis by country

    • 4.4. PoS Terminals

      • 4.4.1. Key market trends, growth factors and opportunities

      • 4.4.2. Market size and forecast, by region

      • 4.4.3. Market share analysis by country

  • CHAPTER 5: CONTACTLESS PAYMENT MARKET, BY APPLICATION

    • 5.1. Overview

      • 5.1.1. Market size and forecast

    • 5.2. Food and Groceries

      • 5.2.1. Key market trends, growth factors and opportunities

      • 5.2.2. Market size and forecast, by region

      • 5.2.3. Market share analysis by country

    • 5.3. Pharmacy and Drug Stores

      • 5.3.1. Key market trends, growth factors and opportunities

      • 5.3.2. Market size and forecast, by region

      • 5.3.3. Market share analysis by country

    • 5.4. Restaurants and Bars

      • 5.4.1. Key market trends, growth factors and opportunities

      • 5.4.2. Market size and forecast, by region

      • 5.4.3. Market share analysis by country

    • 5.5. Consumer Electronics

      • 5.5.1. Key market trends, growth factors and opportunities

      • 5.5.2. Market size and forecast, by region

      • 5.5.3. Market share analysis by country

    • 5.6. Media and Entertainment

      • 5.6.1. Key market trends, growth factors and opportunities

      • 5.6.2. Market size and forecast, by region

      • 5.6.3. Market share analysis by country

    • 5.7. Others

      • 5.7.1. Key market trends, growth factors and opportunities

      • 5.7.2. Market size and forecast, by region

      • 5.7.3. Market share analysis by country

  • CHAPTER 6: CONTACTLESS PAYMENT MARKET, BY REGION

    • 6.1. Overview

      • 6.1.1. Market size and forecast By Region

    • 6.2. North America

      • 6.2.1. Key market trends, growth factors and opportunities

      • 6.2.2. Market size and forecast, by Device Type

      • 6.2.3. Market size and forecast, by Application

      • 6.2.4. Market size and forecast, by country

        • 6.2.4.1. U.S.
          • 6.2.4.1.1. Market size and forecast, by Device Type
          • 6.2.4.1.2. Market size and forecast, by Application
        • 6.2.4.2. Canada
          • 6.2.4.2.1. Market size and forecast, by Device Type
          • 6.2.4.2.2. Market size and forecast, by Application
    • 6.3. Europe

      • 6.3.1. Key market trends, growth factors and opportunities

      • 6.3.2. Market size and forecast, by Device Type

      • 6.3.3. Market size and forecast, by Application

      • 6.3.4. Market size and forecast, by country

        • 6.3.4.1. UK
          • 6.3.4.1.1. Market size and forecast, by Device Type
          • 6.3.4.1.2. Market size and forecast, by Application
        • 6.3.4.2. Germany
          • 6.3.4.2.1. Market size and forecast, by Device Type
          • 6.3.4.2.2. Market size and forecast, by Application
        • 6.3.4.3. France
          • 6.3.4.3.1. Market size and forecast, by Device Type
          • 6.3.4.3.2. Market size and forecast, by Application
        • 6.3.4.4. Italy
          • 6.3.4.4.1. Market size and forecast, by Device Type
          • 6.3.4.4.2. Market size and forecast, by Application
        • 6.3.4.5. Spain
          • 6.3.4.5.1. Market size and forecast, by Device Type
          • 6.3.4.5.2. Market size and forecast, by Application
        • 6.3.4.6. Rest of Europe
          • 6.3.4.6.1. Market size and forecast, by Device Type
          • 6.3.4.6.2. Market size and forecast, by Application
    • 6.4. Asia-Pacific

      • 6.4.1. Key market trends, growth factors and opportunities

      • 6.4.2. Market size and forecast, by Device Type

      • 6.4.3. Market size and forecast, by Application

      • 6.4.4. Market size and forecast, by country

        • 6.4.4.1. China
          • 6.4.4.1.1. Market size and forecast, by Device Type
          • 6.4.4.1.2. Market size and forecast, by Application
        • 6.4.4.2. Japan
          • 6.4.4.2.1. Market size and forecast, by Device Type
          • 6.4.4.2.2. Market size and forecast, by Application
        • 6.4.4.3. India
          • 6.4.4.3.1. Market size and forecast, by Device Type
          • 6.4.4.3.2. Market size and forecast, by Application
        • 6.4.4.4. Australia
          • 6.4.4.4.1. Market size and forecast, by Device Type
          • 6.4.4.4.2. Market size and forecast, by Application
        • 6.4.4.5. South Korea
          • 6.4.4.5.1. Market size and forecast, by Device Type
          • 6.4.4.5.2. Market size and forecast, by Application
        • 6.4.4.6. Rest of Asia-Pacific
          • 6.4.4.6.1. Market size and forecast, by Device Type
          • 6.4.4.6.2. Market size and forecast, by Application
    • 6.5. LAMEA

      • 6.5.1. Key market trends, growth factors and opportunities

      • 6.5.2. Market size and forecast, by Device Type

      • 6.5.3. Market size and forecast, by Application

      • 6.5.4. Market size and forecast, by country

        • 6.5.4.1. Latin America
          • 6.5.4.1.1. Market size and forecast, by Device Type
          • 6.5.4.1.2. Market size and forecast, by Application
        • 6.5.4.2. Middle East
          • 6.5.4.2.1. Market size and forecast, by Device Type
          • 6.5.4.2.2. Market size and forecast, by Application
        • 6.5.4.3. Africa
          • 6.5.4.3.1. Market size and forecast, by Device Type
          • 6.5.4.3.2. Market size and forecast, by Application
  • CHAPTER 7: COMPETITIVE LANDSCAPE

    • 7.1. Introduction

    • 7.2. Top winning strategies

    • 7.3. Product Mapping of Top 10 Player

    • 7.4. Competitive Dashboard

    • 7.5. Competitive Heatmap

    • 7.6. Top player positioning, 2022

  • CHAPTER 8: COMPANY PROFILES

    • 8.1. Visa Inc.

      • 8.1.1. Company overview

      • 8.1.2. Key Executives

      • 8.1.3. Company snapshot

      • 8.1.4. Operating business segments

      • 8.1.5. Product portfolio

      • 8.1.6. Business performance

      • 8.1.7. Key strategic moves and developments

    • 8.2. American Express Company

      • 8.2.1. Company overview

      • 8.2.2. Key Executives

      • 8.2.3. Company snapshot

      • 8.2.4. Operating business segments

      • 8.2.5. Product portfolio

      • 8.2.6. Business performance

      • 8.2.7. Key strategic moves and developments

    • 8.3. PayPal, Inc.

      • 8.3.1. Company overview

      • 8.3.2. Key Executives

      • 8.3.3. Company snapshot

      • 8.3.4. Operating business segments

      • 8.3.5. Product portfolio

      • 8.3.6. Business performance

      • 8.3.7. Key strategic moves and developments

    • 8.4. Apple Inc.

      • 8.4.1. Company overview

      • 8.4.2. Key Executives

      • 8.4.3. Company snapshot

      • 8.4.4. Operating business segments

      • 8.4.5. Product portfolio

      • 8.4.6. Business performance

      • 8.4.7. Key strategic moves and developments

    • 8.5. Mastercard

      • 8.5.1. Company overview

      • 8.5.2. Key Executives

      • 8.5.3. Company snapshot

      • 8.5.4. Operating business segments

      • 8.5.5. Product portfolio

      • 8.5.6. Business performance

      • 8.5.7. Key strategic moves and developments

    • 8.6. Amazon.com, Inc.

      • 8.6.1. Company overview

      • 8.6.2. Key Executives

      • 8.6.3. Company snapshot

      • 8.6.4. Operating business segments

      • 8.6.5. Product portfolio

      • 8.6.6. Business performance

      • 8.6.7. Key strategic moves and developments

    • 8.7. Square, Inc.

      • 8.7.1. Company overview

      • 8.7.2. Key Executives

      • 8.7.3. Company snapshot

      • 8.7.4. Operating business segments

      • 8.7.5. Product portfolio

      • 8.7.6. Business performance

      • 8.7.7. Key strategic moves and developments

    • 8.8. Ingenico

      • 8.8.1. Company overview

      • 8.8.2. Key Executives

      • 8.8.3. Company snapshot

      • 8.8.4. Operating business segments

      • 8.8.5. Product portfolio

      • 8.8.6. Business performance

    • 8.9. VeriFone, Inc.

      • 8.9.1. Company overview

      • 8.9.2. Key Executives

      • 8.9.3. Company snapshot

      • 8.9.4. Operating business segments

      • 8.9.5. Product portfolio

      • 8.9.6. Key strategic moves and developments

    • 8.10. Thales

      • 8.10.1. Company overview

      • 8.10.2. Key Executives

      • 8.10.3. Company snapshot

      • 8.10.4. Operating business segments

      • 8.10.5. Product portfolio

      • 8.10.6. Business performance

      • 8.10.7. Key strategic moves and developments

  • LIST OF TABLES

  • TABLE 01. GLOBAL CONTACTLESS PAYMENT MARKET, BY DEVICE TYPE, 2022-2032 ($BILLION)
    TABLE 02. CONTACTLESS PAYMENT MARKET FOR SMARTPHONES AND WEARABLES, BY REGION, 2022-2032 ($BILLION)
    TABLE 03. CONTACTLESS PAYMENT MARKET FOR SMART CARDS, BY REGION, 2022-2032 ($BILLION)
    TABLE 04. CONTACTLESS PAYMENT MARKET FOR POS TERMINALS, BY REGION, 2022-2032 ($BILLION)
    TABLE 05. GLOBAL CONTACTLESS PAYMENT MARKET, BY APPLICATION, 2022-2032 ($BILLION)
    TABLE 06. CONTACTLESS PAYMENT MARKET FOR FOOD AND GROCERIES, BY REGION, 2022-2032 ($BILLION)
    TABLE 07. CONTACTLESS PAYMENT MARKET FOR PHARMACY AND DRUG STORES, BY REGION, 2022-2032 ($BILLION)
    TABLE 08. CONTACTLESS PAYMENT MARKET FOR RESTAURANTS AND BARS, BY REGION, 2022-2032 ($BILLION)
    TABLE 09. CONTACTLESS PAYMENT MARKET FOR CONSUMER ELECTRONICS, BY REGION, 2022-2032 ($BILLION)
    TABLE 10. CONTACTLESS PAYMENT MARKET FOR MEDIA AND ENTERTAINMENT, BY REGION, 2022-2032 ($BILLION)
    TABLE 11. CONTACTLESS PAYMENT MARKET FOR OTHERS, BY REGION, 2022-2032 ($BILLION)
    TABLE 12. CONTACTLESS PAYMENT MARKET, BY REGION, 2022-2032 ($BILLION)
    TABLE 13. NORTH AMERICA CONTACTLESS PAYMENT MARKET, BY DEVICE TYPE, 2022-2032 ($BILLION)
    TABLE 14. NORTH AMERICA CONTACTLESS PAYMENT MARKET, BY APPLICATION, 2022-2032 ($BILLION)
    TABLE 15. NORTH AMERICA CONTACTLESS PAYMENT MARKET, BY COUNTRY, 2022-2032 ($BILLION)
    TABLE 16. U.S. CONTACTLESS PAYMENT MARKET, BY DEVICE TYPE, 2022-2032 ($BILLION)
    TABLE 17. U.S. CONTACTLESS PAYMENT MARKET, BY APPLICATION, 2022-2032 ($BILLION)
    TABLE 18. CANADA CONTACTLESS PAYMENT MARKET, BY DEVICE TYPE, 2022-2032 ($BILLION)
    TABLE 19. CANADA CONTACTLESS PAYMENT MARKET, BY APPLICATION, 2022-2032 ($BILLION)
    TABLE 20. EUROPE CONTACTLESS PAYMENT MARKET, BY DEVICE TYPE, 2022-2032 ($BILLION)
    TABLE 21. EUROPE CONTACTLESS PAYMENT MARKET, BY APPLICATION, 2022-2032 ($BILLION)
    TABLE 22. EUROPE CONTACTLESS PAYMENT MARKET, BY COUNTRY, 2022-2032 ($BILLION)
    TABLE 23. UK CONTACTLESS PAYMENT MARKET, BY DEVICE TYPE, 2022-2032 ($BILLION)
    TABLE 24. UK CONTACTLESS PAYMENT MARKET, BY APPLICATION, 2022-2032 ($BILLION)
    TABLE 25. GERMANY CONTACTLESS PAYMENT MARKET, BY DEVICE TYPE, 2022-2032 ($BILLION)
    TABLE 26. GERMANY CONTACTLESS PAYMENT MARKET, BY APPLICATION, 2022-2032 ($BILLION)
    TABLE 27. FRANCE CONTACTLESS PAYMENT MARKET, BY DEVICE TYPE, 2022-2032 ($BILLION)
    TABLE 28. FRANCE CONTACTLESS PAYMENT MARKET, BY APPLICATION, 2022-2032 ($BILLION)
    TABLE 29. ITALY CONTACTLESS PAYMENT MARKET, BY DEVICE TYPE, 2022-2032 ($BILLION)
    TABLE 30. ITALY CONTACTLESS PAYMENT MARKET, BY APPLICATION, 2022-2032 ($BILLION)
    TABLE 31. SPAIN CONTACTLESS PAYMENT MARKET, BY DEVICE TYPE, 2022-2032 ($BILLION)
    TABLE 32. SPAIN CONTACTLESS PAYMENT MARKET, BY APPLICATION, 2022-2032 ($BILLION)
    TABLE 33. REST OF EUROPE CONTACTLESS PAYMENT MARKET, BY DEVICE TYPE, 2022-2032 ($BILLION)
    TABLE 34. REST OF EUROPE CONTACTLESS PAYMENT MARKET, BY APPLICATION, 2022-2032 ($BILLION)
    TABLE 35. ASIA-PACIFIC CONTACTLESS PAYMENT MARKET, BY DEVICE TYPE, 2022-2032 ($BILLION)
    TABLE 36. ASIA-PACIFIC CONTACTLESS PAYMENT MARKET, BY APPLICATION, 2022-2032 ($BILLION)
    TABLE 37. ASIA-PACIFIC CONTACTLESS PAYMENT MARKET, BY COUNTRY, 2022-2032 ($BILLION)
    TABLE 38. CHINA CONTACTLESS PAYMENT MARKET, BY DEVICE TYPE, 2022-2032 ($BILLION)
    TABLE 39. CHINA CONTACTLESS PAYMENT MARKET, BY APPLICATION, 2022-2032 ($BILLION)
    TABLE 40. JAPAN CONTACTLESS PAYMENT MARKET, BY DEVICE TYPE, 2022-2032 ($BILLION)
    TABLE 41. JAPAN CONTACTLESS PAYMENT MARKET, BY APPLICATION, 2022-2032 ($BILLION)
    TABLE 42. INDIA CONTACTLESS PAYMENT MARKET, BY DEVICE TYPE, 2022-2032 ($BILLION)
    TABLE 43. INDIA CONTACTLESS PAYMENT MARKET, BY APPLICATION, 2022-2032 ($BILLION)
    TABLE 44. AUSTRALIA CONTACTLESS PAYMENT MARKET, BY DEVICE TYPE, 2022-2032 ($BILLION)
    TABLE 45. AUSTRALIA CONTACTLESS PAYMENT MARKET, BY APPLICATION, 2022-2032 ($BILLION)
    TABLE 46. SOUTH KOREA CONTACTLESS PAYMENT MARKET, BY DEVICE TYPE, 2022-2032 ($BILLION)
    TABLE 47. SOUTH KOREA CONTACTLESS PAYMENT MARKET, BY APPLICATION, 2022-2032 ($BILLION)
    TABLE 48. REST OF ASIA-PACIFIC CONTACTLESS PAYMENT MARKET, BY DEVICE TYPE, 2022-2032 ($BILLION)
    TABLE 49. REST OF ASIA-PACIFIC CONTACTLESS PAYMENT MARKET, BY APPLICATION, 2022-2032 ($BILLION)
    TABLE 50. LAMEA CONTACTLESS PAYMENT MARKET, BY DEVICE TYPE, 2022-2032 ($BILLION)
    TABLE 51. LAMEA CONTACTLESS PAYMENT MARKET, BY APPLICATION, 2022-2032 ($BILLION)
    TABLE 52. LAMEA CONTACTLESS PAYMENT MARKET, BY COUNTRY, 2022-2032 ($BILLION)
    TABLE 53. LATIN AMERICA CONTACTLESS PAYMENT MARKET, BY DEVICE TYPE, 2022-2032 ($BILLION)
    TABLE 54. LATIN AMERICA CONTACTLESS PAYMENT MARKET, BY APPLICATION, 2022-2032 ($BILLION)
    TABLE 55. MIDDLE EAST CONTACTLESS PAYMENT MARKET, BY DEVICE TYPE, 2022-2032 ($BILLION)
    TABLE 56. MIDDLE EAST CONTACTLESS PAYMENT MARKET, BY APPLICATION, 2022-2032 ($BILLION)
    TABLE 57. AFRICA CONTACTLESS PAYMENT MARKET, BY DEVICE TYPE, 2022-2032 ($BILLION)
    TABLE 58. AFRICA CONTACTLESS PAYMENT MARKET, BY APPLICATION, 2022-2032 ($BILLION)
    TABLE 59. VISA INC.: KEY EXECUTIVES
    TABLE 60. VISA INC.: COMPANY SNAPSHOT
    TABLE 61. VISA INC.: SERVICE SEGMENTS
    TABLE 62. VISA INC.: PRODUCT PORTFOLIO
    TABLE 63. VISA INC.: KEY STRATERGIES
    TABLE 64. AMERICAN EXPRESS COMPANY: KEY EXECUTIVES
    TABLE 65. AMERICAN EXPRESS COMPANY: COMPANY SNAPSHOT
    TABLE 66. AMERICAN EXPRESS COMPANY: SERVICE SEGMENTS
    TABLE 67. AMERICAN EXPRESS COMPANY: PRODUCT PORTFOLIO
    TABLE 68. AMERICAN EXPRESS COMPANY: KEY STRATERGIES
    TABLE 69. PAYPAL, INC.: KEY EXECUTIVES
    TABLE 70. PAYPAL, INC.: COMPANY SNAPSHOT
    TABLE 71. PAYPAL, INC.: SERVICE SEGMENTS
    TABLE 72. PAYPAL, INC.: PRODUCT PORTFOLIO
    TABLE 73. PAYPAL, INC.: KEY STRATERGIES
    TABLE 74. APPLE INC.: KEY EXECUTIVES
    TABLE 75. APPLE INC.: COMPANY SNAPSHOT
    TABLE 76. APPLE INC.: SERVICE SEGMENTS
    TABLE 77. APPLE INC.: PRODUCT PORTFOLIO
    TABLE 78. APPLE INC.: KEY STRATERGIES
    TABLE 79. MASTERCARD: KEY EXECUTIVES
    TABLE 80. MASTERCARD: COMPANY SNAPSHOT
    TABLE 81. MASTERCARD: SERVICE SEGMENTS
    TABLE 82. MASTERCARD: PRODUCT PORTFOLIO
    TABLE 83. MASTERCARD: KEY STRATERGIES
    TABLE 84. AMAZON.COM, INC.: KEY EXECUTIVES
    TABLE 85. AMAZON.COM, INC.: COMPANY SNAPSHOT
    TABLE 86. AMAZON.COM, INC.: SERVICE SEGMENTS
    TABLE 87. AMAZON.COM, INC.: PRODUCT PORTFOLIO
    TABLE 88. AMAZON.COM, INC.: KEY STRATERGIES
    TABLE 89. SQUARE, INC.: KEY EXECUTIVES
    TABLE 90. SQUARE, INC.: COMPANY SNAPSHOT
    TABLE 91. SQUARE, INC.: SERVICE SEGMENTS
    TABLE 92. SQUARE, INC.: PRODUCT PORTFOLIO
    TABLE 93. SQUARE, INC.: KEY STRATERGIES
    TABLE 94. INGENICO: KEY EXECUTIVES
    TABLE 95. INGENICO: COMPANY SNAPSHOT
    TABLE 96. INGENICO: SERVICE SEGMENTS
    TABLE 97. INGENICO: PRODUCT PORTFOLIO
    TABLE 98. VERIFONE, INC.: KEY EXECUTIVES
    TABLE 99. VERIFONE, INC.: COMPANY SNAPSHOT
    TABLE 100. VERIFONE, INC.: SERVICE SEGMENTS
    TABLE 101. VERIFONE, INC.: PRODUCT PORTFOLIO
    TABLE 102. VERIFONE, INC.: KEY STRATERGIES
    TABLE 103. THALES: KEY EXECUTIVES
    TABLE 104. THALES: COMPANY SNAPSHOT
    TABLE 105. THALES: PRODUCT SEGMENTS
    TABLE 106. THALES: PRODUCT PORTFOLIO
    TABLE 107. THALES: KEY STRATERGIES
  • LIST OF FIGURES

  • FIGURE 01. CONTACTLESS PAYMENT MARKET, 2022-2032
    FIGURE 02. SEGMENTATION OF CONTACTLESS PAYMENT MARKET,2022-2032
    FIGURE 03. TOP INVESTMENT POCKETS IN CONTACTLESS PAYMENT MARKET (2023-2032)
    FIGURE 04. LOW BARGAINING POWER OF SUPPLIERS
    FIGURE 05. LOW THREAT OF NEW ENTRANTS
    FIGURE 06. LOW THREAT OF SUBSTITUTES
    FIGURE 07. LOW INTENSITY OF RIVALRY
    FIGURE 08. LOW BARGAINING POWER OF BUYERS
    FIGURE 09. GLOBAL CONTACTLESS PAYMENT MARKET:DRIVERS, RESTRAINTS AND OPPORTUNITIES
    FIGURE 10. CONTACTLESS PAYMENT MARKET, BY DEVICE TYPE, 2022(%)
    FIGURE 11. COMPARATIVE SHARE ANALYSIS OF CONTACTLESS PAYMENT MARKET FOR SMARTPHONES AND WEARABLES, BY COUNTRY 2022 AND 2032(%)
    FIGURE 12. COMPARATIVE SHARE ANALYSIS OF CONTACTLESS PAYMENT MARKET FOR SMART CARDS, BY COUNTRY 2022 AND 2032(%)
    FIGURE 13. COMPARATIVE SHARE ANALYSIS OF CONTACTLESS PAYMENT MARKET FOR POS TERMINALS, BY COUNTRY 2022 AND 2032(%)
    FIGURE 14. CONTACTLESS PAYMENT MARKET, BY APPLICATION, 2022(%)
    FIGURE 15. COMPARATIVE SHARE ANALYSIS OF CONTACTLESS PAYMENT MARKET FOR FOOD AND GROCERIES, BY COUNTRY 2022 AND 2032(%)
    FIGURE 16. COMPARATIVE SHARE ANALYSIS OF CONTACTLESS PAYMENT MARKET FOR PHARMACY AND DRUG STORES, BY COUNTRY 2022 AND 2032(%)
    FIGURE 17. COMPARATIVE SHARE ANALYSIS OF CONTACTLESS PAYMENT MARKET FOR RESTAURANTS AND BARS, BY COUNTRY 2022 AND 2032(%)
    FIGURE 18. COMPARATIVE SHARE ANALYSIS OF CONTACTLESS PAYMENT MARKET FOR CONSUMER ELECTRONICS, BY COUNTRY 2022 AND 2032(%)
    FIGURE 19. COMPARATIVE SHARE ANALYSIS OF CONTACTLESS PAYMENT MARKET FOR MEDIA AND ENTERTAINMENT, BY COUNTRY 2022 AND 2032(%)
    FIGURE 20. COMPARATIVE SHARE ANALYSIS OF CONTACTLESS PAYMENT MARKET FOR OTHERS, BY COUNTRY 2022 AND 2032(%)
    FIGURE 21. CONTACTLESS PAYMENT MARKET BY REGION, 2022(%)
    FIGURE 22. U.S. CONTACTLESS PAYMENT MARKET, 2022-2032 ($BILLION)
    FIGURE 23. CANADA CONTACTLESS PAYMENT MARKET, 2022-2032 ($BILLION)
    FIGURE 24. UK CONTACTLESS PAYMENT MARKET, 2022-2032 ($BILLION)
    FIGURE 25. GERMANY CONTACTLESS PAYMENT MARKET, 2022-2032 ($BILLION)
    FIGURE 26. FRANCE CONTACTLESS PAYMENT MARKET, 2022-2032 ($BILLION)
    FIGURE 27. ITALY CONTACTLESS PAYMENT MARKET, 2022-2032 ($BILLION)
    FIGURE 28. SPAIN CONTACTLESS PAYMENT MARKET, 2022-2032 ($BILLION)
    FIGURE 29. REST OF EUROPE CONTACTLESS PAYMENT MARKET, 2022-2032 ($BILLION)
    FIGURE 30. CHINA CONTACTLESS PAYMENT MARKET, 2022-2032 ($BILLION)
    FIGURE 31. JAPAN CONTACTLESS PAYMENT MARKET, 2022-2032 ($BILLION)
    FIGURE 32. INDIA CONTACTLESS PAYMENT MARKET, 2022-2032 ($BILLION)
    FIGURE 33. AUSTRALIA CONTACTLESS PAYMENT MARKET, 2022-2032 ($BILLION)
    FIGURE 34. SOUTH KOREA CONTACTLESS PAYMENT MARKET, 2022-2032 ($BILLION)
    FIGURE 35. REST OF ASIA-PACIFIC CONTACTLESS PAYMENT MARKET, 2022-2032 ($BILLION)
    FIGURE 36. LATIN AMERICA CONTACTLESS PAYMENT MARKET, 2022-2032 ($BILLION)
    FIGURE 37. MIDDLE EAST CONTACTLESS PAYMENT MARKET, 2022-2032 ($BILLION)
    FIGURE 38. AFRICA CONTACTLESS PAYMENT MARKET, 2022-2032 ($BILLION)
    FIGURE 39. TOP WINNING STRATEGIES, BY YEAR (2020-2023)
    FIGURE 40. TOP WINNING STRATEGIES, BY DEVELOPMENT (2020-2023)
    FIGURE 41. TOP WINNING STRATEGIES, BY COMPANY (2020-2023)
    FIGURE 42. PRODUCT MAPPING OF TOP 10 PLAYERS
    FIGURE 43. COMPETITIVE DASHBOARD
    FIGURE 44. COMPETITIVE HEATMAP: CONTACTLESS PAYMENT MARKET
    FIGURE 45. TOP PLAYER POSITIONING, 2022
    FIGURE 46. VISA INC.: NET REVENUE, 2020-2022 ($MILLION)
    FIGURE 47. VISA INC.: REVENUE SHARE BY SEGMENT, 2022 (%)
    FIGURE 48. VISA INC.: REVENUE SHARE BY REGION, 2022 (%)
    FIGURE 49. AMERICAN EXPRESS COMPANY: NET REVENUE, 2020-2022 ($MILLION)
    FIGURE 50. AMERICAN EXPRESS COMPANY: REVENUE SHARE BY SEGMENT, 2022 (%)
    FIGURE 51. AMERICAN EXPRESS COMPANY: REVENUE SHARE BY REGION, 2021 (%)
    FIGURE 52. PAYPAL, INC.: NET REVENUE, 2020-2022 ($MILLION)
    FIGURE 53. PAYPAL, INC.: REVENUE SHARE BY REGION, 2022 (%)
    FIGURE 54. APPLE INC.: NET REVENUE, 2020-2022 ($MILLION)
    FIGURE 55. APPLE INC.: REVENUE SHARE BY SEGMENT, 2022 (%)
    FIGURE 56. APPLE INC.: REVENUE SHARE BY REGION, 2022 (%)
    FIGURE 57. MASTERCARD: NET REVENUE, 2020-2022 ($MILLION)
    FIGURE 58. MASTERCARD: REVENUE SHARE BY SEGMENT, 2022 (%)
    FIGURE 59. MASTERCARD: REVENUE SHARE BY REGION, 2022 (%)
    FIGURE 60. AMAZON.COM, INC.: NET SALES, 2020-2022 ($MILLION)
    FIGURE 61. AMAZON.COM, INC.: REVENUE SHARE BY SEGMENT, 2022 (%)
    FIGURE 62. AMAZON.COM, INC.: REVENUE SHARE BY REGION, 2022 (%)
    FIGURE 63. SQUARE, INC.: NET REVENUE, 2020-2022 ($MILLION)
    FIGURE 64. SQUARE, INC.: REVENUE SHARE BY SEGMENT, 2022 (%)
    FIGURE 65. SQUARE, INC.: REVENUE SHARE BY REGION, 2022 (%)
    FIGURE 66. INGENICO: NET REVENUE, 2020-2022 ($MILLION)
    FIGURE 67. INGENICO: REVENUE SHARE BY SEGMENT, 2022 (%)
    FIGURE 68. THALES: RESEARCH & DEVELOPMENT EXPENDITURE, 2020-2022 ($MILLION)
    FIGURE 69. THALES: NET REVENUE, 2020-2022 ($MILLION)
    FIGURE 70. THALES: REVENUE SHARE BY SEGMENT, 2022 (%)
    FIGURE 71. THALES: REVENUE SHARE BY SEGMENT, 2022 (%)


Contactless cards or devices consist a chip that contains the user account information and an antenna. Contactless payments are established through these devices in close proximity to the terminal that also helps in getting rid of hacking or unauthorized access of financial information. Increased need for cashless payments and penetration of smartphones in the developed and the developing countries boost the adoption of contactless payments. In the past few years, the adoption of contactless payments has increased due to improved living standards and rapid growth rate of the retail industry. Contactless payments involve NFC technology, which allows users to establish transactions through mobile phones for numerous purposes such as easy payment, ticketing, healthcare updates, and information sharing with the help of several apps.

The widespread demand for e-commerce, and mobile banking services has influenced the contactless payments market growth. However, the cost of initial installations is higher than the traditional technologies that limits the market growth.

Innovations in the global contactless payments market such as payment through a ring or through facial recognition have boosted the overall market growth. Europe accounted for the maximum share in the market in 2016, owing to technological advancements and increase in use of contactless smart cards. Furthermore, Asia-Pacific is anticipated to witness the highest growth rate during the forecast period due to the rise in a number of NFC-enabled smart phones in countries such as China, Japan, and India.

The key players profiled in the report include Ingenico Group, Verifone Systems, Inc., Inside Secure, on Track Innovations, Oberthur Technologies SA, Proxama, PLC., Wirecard AG, Giesecke & Devrient GmbH, Gemalto N.V., and Heartland Payment Systems, Inc. The market players have introduced innovative NFC-enabled devices and collaborated with other companies to increase their product offerings, increase their customer base, and capitalize on the growing demand for this technology.

PURCHASE OPTIONS

Call or Email us

U.S.-Canada Toll-free: +1-800-792-5285
Int'l : +1-503-894-6022
Europe : +44-845-528-1300
Email : help@alliedmarketresearch.com
 
FREQUENTLY ASKED QUESTIONS?

A. At a CAGR of 18.3%, the Contactless Payment Market will expand from 2023 - 2032.

A. By the end of 2032, the market value of the Contactless Payment Market will be $12,476.6 billion.

A. Surge in demand for mobile & wearable payment devices, rise in adoption of contactless payments among merchants, and adoption of NFC card payments drive the contactless payment market growth.

A. The contactless payment market is segmented on the basis of device type, application, and region. By device type, the market is divided into smartphones and wearables, smart cards, and point-of-sale (POS) terminals. By application, it is segmented into food and groceries, pharmacy and drug stores, restaurants and bars, consumer electronics, media and entertainment, and others. Region wise, the market is analyzed across North America, Europe, Asia-Pacific, and LAMEA.

A. The key players operating in the contactless payment market include Visa Inc., American Express Company, PayPal, Inc., Apple Inc., Mastercard, Amazon.com, Inc., Square, Inc., Ingenico, VeriFone, Inc., and Thales.

Looking for Customization?

 Customization Request

Have a Question?

 Speak with Analyst

Any Confusion?

 Inquire Before Buying

Have a glance of the Report

  Request Sample
RELATED TAGS

Purchase Full Report of
Contactless Payment Market

Start reading instantly.
This Report and over 66,983+ more Reports, Available with Avenue Library. T&C*.

  • Online Only
  • $3,570
  • Online cloud access only
  • Restricted print, copy, paste & download
  • Read only
  • Free industry update
    (Within 180 days)
  • Free report update in next update cycle
    (Aug 2024 - Aug 2025)
  • Data Pack
  • $3,840
  • Restricted to one authorized user
  • One print only
  • Available in
    Excel
  • Free industry update
    (Within 180 days)
  •   Free report update in next update cycle
    (Aug 2024 - Aug 2025)
  • Single User
  • $5,730
  • Restricted to one authorized user
  • One print only
  • Available in
    PDF
  • Free industry update
    (Within 180 days)
  •   Free report update in next update cycle
    (Aug 2024 - Aug 2025)
  • Five Users
  • $6,450
  • Limited to five authorized users
  • Print upto five copies
  • Available in
    PDF
  • Free industry update
    (Within 180 days)
  •   Free report update in next update cycle
    (Aug 2024 - Aug 2025)
  • Enterprise
    License/PDF

  • $9,600
  • Unlimited
    within
    company/enterprise
  • Available in Excel & PDF
  • Free industry update
    (Within 180 days)
  •   Free report update in next update cycle
    (Aug 2024 - Aug 2025)
  • Library
    Membership

  • $999 $ 1,175
    Per User/ Per month/ Billed annually
  • Published Content
    E-access
  • Company Profiles
    E-access
  • Newly Added Content Access
  • 10 PDF
    Downloads
  • 5 Excel Data
    Pack Downloads
  • 250 Company Profiles PDF Downloads
  • Buy Now

*Taxes/Fees, if applicable will be added during checkout. All prices in USD

RELATED REPORTS
 

Why Allied Market Research?


Infallible Methodology

To ensure high-level data integrity, accurate analysis, and impeccable forecasts

Analyst Support

For complete satisfaction

Customization

On-demand customization of scope of the report to exactly meet your needs

TARGETED MARKET VIEW

Targeted market view to provide pertinent information and save time of readers

Get fresh content delivered

Get insights on topics that are crucial for your business. Stay abreast of your interest areas.

Get Industry Data Alerts

Why Allied Market Research?

Infallible Methodology

To ensure high-level data integrity, accurate analysis, and impeccable forecasts

Analyst Support

For complete satisfaction

Customization

On-demand customization of scope of the report to exactly meet your needs

TARGETED MARKET VIEW

Targeted market view to provide pertinent information and save time of readers