0
Upcoming Allied Market Research
2023
Continuous Subcutaneous Insulin Infusion Market

Continuous Subcutaneous Insulin Infusion Market: Global Opportunity Analysis and Industry Forecast 2023-2030 Market

Report Code: A08421
Nov 2023 | Pages: NA
Tables: NA
Charts: NA
  • Formats*:

  • pdf

    Single User License, Five User
    License & Enterprise User License

  • xls

    Data Pack Excel License

  • ppt

    It comes with the additional cost
    of $2500.00 contact sales.


COVID-19

Pandemic disrupted the entire world and affected many industries.

Get detailed COVID-19 impact analysis on the Continuous Subcutaneous Insulin Infusion Market

Request Now !

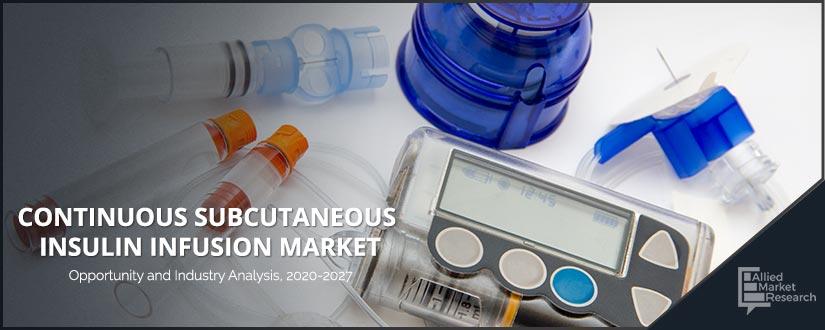
Continuous subcutaneous insulin infusion is very effective for the implementation of management of intensive diabetes to attain a normal level of glucose in the blood and for the betterment of lifestyles. When medical devices or drugs are concerned, people and the staff need to be aware of the disease and the nature of insulin pump therapy. Therefore, need and preparation for the management of the therapies are required. CSII should be implemented, followed, and prescribed by various professionals. There are various factors considered while selecting insulin pumps, which mainly include the durability of the pump, safety, training procedures provided by suppliers, easy usage, and application. Furthermore, insulin pump therapies are followed on a large scale and are generally recommended as they are very safe similar to the multiple-injection therapy.

Continuous-Subcutaneous-Insulin-Infusion

COVID-19 scenario analysis:

  • Pharmaceutical and biotech companies together with governments around the globe are working to address the COVID-19 outbreak, from supporting the development of vaccines to planning for medicines supply chain challenges. Currently, around 115 vaccine candidates and 155 molecules are in the R&D pipeline. Moreover, commonly used drugs, such as hydroxychloroquine, have witnessed a dramatic surge in demand for the management of COVID-19. 
  • Such high demand for these drugs has presented huge opportunities for manufacturers of COVID-19 management drugs as many developed countries are short of these drugs. The pharmaceutical and biotechnology industries are expected to witness a significant growth in the future, owing to the demand for vaccine and treatment drugs for COVID-19.
  • Attributed to such factors, COVID-19 is expected to have a significant impact on the market.

Top impacting factors: Market scenario analysis, trends, drivers and impact analysis

Significant rise in the cases of diabetes patients along with awareness about the same and adoption of continuous subcutaneous insulin infusion (CSII) devices in the field of diabetes care due to its efficiency are the major factors that propel the growth of the continuous subcutaneous insulin infusion market.

Moreover, high expenses and investments in the healthcare sector specifically for diabetic patients and new policies being introduced for reimbursement that benefit the patients are factors that support the growth of the market.

Upgrades in technology, which encompass Internet of Things (IoT) and Artificial Intelligence (AI); and key manufactures working for the betterment of the devices and improving patient care help to drive the market growth. These devices are highly penetrated in the market in several regions. 

Additionally, there have been advances in artificial intelligence and data analytics. These factors also affect the growth of the market positively.

New product launches and acquisitions to boost the market

On July 7th, 2017, Medtronic introduced a new device MiniMed 670G, the first closed-loop system that is hybrid. This introduced and helped in the growth of AI in the field of insulin infusion devices and was beneficial for patients and doctors as well. This new device helped to offer new opportunities for the continuous subcutaneous insulin infusion market. Additionally, on November 13th, 2018, Novo Nordisk India Pvt. Ltd. and Novo Nordisk Education Foundation (NNEF) introduced and ran an awareness program in India. On November 22nd, 2018, Nutrino, a startup in the nutrition data segment was acquired by Medtronic Plc after signing an agreement. On March 18th, 2019, Bigfoot Biomedical introduced its own closed-loop insulin system, which encompasses of Abbott Freestyle Libre glucose monitor.

Surge in usage in hospital applications

Hospitals, homecare, and laboratories are the major consumers of the continuous subcutaneous insulin infusion market. Amongst them, hospitals are the biggest end-users in the market. This is mainly due to the significant rise in hospitals and increase in investments in the hospital sector for the treatment of diabetes.

Furthermore, the home care sector is also increasing at a substantial rate. This is attributed to the rise in acceptance of insulin pumps and awareness of blood glucose level management. Additionally, increase in initiatives and policies by governments to create awareness for devices and the significant rise in patients' count who consume insulin on a daily basis also help in the growth of the market.

Key benefits of the report:

  • This study presents the analytical depiction of the continuous subcutaneous insulin infusion market along with the current trends and future estimations to determine the imminent investment pockets.
  • The report presents information related to key drivers, restraints, and opportunities along with detailed analysis of the continuous subcutaneous insulin infusion market share.
  • The current market is quantitatively analyzed  to highlight the continuous subcutaneous insulin infusion market growth scenario.
  • Porter’s five forces analysis illustrates the potency of buyers & suppliers in the continuous subcutaneous insulin infusion market.
  • The report provides a detailed analysis based on competitive intensity and how the competition will take shape in coming years.

Questions answered in the continuous subcutaneous insulin infusion market research report:

  • Which are the leading market players active in the market?
  • What are the current trends that will influence the market in the next few years?
  • What are the driving factors, restraints, and opportunities of the market?
  • What are the projections for the future that would help in taking further strategic steps?

Continuous Subcutaneous Insulin Infusion Market: Global Opportunity Analysis and Industry Forecast 2020–2027 Report Highlights

Aspects Details
By Product Type
  • Patch Pumps
    • Basal
    • Bolus
    • Basal and Bolus
  • Tethered Pumps
    • Insulin Reservoir and Cartridges
    • Insulin Set Insertion Devices
    • Battery
By Patient Type
  • Type 1
  • Type 2
By End User
  • Hospitals
  • Home Care
  • Laboratories
By Region
  • North America  (US, Canada)
  • Europe  (Germany, UK, France, rest of Europe)
  • Asia-Pacific  (China, Japan, India, rest of Asia-Pacific)
  • Latin America  (Brazil, Mexico, rest of LATAM)
  • the Middle East 
  • Africa 
Key Market Players Tandem Diabetes Care, CeQur, Cellenovo, Medtronic Inc, Insulet Corporation, Valeritas Inc., F Hoffmann-La Roche, Ypsomed, Sooil Development
 
  • CHAPTER 1: INTRODUCTION

    • 1.1. Report Description

    • 1.2. Key Market Segments

    • 1.3. Key Benefits

    • 1.4. Research Methodology

      • 1.4.1. Primary Research

      • 1.4.2. Secondary Research

      • 1.4.3. Analyst Tools and Models

  • CHAPTER 2: EXECUTIVE SUMMARY

    • 2.1. CXO Perspective

  • CHAPTER 3: MARKET LANDSCAPE

    • 3.1. Market Definition and Scope

    • 3.2. Key Findings

      • 3.2.1. Top Investment Pockets

      • 3.2.2. Top Winning Strategies

    • 3.3. Porter's Five Forces Analysis

      • 3.3.1. Bargaining Power of Suppliers

      • 3.3.2. Threat of New Entrants

      • 3.3.3. Threat of Substitutes

      • 3.3.4. Competitive Rivalry

      • 3.3.5. Bargaining Power among Buyers

    • 3.5. Market Dynamics

      • 3.5.1. Drivers

      • 3.5.2. Restraints

      • 3.5.3. Opportunities

    • 3.6. COVID-19 Impact Analysis

  • CHAPTER 4: CONTINUOUS SUBCUTANEOUS INSULIN INFUSION MARKET, BY PRODUCT TYPE

    • 4.1. Market Overview

      • 4.1.1 Market Size and Forecast, By Product Type

    • 4.2. Patch Pumps

      • 4.2.1. Key Market Trends, Growth Factors and Opportunities

      • 4.2.2. Market Size and Forecast, By Region

      • 4.2.3. Market Share Analysis, By Country

      • 4.2.4. Basal

        • 4.2.4.1. Market Size and Forecast
      • 4.2.4. Bolus

        • 4.2.4.1. Market Size and Forecast
      • 4.2.4. Basal and Bolus

        • 4.2.4.1. Market Size and Forecast
    • 4.3. Tethered Pumps

      • 4.3.1. Key Market Trends, Growth Factors and Opportunities

      • 4.3.2. Market Size and Forecast, By Region

      • 4.3.3. Market Share Analysis, By Country

      • 4.3.4. Insulin Reservoir and Cartridges

        • 4.3.4.1. Market Size and Forecast
      • 4.3.4. Insulin Set Insertion Devices

        • 4.3.4.1. Market Size and Forecast
      • 4.3.4. Battery

        • 4.3.4.1. Market Size and Forecast
  • CHAPTER 5: CONTINUOUS SUBCUTANEOUS INSULIN INFUSION MARKET, BY PATIENT TYPE

    • 5.1. Market Overview

      • 5.1.1 Market Size and Forecast, By Patient Type

    • 5.2. Type 1

      • 5.2.1. Key Market Trends, Growth Factors and Opportunities

      • 5.2.2. Market Size and Forecast, By Region

      • 5.2.3. Market Share Analysis, By Country

    • 5.3. Type 2

      • 5.3.1. Key Market Trends, Growth Factors and Opportunities

      • 5.3.2. Market Size and Forecast, By Region

      • 5.3.3. Market Share Analysis, By Country

  • CHAPTER 6: CONTINUOUS SUBCUTANEOUS INSULIN INFUSION MARKET, BY END USER

    • 6.1. Market Overview

      • 6.1.1 Market Size and Forecast, By End User

    • 6.2. Hospitals

      • 6.2.1. Key Market Trends, Growth Factors and Opportunities

      • 6.2.2. Market Size and Forecast, By Region

      • 6.2.3. Market Share Analysis, By Country

    • 6.3. Home Care

      • 6.3.1. Key Market Trends, Growth Factors and Opportunities

      • 6.3.2. Market Size and Forecast, By Region

      • 6.3.3. Market Share Analysis, By Country

    • 6.4. Laboratories

      • 6.4.1. Key Market Trends, Growth Factors and Opportunities

      • 6.4.2. Market Size and Forecast, By Region

      • 6.4.3. Market Share Analysis, By Country

  • CHAPTER 7: CONTINUOUS SUBCUTANEOUS INSULIN INFUSION MARKET, BY REGION

    • 7.1. Market Overview

      • 7.1.1 Market Size and Forecast, By Region

    • 7.2. North America

      • 7.2.1. Key Market Trends and Opportunities

      • 7.2.2. Market Size and Forecast, By Product Type

      • 7.2.3. Market Size and Forecast, By Patient Type

      • 7.2.4. Market Size and Forecast, By End User

      • 7.2.5. Market Size and Forecast, By Country

      • 7.2.6. U.S. Continuous Subcutaneous Insulin Infusion Market

        • 7.2.6.1. Market Size and Forecast, By Product Type
        • 7.2.6.2. Market Size and Forecast, By Patient Type
        • 7.2.6.3. Market Size and Forecast, By End User
      • 7.2.7. Canada Continuous Subcutaneous Insulin Infusion Market

        • 7.2.7.1. Market Size and Forecast, By Product Type
        • 7.2.7.2. Market Size and Forecast, By Patient Type
        • 7.2.7.3. Market Size and Forecast, By End User
      • 7.2.8. Mexico Continuous Subcutaneous Insulin Infusion Market

        • 7.2.8.1. Market Size and Forecast, By Product Type
        • 7.2.8.2. Market Size and Forecast, By Patient Type
        • 7.2.8.3. Market Size and Forecast, By End User
    • 7.3. Europe

      • 7.3.1. Key Market Trends and Opportunities

      • 7.3.2. Market Size and Forecast, By Product Type

      • 7.3.3. Market Size and Forecast, By Patient Type

      • 7.3.4. Market Size and Forecast, By End User

      • 7.3.5. Market Size and Forecast, By Country

      • 7.3.6. France Continuous Subcutaneous Insulin Infusion Market

        • 7.3.6.1. Market Size and Forecast, By Product Type
        • 7.3.6.2. Market Size and Forecast, By Patient Type
        • 7.3.6.3. Market Size and Forecast, By End User
      • 7.3.7. Germany Continuous Subcutaneous Insulin Infusion Market

        • 7.3.7.1. Market Size and Forecast, By Product Type
        • 7.3.7.2. Market Size and Forecast, By Patient Type
        • 7.3.7.3. Market Size and Forecast, By End User
      • 7.3.8. Italy Continuous Subcutaneous Insulin Infusion Market

        • 7.3.8.1. Market Size and Forecast, By Product Type
        • 7.3.8.2. Market Size and Forecast, By Patient Type
        • 7.3.8.3. Market Size and Forecast, By End User
      • 7.3.9. Spain Continuous Subcutaneous Insulin Infusion Market

        • 7.3.9.1. Market Size and Forecast, By Product Type
        • 7.3.9.2. Market Size and Forecast, By Patient Type
        • 7.3.9.3. Market Size and Forecast, By End User
      • 7.3.10. UK Continuous Subcutaneous Insulin Infusion Market

        • 7.3.10.1. Market Size and Forecast, By Product Type
        • 7.3.10.2. Market Size and Forecast, By Patient Type
        • 7.3.10.3. Market Size and Forecast, By End User
      • 7.3.11. Russia Continuous Subcutaneous Insulin Infusion Market

        • 7.3.11.1. Market Size and Forecast, By Product Type
        • 7.3.11.2. Market Size and Forecast, By Patient Type
        • 7.3.11.3. Market Size and Forecast, By End User
      • 7.3.12. Rest Of Europe Continuous Subcutaneous Insulin Infusion Market

        • 7.3.12.1. Market Size and Forecast, By Product Type
        • 7.3.12.2. Market Size and Forecast, By Patient Type
        • 7.3.12.3. Market Size and Forecast, By End User
    • 7.4. Asia-Pacific

      • 7.4.1. Key Market Trends and Opportunities

      • 7.4.2. Market Size and Forecast, By Product Type

      • 7.4.3. Market Size and Forecast, By Patient Type

      • 7.4.4. Market Size and Forecast, By End User

      • 7.4.5. Market Size and Forecast, By Country

      • 7.4.6. China Continuous Subcutaneous Insulin Infusion Market

        • 7.4.6.1. Market Size and Forecast, By Product Type
        • 7.4.6.2. Market Size and Forecast, By Patient Type
        • 7.4.6.3. Market Size and Forecast, By End User
      • 7.4.7. Japan Continuous Subcutaneous Insulin Infusion Market

        • 7.4.7.1. Market Size and Forecast, By Product Type
        • 7.4.7.2. Market Size and Forecast, By Patient Type
        • 7.4.7.3. Market Size and Forecast, By End User
      • 7.4.8. India Continuous Subcutaneous Insulin Infusion Market

        • 7.4.8.1. Market Size and Forecast, By Product Type
        • 7.4.8.2. Market Size and Forecast, By Patient Type
        • 7.4.8.3. Market Size and Forecast, By End User
      • 7.4.9. South Korea Continuous Subcutaneous Insulin Infusion Market

        • 7.4.9.1. Market Size and Forecast, By Product Type
        • 7.4.9.2. Market Size and Forecast, By Patient Type
        • 7.4.9.3. Market Size and Forecast, By End User
      • 7.4.10. Australia Continuous Subcutaneous Insulin Infusion Market

        • 7.4.10.1. Market Size and Forecast, By Product Type
        • 7.4.10.2. Market Size and Forecast, By Patient Type
        • 7.4.10.3. Market Size and Forecast, By End User
      • 7.4.11. Thailand Continuous Subcutaneous Insulin Infusion Market

        • 7.4.11.1. Market Size and Forecast, By Product Type
        • 7.4.11.2. Market Size and Forecast, By Patient Type
        • 7.4.11.3. Market Size and Forecast, By End User
      • 7.4.12. Malaysia Continuous Subcutaneous Insulin Infusion Market

        • 7.4.12.1. Market Size and Forecast, By Product Type
        • 7.4.12.2. Market Size and Forecast, By Patient Type
        • 7.4.12.3. Market Size and Forecast, By End User
      • 7.4.13. Indonesia Continuous Subcutaneous Insulin Infusion Market

        • 7.4.13.1. Market Size and Forecast, By Product Type
        • 7.4.13.2. Market Size and Forecast, By Patient Type
        • 7.4.13.3. Market Size and Forecast, By End User
      • 7.4.14. Rest of Asia Pacific Continuous Subcutaneous Insulin Infusion Market

        • 7.4.14.1. Market Size and Forecast, By Product Type
        • 7.4.14.2. Market Size and Forecast, By Patient Type
        • 7.4.14.3. Market Size and Forecast, By End User
    • 7.5. LAMEA

      • 7.5.1. Key Market Trends and Opportunities

      • 7.5.2. Market Size and Forecast, By Product Type

      • 7.5.3. Market Size and Forecast, By Patient Type

      • 7.5.4. Market Size and Forecast, By End User

      • 7.5.5. Market Size and Forecast, By Country

      • 7.5.6. Brazil Continuous Subcutaneous Insulin Infusion Market

        • 7.5.6.1. Market Size and Forecast, By Product Type
        • 7.5.6.2. Market Size and Forecast, By Patient Type
        • 7.5.6.3. Market Size and Forecast, By End User
      • 7.5.7. South Africa Continuous Subcutaneous Insulin Infusion Market

        • 7.5.7.1. Market Size and Forecast, By Product Type
        • 7.5.7.2. Market Size and Forecast, By Patient Type
        • 7.5.7.3. Market Size and Forecast, By End User
      • 7.5.8. Saudi Arabia Continuous Subcutaneous Insulin Infusion Market

        • 7.5.8.1. Market Size and Forecast, By Product Type
        • 7.5.8.2. Market Size and Forecast, By Patient Type
        • 7.5.8.3. Market Size and Forecast, By End User
      • 7.5.9. UAE Continuous Subcutaneous Insulin Infusion Market

        • 7.5.9.1. Market Size and Forecast, By Product Type
        • 7.5.9.2. Market Size and Forecast, By Patient Type
        • 7.5.9.3. Market Size and Forecast, By End User
      • 7.5.10. Argentina Continuous Subcutaneous Insulin Infusion Market

        • 7.5.10.1. Market Size and Forecast, By Product Type
        • 7.5.10.2. Market Size and Forecast, By Patient Type
        • 7.5.10.3. Market Size and Forecast, By End User
      • 7.5.11. Rest of LAMEA Continuous Subcutaneous Insulin Infusion Market

        • 7.5.11.1. Market Size and Forecast, By Product Type
        • 7.5.11.2. Market Size and Forecast, By Patient Type
        • 7.5.11.3. Market Size and Forecast, By End User
  • CHAPTER 8: COMPETITIVE LANDSCAPE

    • 8.1. Introduction

    • 8.2. Top Winning Strategies

    • 8.3. Product Mapping Of Top 10 Player

    • 8.4. Competitive Dashboard

    • 8.5. Competitive Heatmap

    • 8.6. Top Player Positioning,2022

  • CHAPTER 9: COMPANY PROFILES

    • 9.1. Medtronic Inc

      • 9.1.1. Company Overview

      • 9.1.2. Key Executives

      • 9.1.3. Company Snapshot

      • 9.1.4. Operating Business Segments

      • 9.1.5. Product Portfolio

      • 9.1.6. Business Performance

      • 9.1.7. Key Strategic Moves and Developments

    • 9.2. Tandem Diabetes Care

      • 9.2.1. Company Overview

      • 9.2.2. Key Executives

      • 9.2.3. Company Snapshot

      • 9.2.4. Operating Business Segments

      • 9.2.5. Product Portfolio

      • 9.2.6. Business Performance

      • 9.2.7. Key Strategic Moves and Developments

    • 9.3. CeQur

      • 9.3.1. Company Overview

      • 9.3.2. Key Executives

      • 9.3.3. Company Snapshot

      • 9.3.4. Operating Business Segments

      • 9.3.5. Product Portfolio

      • 9.3.6. Business Performance

      • 9.3.7. Key Strategic Moves and Developments

    • 9.4. F Hoffmann-La Roche

      • 9.4.1. Company Overview

      • 9.4.2. Key Executives

      • 9.4.3. Company Snapshot

      • 9.4.4. Operating Business Segments

      • 9.4.5. Product Portfolio

      • 9.4.6. Business Performance

      • 9.4.7. Key Strategic Moves and Developments

    • 9.5. Insulet Corporation

      • 9.5.1. Company Overview

      • 9.5.2. Key Executives

      • 9.5.3. Company Snapshot

      • 9.5.4. Operating Business Segments

      • 9.5.5. Product Portfolio

      • 9.5.6. Business Performance

      • 9.5.7. Key Strategic Moves and Developments

    • 9.6. Ypsomed

      • 9.6.1. Company Overview

      • 9.6.2. Key Executives

      • 9.6.3. Company Snapshot

      • 9.6.4. Operating Business Segments

      • 9.6.5. Product Portfolio

      • 9.6.6. Business Performance

      • 9.6.7. Key Strategic Moves and Developments

    • 9.7. Sooil Development

      • 9.7.1. Company Overview

      • 9.7.2. Key Executives

      • 9.7.3. Company Snapshot

      • 9.7.4. Operating Business Segments

      • 9.7.5. Product Portfolio

      • 9.7.6. Business Performance

      • 9.7.7. Key Strategic Moves and Developments

    • 9.8. Cellenovo

      • 9.8.1. Company Overview

      • 9.8.2. Key Executives

      • 9.8.3. Company Snapshot

      • 9.8.4. Operating Business Segments

      • 9.8.5. Product Portfolio

      • 9.8.6. Business Performance

      • 9.8.7. Key Strategic Moves and Developments

    • 9.9. Valeritas Inc.

      • 9.9.1. Company Overview

      • 9.9.2. Key Executives

      • 9.9.3. Company Snapshot

      • 9.9.4. Operating Business Segments

      • 9.9.5. Product Portfolio

      • 9.9.6. Business Performance

      • 9.9.7. Key Strategic Moves and Developments

  • LIST OF TABLES

  • TABLE 1. GLOBAL CONTINUOUS SUBCUTANEOUS INSULIN INFUSION MARKET, BY PRODUCT TYPE, 2022-2032 ($MILLION)
  • TABLE 2. GLOBAL CONTINUOUS SUBCUTANEOUS INSULIN INFUSION MARKET FOR PATCH PUMPS, BY REGION, 2022-2032 ($MILLION)
  • TABLE 3. GLOBAL CONTINUOUS SUBCUTANEOUS INSULIN INFUSION MARKET FOR TETHERED PUMPS, BY REGION, 2022-2032 ($MILLION)
  • TABLE 4. GLOBAL CONTINUOUS SUBCUTANEOUS INSULIN INFUSION MARKET, BY PATIENT TYPE, 2022-2032 ($MILLION)
  • TABLE 5. GLOBAL CONTINUOUS SUBCUTANEOUS INSULIN INFUSION MARKET FOR TYPE 1, BY REGION, 2022-2032 ($MILLION)
  • TABLE 6. GLOBAL CONTINUOUS SUBCUTANEOUS INSULIN INFUSION MARKET FOR TYPE 2, BY REGION, 2022-2032 ($MILLION)
  • TABLE 7. GLOBAL CONTINUOUS SUBCUTANEOUS INSULIN INFUSION MARKET, BY END USER, 2022-2032 ($MILLION)
  • TABLE 8. GLOBAL CONTINUOUS SUBCUTANEOUS INSULIN INFUSION MARKET FOR HOSPITALS, BY REGION, 2022-2032 ($MILLION)
  • TABLE 9. GLOBAL CONTINUOUS SUBCUTANEOUS INSULIN INFUSION MARKET FOR HOME CARE, BY REGION, 2022-2032 ($MILLION)
  • TABLE 10. GLOBAL CONTINUOUS SUBCUTANEOUS INSULIN INFUSION MARKET FOR LABORATORIES, BY REGION, 2022-2032 ($MILLION)
  • TABLE 11. GLOBAL CONTINUOUS SUBCUTANEOUS INSULIN INFUSION MARKET, BY REGION, 2022-2032 ($MILLION)
  • TABLE 12. NORTH AMERICA CONTINUOUS SUBCUTANEOUS INSULIN INFUSION, BY REGION, 2022-2032 ($MILLION)
  • TABLE 13. NORTH AMERICA CONTINUOUS SUBCUTANEOUS INSULIN INFUSION, BY PRODUCT TYPE, 2022-2032 ($MILLION)
  • TABLE 14. NORTH AMERICA CONTINUOUS SUBCUTANEOUS INSULIN INFUSION, BY PATIENT TYPE, 2022-2032 ($MILLION)
  • TABLE 15. NORTH AMERICA CONTINUOUS SUBCUTANEOUS INSULIN INFUSION, BY END USER, 2022-2032 ($MILLION)
  • TABLE 16. U.S. CONTINUOUS SUBCUTANEOUS INSULIN INFUSION, BY PRODUCT TYPE, 2022-2032 ($MILLION)
  • TABLE 17. U.S. CONTINUOUS SUBCUTANEOUS INSULIN INFUSION, BY PATIENT TYPE, 2022-2032 ($MILLION)
  • TABLE 18. U.S. CONTINUOUS SUBCUTANEOUS INSULIN INFUSION, BY END USER, 2022-2032 ($MILLION)
  • TABLE 19. CANADA CONTINUOUS SUBCUTANEOUS INSULIN INFUSION, BY PRODUCT TYPE, 2022-2032 ($MILLION)
  • TABLE 20. CANADA CONTINUOUS SUBCUTANEOUS INSULIN INFUSION, BY PATIENT TYPE, 2022-2032 ($MILLION)
  • TABLE 21. CANADA CONTINUOUS SUBCUTANEOUS INSULIN INFUSION, BY END USER, 2022-2032 ($MILLION)
  • TABLE 22. MEXICO CONTINUOUS SUBCUTANEOUS INSULIN INFUSION, BY PRODUCT TYPE, 2022-2032 ($MILLION)
  • TABLE 23. MEXICO CONTINUOUS SUBCUTANEOUS INSULIN INFUSION, BY PATIENT TYPE, 2022-2032 ($MILLION)
  • TABLE 24. MEXICO CONTINUOUS SUBCUTANEOUS INSULIN INFUSION, BY END USER, 2022-2032 ($MILLION)
  • TABLE 25. EUROPE CONTINUOUS SUBCUTANEOUS INSULIN INFUSION, BY REGION, 2022-2032 ($MILLION)
  • TABLE 26. EUROPE CONTINUOUS SUBCUTANEOUS INSULIN INFUSION, BY PRODUCT TYPE, 2022-2032 ($MILLION)
  • TABLE 27. EUROPE CONTINUOUS SUBCUTANEOUS INSULIN INFUSION, BY PATIENT TYPE, 2022-2032 ($MILLION)
  • TABLE 28. EUROPE CONTINUOUS SUBCUTANEOUS INSULIN INFUSION, BY END USER, 2022-2032 ($MILLION)
  • TABLE 29. FRANCE CONTINUOUS SUBCUTANEOUS INSULIN INFUSION, BY PRODUCT TYPE, 2022-2032 ($MILLION)
  • TABLE 30. FRANCE CONTINUOUS SUBCUTANEOUS INSULIN INFUSION, BY PATIENT TYPE, 2022-2032 ($MILLION)
  • TABLE 31. FRANCE CONTINUOUS SUBCUTANEOUS INSULIN INFUSION, BY END USER, 2022-2032 ($MILLION)
  • TABLE 32. GERMANY CONTINUOUS SUBCUTANEOUS INSULIN INFUSION, BY PRODUCT TYPE, 2022-2032 ($MILLION)
  • TABLE 33. GERMANY CONTINUOUS SUBCUTANEOUS INSULIN INFUSION, BY PATIENT TYPE, 2022-2032 ($MILLION)
  • TABLE 34. GERMANY CONTINUOUS SUBCUTANEOUS INSULIN INFUSION, BY END USER, 2022-2032 ($MILLION)
  • TABLE 35. ITALY CONTINUOUS SUBCUTANEOUS INSULIN INFUSION, BY PRODUCT TYPE, 2022-2032 ($MILLION)
  • TABLE 36. ITALY CONTINUOUS SUBCUTANEOUS INSULIN INFUSION, BY PATIENT TYPE, 2022-2032 ($MILLION)
  • TABLE 37. ITALY CONTINUOUS SUBCUTANEOUS INSULIN INFUSION, BY END USER, 2022-2032 ($MILLION)
  • TABLE 38. SPAIN CONTINUOUS SUBCUTANEOUS INSULIN INFUSION, BY PRODUCT TYPE, 2022-2032 ($MILLION)
  • TABLE 39. SPAIN CONTINUOUS SUBCUTANEOUS INSULIN INFUSION, BY PATIENT TYPE, 2022-2032 ($MILLION)
  • TABLE 40. SPAIN CONTINUOUS SUBCUTANEOUS INSULIN INFUSION, BY END USER, 2022-2032 ($MILLION)
  • TABLE 41. UK CONTINUOUS SUBCUTANEOUS INSULIN INFUSION, BY PRODUCT TYPE, 2022-2032 ($MILLION)
  • TABLE 42. UK CONTINUOUS SUBCUTANEOUS INSULIN INFUSION, BY PATIENT TYPE, 2022-2032 ($MILLION)
  • TABLE 43. UK CONTINUOUS SUBCUTANEOUS INSULIN INFUSION, BY END USER, 2022-2032 ($MILLION)
  • TABLE 44. RUSSIA CONTINUOUS SUBCUTANEOUS INSULIN INFUSION, BY PRODUCT TYPE, 2022-2032 ($MILLION)
  • TABLE 45. RUSSIA CONTINUOUS SUBCUTANEOUS INSULIN INFUSION, BY PATIENT TYPE, 2022-2032 ($MILLION)
  • TABLE 46. RUSSIA CONTINUOUS SUBCUTANEOUS INSULIN INFUSION, BY END USER, 2022-2032 ($MILLION)
  • TABLE 47. REST OF EUROPE CONTINUOUS SUBCUTANEOUS INSULIN INFUSION, BY PRODUCT TYPE, 2022-2032 ($MILLION)
  • TABLE 48. REST OF EUROPE CONTINUOUS SUBCUTANEOUS INSULIN INFUSION, BY PATIENT TYPE, 2022-2032 ($MILLION)
  • TABLE 49. REST OF EUROPE CONTINUOUS SUBCUTANEOUS INSULIN INFUSION, BY END USER, 2022-2032 ($MILLION)
  • TABLE 50. ASIA-PACIFIC CONTINUOUS SUBCUTANEOUS INSULIN INFUSION, BY REGION, 2022-2032 ($MILLION)
  • TABLE 51. ASIA-PACIFIC CONTINUOUS SUBCUTANEOUS INSULIN INFUSION, BY PRODUCT TYPE, 2022-2032 ($MILLION)
  • TABLE 52. ASIA-PACIFIC CONTINUOUS SUBCUTANEOUS INSULIN INFUSION, BY PATIENT TYPE, 2022-2032 ($MILLION)
  • TABLE 53. ASIA-PACIFIC CONTINUOUS SUBCUTANEOUS INSULIN INFUSION, BY END USER, 2022-2032 ($MILLION)
  • TABLE 54. CHINA CONTINUOUS SUBCUTANEOUS INSULIN INFUSION, BY PRODUCT TYPE, 2022-2032 ($MILLION)
  • TABLE 55. CHINA CONTINUOUS SUBCUTANEOUS INSULIN INFUSION, BY PATIENT TYPE, 2022-2032 ($MILLION)
  • TABLE 56. CHINA CONTINUOUS SUBCUTANEOUS INSULIN INFUSION, BY END USER, 2022-2032 ($MILLION)
  • TABLE 57. JAPAN CONTINUOUS SUBCUTANEOUS INSULIN INFUSION, BY PRODUCT TYPE, 2022-2032 ($MILLION)
  • TABLE 58. JAPAN CONTINUOUS SUBCUTANEOUS INSULIN INFUSION, BY PATIENT TYPE, 2022-2032 ($MILLION)
  • TABLE 59. JAPAN CONTINUOUS SUBCUTANEOUS INSULIN INFUSION, BY END USER, 2022-2032 ($MILLION)
  • TABLE 60. INDIA CONTINUOUS SUBCUTANEOUS INSULIN INFUSION, BY PRODUCT TYPE, 2022-2032 ($MILLION)
  • TABLE 61. INDIA CONTINUOUS SUBCUTANEOUS INSULIN INFUSION, BY PATIENT TYPE, 2022-2032 ($MILLION)
  • TABLE 62. INDIA CONTINUOUS SUBCUTANEOUS INSULIN INFUSION, BY END USER, 2022-2032 ($MILLION)
  • TABLE 63. SOUTH KOREA CONTINUOUS SUBCUTANEOUS INSULIN INFUSION, BY PRODUCT TYPE, 2022-2032 ($MILLION)
  • TABLE 64. SOUTH KOREA CONTINUOUS SUBCUTANEOUS INSULIN INFUSION, BY PATIENT TYPE, 2022-2032 ($MILLION)
  • TABLE 65. SOUTH KOREA CONTINUOUS SUBCUTANEOUS INSULIN INFUSION, BY END USER, 2022-2032 ($MILLION)
  • TABLE 66. AUSTRALIA CONTINUOUS SUBCUTANEOUS INSULIN INFUSION, BY PRODUCT TYPE, 2022-2032 ($MILLION)
  • TABLE 67. AUSTRALIA CONTINUOUS SUBCUTANEOUS INSULIN INFUSION, BY PATIENT TYPE, 2022-2032 ($MILLION)
  • TABLE 68. AUSTRALIA CONTINUOUS SUBCUTANEOUS INSULIN INFUSION, BY END USER, 2022-2032 ($MILLION)
  • TABLE 69. THAILAND CONTINUOUS SUBCUTANEOUS INSULIN INFUSION, BY PRODUCT TYPE, 2022-2032 ($MILLION)
  • TABLE 70. THAILAND CONTINUOUS SUBCUTANEOUS INSULIN INFUSION, BY PATIENT TYPE, 2022-2032 ($MILLION)
  • TABLE 71. THAILAND CONTINUOUS SUBCUTANEOUS INSULIN INFUSION, BY END USER, 2022-2032 ($MILLION)
  • TABLE 72. MALAYSIA CONTINUOUS SUBCUTANEOUS INSULIN INFUSION, BY PRODUCT TYPE, 2022-2032 ($MILLION)
  • TABLE 73. MALAYSIA CONTINUOUS SUBCUTANEOUS INSULIN INFUSION, BY PATIENT TYPE, 2022-2032 ($MILLION)
  • TABLE 74. MALAYSIA CONTINUOUS SUBCUTANEOUS INSULIN INFUSION, BY END USER, 2022-2032 ($MILLION)
  • TABLE 75. INDONESIA CONTINUOUS SUBCUTANEOUS INSULIN INFUSION, BY PRODUCT TYPE, 2022-2032 ($MILLION)
  • TABLE 76. INDONESIA CONTINUOUS SUBCUTANEOUS INSULIN INFUSION, BY PATIENT TYPE, 2022-2032 ($MILLION)
  • TABLE 77. INDONESIA CONTINUOUS SUBCUTANEOUS INSULIN INFUSION, BY END USER, 2022-2032 ($MILLION)
  • TABLE 78. REST OF ASIA PACIFIC CONTINUOUS SUBCUTANEOUS INSULIN INFUSION, BY PRODUCT TYPE, 2022-2032 ($MILLION)
  • TABLE 79. REST OF ASIA PACIFIC CONTINUOUS SUBCUTANEOUS INSULIN INFUSION, BY PATIENT TYPE, 2022-2032 ($MILLION)
  • TABLE 80. REST OF ASIA PACIFIC CONTINUOUS SUBCUTANEOUS INSULIN INFUSION, BY END USER, 2022-2032 ($MILLION)
  • TABLE 81. LAMEA CONTINUOUS SUBCUTANEOUS INSULIN INFUSION, BY REGION, 2022-2032 ($MILLION)
  • TABLE 82. LAMEA CONTINUOUS SUBCUTANEOUS INSULIN INFUSION, BY PRODUCT TYPE, 2022-2032 ($MILLION)
  • TABLE 83. LAMEA CONTINUOUS SUBCUTANEOUS INSULIN INFUSION, BY PATIENT TYPE, 2022-2032 ($MILLION)
  • TABLE 84. LAMEA CONTINUOUS SUBCUTANEOUS INSULIN INFUSION, BY END USER, 2022-2032 ($MILLION)
  • TABLE 85. BRAZIL CONTINUOUS SUBCUTANEOUS INSULIN INFUSION, BY PRODUCT TYPE, 2022-2032 ($MILLION)
  • TABLE 86. BRAZIL CONTINUOUS SUBCUTANEOUS INSULIN INFUSION, BY PATIENT TYPE, 2022-2032 ($MILLION)
  • TABLE 87. BRAZIL CONTINUOUS SUBCUTANEOUS INSULIN INFUSION, BY END USER, 2022-2032 ($MILLION)
  • TABLE 88. SOUTH AFRICA CONTINUOUS SUBCUTANEOUS INSULIN INFUSION, BY PRODUCT TYPE, 2022-2032 ($MILLION)
  • TABLE 89. SOUTH AFRICA CONTINUOUS SUBCUTANEOUS INSULIN INFUSION, BY PATIENT TYPE, 2022-2032 ($MILLION)
  • TABLE 90. SOUTH AFRICA CONTINUOUS SUBCUTANEOUS INSULIN INFUSION, BY END USER, 2022-2032 ($MILLION)
  • TABLE 91. SAUDI ARABIA CONTINUOUS SUBCUTANEOUS INSULIN INFUSION, BY PRODUCT TYPE, 2022-2032 ($MILLION)
  • TABLE 92. SAUDI ARABIA CONTINUOUS SUBCUTANEOUS INSULIN INFUSION, BY PATIENT TYPE, 2022-2032 ($MILLION)
  • TABLE 93. SAUDI ARABIA CONTINUOUS SUBCUTANEOUS INSULIN INFUSION, BY END USER, 2022-2032 ($MILLION)
  • TABLE 94. UAE CONTINUOUS SUBCUTANEOUS INSULIN INFUSION, BY PRODUCT TYPE, 2022-2032 ($MILLION)
  • TABLE 95. UAE CONTINUOUS SUBCUTANEOUS INSULIN INFUSION, BY PATIENT TYPE, 2022-2032 ($MILLION)
  • TABLE 96. UAE CONTINUOUS SUBCUTANEOUS INSULIN INFUSION, BY END USER, 2022-2032 ($MILLION)
  • TABLE 97. ARGENTINA CONTINUOUS SUBCUTANEOUS INSULIN INFUSION, BY PRODUCT TYPE, 2022-2032 ($MILLION)
  • TABLE 98. ARGENTINA CONTINUOUS SUBCUTANEOUS INSULIN INFUSION, BY PATIENT TYPE, 2022-2032 ($MILLION)
  • TABLE 99. ARGENTINA CONTINUOUS SUBCUTANEOUS INSULIN INFUSION, BY END USER, 2022-2032 ($MILLION)
  • TABLE 100. REST OF LAMEA CONTINUOUS SUBCUTANEOUS INSULIN INFUSION, BY PRODUCT TYPE, 2022-2032 ($MILLION)
  • TABLE 101. REST OF LAMEA CONTINUOUS SUBCUTANEOUS INSULIN INFUSION, BY PATIENT TYPE, 2022-2032 ($MILLION)
  • TABLE 102. REST OF LAMEA CONTINUOUS SUBCUTANEOUS INSULIN INFUSION, BY END USER, 2022-2032 ($MILLION)
  • TABLE 103. MEDTRONIC INC: KEY EXECUTIVES
  • TABLE 104. MEDTRONIC INC: COMPANY SNAPSHOT
  • TABLE 105. MEDTRONIC INC: OPERATING SEGMENTS
  • TABLE 106. MEDTRONIC INC: PRODUCT PORTFOLIO
  • TABLE 107. MEDTRONIC INC: KEY STRATEGIC MOVES AND DEVELOPMENTS
  • TABLE 108. TANDEM DIABETES CARE: KEY EXECUTIVES
  • TABLE 109. TANDEM DIABETES CARE: COMPANY SNAPSHOT
  • TABLE 110. TANDEM DIABETES CARE: OPERATING SEGMENTS
  • TABLE 111. TANDEM DIABETES CARE: PRODUCT PORTFOLIO
  • TABLE 112. TANDEM DIABETES CARE: KEY STRATEGIC MOVES AND DEVELOPMENTS
  • TABLE 113. CEQUR: KEY EXECUTIVES
  • TABLE 114. CEQUR: COMPANY SNAPSHOT
  • TABLE 115. CEQUR: OPERATING SEGMENTS
  • TABLE 116. CEQUR: PRODUCT PORTFOLIO
  • TABLE 117. CEQUR: KEY STRATEGIC MOVES AND DEVELOPMENTS
  • TABLE 118. F HOFFMANN-LA ROCHE: KEY EXECUTIVES
  • TABLE 119. F HOFFMANN-LA ROCHE: COMPANY SNAPSHOT
  • TABLE 120. F HOFFMANN-LA ROCHE: OPERATING SEGMENTS
  • TABLE 121. F HOFFMANN-LA ROCHE: PRODUCT PORTFOLIO
  • TABLE 122. F HOFFMANN-LA ROCHE: KEY STRATEGIC MOVES AND DEVELOPMENTS
  • TABLE 123. INSULET CORPORATION: KEY EXECUTIVES
  • TABLE 124. INSULET CORPORATION: COMPANY SNAPSHOT
  • TABLE 125. INSULET CORPORATION: OPERATING SEGMENTS
  • TABLE 126. INSULET CORPORATION: PRODUCT PORTFOLIO
  • TABLE 127. INSULET CORPORATION: KEY STRATEGIC MOVES AND DEVELOPMENTS
  • TABLE 128. YPSOMED: KEY EXECUTIVES
  • TABLE 129. YPSOMED: COMPANY SNAPSHOT
  • TABLE 130. YPSOMED: OPERATING SEGMENTS
  • TABLE 131. YPSOMED: PRODUCT PORTFOLIO
  • TABLE 132. YPSOMED: KEY STRATEGIC MOVES AND DEVELOPMENTS
  • TABLE 133. SOOIL DEVELOPMENT: KEY EXECUTIVES
  • TABLE 134. SOOIL DEVELOPMENT: COMPANY SNAPSHOT
  • TABLE 135. SOOIL DEVELOPMENT: OPERATING SEGMENTS
  • TABLE 136. SOOIL DEVELOPMENT: PRODUCT PORTFOLIO
  • TABLE 137. SOOIL DEVELOPMENT: KEY STRATEGIC MOVES AND DEVELOPMENTS
  • TABLE 138. CELLENOVO: KEY EXECUTIVES
  • TABLE 139. CELLENOVO: COMPANY SNAPSHOT
  • TABLE 140. CELLENOVO: OPERATING SEGMENTS
  • TABLE 141. CELLENOVO: PRODUCT PORTFOLIO
  • TABLE 142. CELLENOVO: KEY STRATEGIC MOVES AND DEVELOPMENTS
  • TABLE 143. VALERITAS INC.: KEY EXECUTIVES
  • TABLE 144. VALERITAS INC.: COMPANY SNAPSHOT
  • TABLE 145. VALERITAS INC.: OPERATING SEGMENTS
  • TABLE 146. VALERITAS INC.: PRODUCT PORTFOLIO
  • TABLE 147. VALERITAS INC.: KEY STRATEGIC MOVES AND DEVELOPMENTS
  • LIST OF FIGURES

  • FIGURE 1. GLOBAL CONTINUOUS SUBCUTANEOUS INSULIN INFUSION MARKET SEGMENTATION
  • FIGURE 2. GLOBAL CONTINUOUS SUBCUTANEOUS INSULIN INFUSION MARKET
  • FIGURE 3. SEGMENTATION CONTINUOUS SUBCUTANEOUS INSULIN INFUSION MARKET
  • FIGURE 4. TOP INVESTMENT POCKET IN CONTINUOUS SUBCUTANEOUS INSULIN INFUSION MARKET
  • FIGURE 5. MODERATE BARGAINING POWER OF BUYERS
  • FIGURE 6. MODERATE BARGAINING POWER OF SUPPLIERS
  • FIGURE 7. MODERATE THREAT OF NEW ENTRANTS
  • FIGURE 8. LOW THREAT OF SUBSTITUTION
  • FIGURE 9. HIGH COMPETITIVE RIVALRY
  • FIGURE 10. OPPORTUNITIES, RESTRAINTS AND DRIVERS: GLOBALCONTINUOUS SUBCUTANEOUS INSULIN INFUSION MARKET
  • FIGURE 11. CONTINUOUS SUBCUTANEOUS INSULIN INFUSION MARKET SEGMENTATION, BY BY PRODUCT TYPE
  • FIGURE 12. CONTINUOUS SUBCUTANEOUS INSULIN INFUSION MARKET FOR PATCH PUMPS, BY COUNTRY, 2022-2032 ($MILLION)
  • FIGURE 13. CONTINUOUS SUBCUTANEOUS INSULIN INFUSION MARKET FOR TETHERED PUMPS, BY COUNTRY, 2022-2032 ($MILLION)
  • FIGURE 14. CONTINUOUS SUBCUTANEOUS INSULIN INFUSION MARKET SEGMENTATION, BY BY PATIENT TYPE
  • FIGURE 15. CONTINUOUS SUBCUTANEOUS INSULIN INFUSION MARKET FOR TYPE 1, BY COUNTRY, 2022-2032 ($MILLION)
  • FIGURE 16. CONTINUOUS SUBCUTANEOUS INSULIN INFUSION MARKET FOR TYPE 2, BY COUNTRY, 2022-2032 ($MILLION)
  • FIGURE 17. CONTINUOUS SUBCUTANEOUS INSULIN INFUSION MARKET SEGMENTATION, BY BY END USER
  • FIGURE 18. CONTINUOUS SUBCUTANEOUS INSULIN INFUSION MARKET FOR HOSPITALS, BY COUNTRY, 2022-2032 ($MILLION)
  • FIGURE 19. CONTINUOUS SUBCUTANEOUS INSULIN INFUSION MARKET FOR HOME CARE, BY COUNTRY, 2022-2032 ($MILLION)
  • FIGURE 20. CONTINUOUS SUBCUTANEOUS INSULIN INFUSION MARKET FOR LABORATORIES, BY COUNTRY, 2022-2032 ($MILLION)
  • FIGURE 21. TOP WINNING STRATEGIES, BY YEAR, 2020-2022*
  • FIGURE 22. TOP WINNING STRATEGIES, BY DEVELOPMENT, 2020-2022*
  • FIGURE 23. TOP WINNING STRATEGIES, BY COMPANY, 2020-2022*
  • FIGURE 24. PRODUCT MAPPING OF TOP 10 PLAYERS
  • FIGURE 25. COMPETITIVE DASHBOARD
  • FIGURE 26. COMPETITIVE HEATMAP: CONTINUOUS SUBCUTANEOUS INSULIN INFUSION MARKET
  • FIGURE 27. Top player positioning, 2022
  • FIGURE 28. MEDTRONIC INC: NET SALES, 2020-2022 ($MILLION)
  • FIGURE 29. MEDTRONIC INC: REVENUE SHARE, BY SEGMENT, 2032 (%)
  • FIGURE 30. MEDTRONIC INC: REVENUE SHARE, BY REGION, 2032 (%)
  • FIGURE 31. TANDEM DIABETES CARE: NET SALES, 2020-2022 ($MILLION)
  • FIGURE 32. TANDEM DIABETES CARE: REVENUE SHARE, BY SEGMENT, 2032 (%)
  • FIGURE 33. TANDEM DIABETES CARE: REVENUE SHARE, BY REGION, 2032 (%)
  • FIGURE 34. CEQUR: NET SALES, 2020-2022 ($MILLION)
  • FIGURE 35. CEQUR: REVENUE SHARE, BY SEGMENT, 2032 (%)
  • FIGURE 36. CEQUR: REVENUE SHARE, BY REGION, 2032 (%)
  • FIGURE 37. F HOFFMANN-LA ROCHE: NET SALES, 2020-2022 ($MILLION)
  • FIGURE 38. F HOFFMANN-LA ROCHE: REVENUE SHARE, BY SEGMENT, 2032 (%)
  • FIGURE 39. F HOFFMANN-LA ROCHE: REVENUE SHARE, BY REGION, 2032 (%)
  • FIGURE 40. INSULET CORPORATION: NET SALES, 2020-2022 ($MILLION)
  • FIGURE 41. INSULET CORPORATION: REVENUE SHARE, BY SEGMENT, 2032 (%)
  • FIGURE 42. INSULET CORPORATION: REVENUE SHARE, BY REGION, 2032 (%)
  • FIGURE 43. YPSOMED: NET SALES, 2020-2022 ($MILLION)
  • FIGURE 44. YPSOMED: REVENUE SHARE, BY SEGMENT, 2032 (%)
  • FIGURE 45. YPSOMED: REVENUE SHARE, BY REGION, 2032 (%)
  • FIGURE 46. SOOIL DEVELOPMENT: NET SALES, 2020-2022 ($MILLION)
  • FIGURE 47. SOOIL DEVELOPMENT: REVENUE SHARE, BY SEGMENT, 2032 (%)
  • FIGURE 48. SOOIL DEVELOPMENT: REVENUE SHARE, BY REGION, 2032 (%)
  • FIGURE 49. CELLENOVO: NET SALES, 2020-2022 ($MILLION)
  • FIGURE 50. CELLENOVO: REVENUE SHARE, BY SEGMENT, 2032 (%)
  • FIGURE 51. CELLENOVO: REVENUE SHARE, BY REGION, 2032 (%)
  • FIGURE 52. VALERITAS INC.: NET SALES, 2020-2022 ($MILLION)
  • FIGURE 53. VALERITAS INC.: REVENUE SHARE, BY SEGMENT, 2032 (%)
  • FIGURE 54. VALERITAS INC.: REVENUE SHARE, BY REGION, 2032 (%)


With collective industry experience of about 200 years of its analysts and experts, Allied Market Research (AMR) encompasses most infallible research methodology for its market intelligence and industry analysis. We do not only engrave the deepest levels of markets but also sneak through its slimmest details for the purpose of our market estimates and forecasts. Our approach helps in building greater market consensus view for size, shape and industry trends within each industry segment. We carefully factor in industry trends and real developments for identifying key growth factors and future course of the market. Our research proceeds are the resultant of high quality data, expert views and analysis and high value independent opinions. Our research process is designed to deliver balanced view of the global markets and allow stakeholders to make informed decisions.

We offer our clients exhaustive research and analysis based on wide variety of factual inputs, which largely include interviews with industry participants, reliable statistics and regional intelligence. Our in-house industry experts play instrumental role in designing analytic tools and models, tailored to the requirements of particular industry segment. These analytical tools and models sanitize the data & statistics and enhance the accuracy of our recommendations and advice. With AMR’s calibrated research process and 360` degree data-evaluation methodology, our clients are assured of receiving:

  • Consistent, valuable, robust and actionable data & analysis that can easily be referenced for strategic business planning
  • Technologically sophisticated and reliable insights through well audited and veracious research methodology
  • Sovereign research proceeds that present a tangible depiction of marketplace


With a strong methodology we are, therefore, confident that our research and analysis are most reliable and guarantees sound business planning.

Secondary research
We refer a broad array of industry sources for our secondary, which typically include; however, not limited to: Company SEC filings, annual reports, company websites, broker & financial reports and investor presentations for competitive scenario and shape of the industry

  • Patent and regulatory databases for understanding of technical & legal developments
  • Scientific and technical writings for product information and related preemptions
  • Regional government and statistical databases for macro analysis
  • Authentic new articles, web-casts and other related releases for market evaluation
  • Internal and external proprietary databases, key market indicators and relevant press releases for market estimates and forecast


Primary research
Our primary research efforts include reaching out participants through mail, tele-conversations, referrals, professional networks and face-to-face interactions. We are also in professional corporate relations with various companies that allow us greater flexibility for reaching out industry participants and commentators for interviews and discussions, fulfilling following functions:

  • Validates and improves the data quality and strengthens research proceeds
  • Further develops analyst team’s market understanding and expertise
  • Supplies authentic information about market size, share, growth and forecasts


Our primary research interview and discussion panels are typically composed of most experienced industry members. These participants include; however, not limited to:

  • Chief executives and VPs of leading corporations specific to industry
  • Product and sales managers or country heads; channel partners and top level distributors; banking, investments and valuation experts Key opinion leaders (KOLs)


Analyst tools and models
AMR has developed set of analyst tools and data models to supplement and expedite the analysis process. Corresponding to markets, where there is significant lack of information and estimates, AMR’s team of experts and analyst develop specific analyst tools and industry models to translate qualitative and quantitative industry indicators into exact industry estimates. These models also allow analysts to examine the prospects and opportunities prevailing in the market to accurately forecast the course of the market.

PURCHASE OPTIONS

Call or Email us

U.S.-Canada Toll-free: +1-800-792-5285
Int'l : +1-503-894-6022
Europe : +44-845-528-1300
Email : help@alliedmarketresearch.com

Looking for Customization?

 Customization Request

Have a Question?

 Speak with Analyst

Any Confusion?

 Inquire Before Buying

Have a glance of the Report

  Enquiry Now

Purchase Full Report of
Continuous Subcutaneous Insulin Infusion Market

Start reading.
This Report and over 66,983+ more Reports, Available with Avenue Library. T&C*.

  • Online Only
  • $3,690
  • Online cloud access only
  • Restricted print, copy, paste & download
  • Read only
  • Free industry update
    (Within 180 days)
  • Free report update in next update cycle
  • Data Pack
  • $3,840
  • Restricted to one authorized user
  • One print only
  • Available in
    Excel
  • Free industry update
    (Within 180 days)
  •   Free report update in next update cycle
  • Single User
  • $5,820
  • Restricted to one authorized user
  • One print only
  • Available in
    PDF
  • Free industry update
    (Within 180 days)
  •   Free report update in next update cycle
  • Five Users
  • $6,540
  • Limited to five authorized users
  • Print upto five copies
  • Available in
    PDF
  • Free industry update
    (Within 180 days)
  •   Free report update in next update cycle
  • Enterprise
    License/PDF

  • $9,870
  • Unlimited
    within
    company/enterprise
  • Available in Excel & PDF
  • Free industry update
    (Within 180 days)
  •   Free report update in next update cycle
  • Library
    Membership

  • $999 $ 1,175
    Per User/ Per month/ Billed annually
  • Published Content
    E-access
  • Company Profiles
    E-access
  • Newly Added Content Access
  • 10 PDF
    Downloads
  • 5 Excel Data
    Pack Downloads
  • 250 Company Profiles PDF Downloads
  • Buy Now

*Taxes/Fees, if applicable will be added during checkout. All prices in USD

RELATED REPORTS
 

Why Allied Market Research?


Infallible Methodology

To ensure high-level data integrity, accurate analysis, and impeccable forecasts

Analyst Support

For complete satisfaction

Customization

On-demand customization of scope of the report to exactly meet your needs

TARGETED MARKET VIEW

Targeted market view to provide pertinent information and save time of readers

Get fresh content delivered

Get insights on topics that are crucial for your business. Stay abreast of your interest areas.

Get Industry Data Alerts

Why Allied Market Research?

Infallible Methodology

To ensure high-level data integrity, accurate analysis, and impeccable forecasts

Analyst Support

For complete satisfaction

Customization

On-demand customization of scope of the report to exactly meet your needs

TARGETED MARKET VIEW

Targeted market view to provide pertinent information and save time of readers