A00794 | Pages: 187 | May 2022 | 3528 Views | | |
Author(s) : Prakhar Jain, Marpu Vinod , Eswara Prasad | Tables: 109 | Charts: 66 |
|
Pandemic disrupted the entire world and affected many industries.
Get detailed COVID-19 impact analysis on the Converter Transformer Market
Request Now !
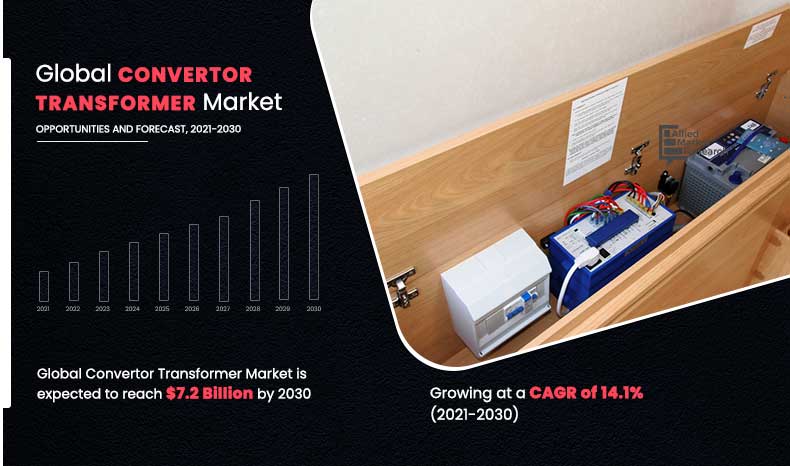
The global converter transformer market size was valued at $1.9 billion in 2020, and is projected to reach $7.2 billion by 2030, growing at a CAGR of 14.1% from 2021 to 2030. Converter transformer is a special transformer designed to offer high current low voltage solutions for its wide range of applications. A voltage converter is an electric converter that changes the voltage of electronic devices, whereas transformers are used for transmitting power from one voltage to another. The converter transformer can operate with 12 pulses for each cycle in the AC supply, which eliminates numerous harmonic current components by using a star-to-delta (wye-delta) connection of transformer winding. Insulation of transformer winding must be specially designed for withstanding large DC potential to earth. One unit of converter transformers can be made as large as 300 Megavolt-amperes (MW). The converter transformers withstand dc voltage stresses and increased eddy current losses due to harmonic currents. One problem that can arise is due to the dc magnetization of the core due to the unsymmetrical firing of valves.
The decrease in demand for many non-essential products and shut down of electrical, automotive, and other manufacturing related industries has created a negative impact on the development of converter transformer market. The increasing demand for environment friendly manufacturing products and increase in awareness among the people towards the environment will hamper the growth of converter transformer market.
Convertor transformer is used for converting power from AC to DC at one end and DC to AC at the other end. Converter transformers are mainly used in excitation systems for turbo and hydro-generators, electric drives of drilling equipment, as semiconductor converters of the traction substation for the city electrified public transport (tram, trolley bus, and subway), and DC & AC electric drives. Excitation transformers are used to excite the field of generators through a rectifier. Transformers up to 5.2 MVA rating are used for static excitation systems for generators of power plants. Cast resin dry type transformers are mainly used as converting transformers. Leading manufacturers of dry type transformers provide specialized configurations for individual applications.
Get more information on this report : Request Sample Pages
The high demand for efficient power transmission solutions, need for integration of smart grid technologies, and increasing government infrastructure are the key factors that drive the converter transformer market growth. However, capital-intensive nature of manufacturing processes and the lack of product standardization mechanism are the major factors that hamper the growth of the market. Rapidly increasing power generation by offshore wind farms and rise in environmental concerns towards high power transmission features are the factors that are expected to offer ample growth opportunities to the global converter transformer market. The converter transformer market is segmented on the basis of type, application, and region.
On the basis of type, the global converter transformer market is segmented into 201-400 Kv, 401-600 Kv, and 601-800 Kv. On the basis of application, the global converter transformer market is segmented into wind farms, oil & gas, and grid connections.
Region-wise, the market is studied across North America, Europe, Asia-Pacific, and LAMEA. Presently, Asia-Pacific accounts for the largest share of the market, followed by North America and Europe.
The major companies profiled in this converter transformer industry report include, ABB Power Systems, General Electric, Siemens AG, Crompton Greaves, Bharat Heavy Electricals Limited, Toshiba Corporation, Kirloskar Electric Company Limited, Shadong Power Equipment Company Limited, Mitsubishi Electric, and XIAN XD Transformer Co. Ltd. Rapid urbanization, and industrialization across the globe have led to increase in the demand for energy from green resources, which led to the demand for converter transformer. Additional growth strategies such as expansion of production capacities, acquisition, and partnership in the development of the innovative products from manufacturers have helped to attain key developments in the global converter transformer market trends.
Asia-Pacific occupies the largest part of the global converter transformer market and consists of countries, such as China, India, Japan, South Korea, Australia, and rest of Asia-Pacific. China is emerging as an electric power giant in the Asian region due to the number of undergoing electricity projects. In the renewable energy generation sector, China has taken a leading position in the form of numerous solar projects. This has put China as a significant region for the growth of the converter transformer market. The ongoing COVID-19 pandemic has not affected new railway projects in China. The list of new railway lines includes the 156 km Kazuo-Chifeng line, connecting the Chifeng area of Inner Mongolia with the Beijing – Shenzhen line, Anshun–Liupanshui line, and the Qinghai section of the Geku Railway.
Get more information on this report : Request Sample Pages
Japan has a very large manufacturing base. Automotive manufacturers, such as Toyota, Honda, and Mitsubishi are among the largest manufacturers globally. Moreover, Japanese manufacturers known for their innovative product design have extensive global links in Southeast Asia. The 2030 energy mix sets forth a policy to reduce Japan’s fossil fuel dependence through energy conservation and aims to increase the share of renewables in Japan’s power generation mix to around 22%–24% by 2030.
Electricity demand in India is growing rapidly due to its growing economy and population. Electricity security has improved by the creation of one national power system and major investments in clean energy. India is now working on integrating higher shares of variable renewable energy into the energy mix. Further, government initiatives, such as Make in India are expected to attract new investments in these sectors. The Indian government’s 100% FDI policy is likely to attract foreign investment in the manufacturing sectors. These factors are likely to drive the growth of the converter transformer market in the region.
The 401-600 KV segment dominates the global converter transformer market. Increase in demand for crude oil in the petroleum and chemical industries boosts the demand for converter transformers. Surge in population and industrialization across the globe led to increase in demand for power, which led to the development of renewable power generation, such as large-scale offshore wind farms. The offshore wind farms power generation is growing at a rapid pace, which has a positive impact on the demand for the converter transformers. Rise in the development of industries and renewable energy infrastructure in the developed and developing countries across the globe is expected to provide ample opportunities for the growth of the converter transformer market during the forecast period.
Get more information on this report : Request Sample Pages
The grid connections segment dominates the global converter transformer market. The presence of aging infrastructure of power grid, escalating cost of electricity generation, and increase in demand for power are some of the national challenges, which boost the need of smart grids. Smart power grids equipped with converter transformers including smart meters and appliances, ensure uninterrupted and efficient distribution of energy. However, the traditional transformer is not efficient or ready for the upcoming smart grids. Thus, the efficient working of smart grid is dependent on smart transformers and it is expected to be a vital part of smart grids. The components of power grid mainly include, station- to produce electric power, high voltage transmission lines- to carry power from source to users, and distribution lines- to connect with consumers individually. The transformers used in power grid are the key components in energy collection and distribution. The advantages of converter transformers include, reduction of greenhouse gas emission and energy consumption, by providing stable and optimal power supply.
Get more information on this report : Request Sample Pages
The COVID-19 pandemic had a big effect on the global financial system and on the lives of human beings. With the outbreak of the COVID-19 pandemic, numerous enterprise companies have reduced their planned operations as a result of lockdowns introduced by the governments of several countries throughout the globe. The lockdown has primarily affected important businesses organizations. The initiative of the authorities in regards to lockdown caused the transient shutdown of the tourism industry, aviation sector, and others. Consumer demand for non-essential goods subsequently reduced the demand for converter transformer as most individuals’ general economic status have been severely affected due to pandemic outbreak. COVID-19 lockdown measures have resulted in weekly electricity demand, decreasing by 10-35% across the pandemic affected regions. Furthermore, increase in the input from variable renewable energy to the distribution grid has increased the demand for converter transformers. The above-mentioned elements are expected to have impact on the revenue trajectory of the global converter transformer market during the forecast period.
Key benefits for stakeholders
Key Market Segments
CHAPTER 1: INTRODUCTION
1.1. Report description
1.2. Key benefits for stakeholders
1.3. Key market segments
1.4. Research methodology
1.4.1. Secondary research
1.4.2. Primary research
1.5. Analyst tools and models
CHAPTER 2: EXECUTIVE SUMMARY
2.1. Key findings of the study
2.2. CXO perspective
CHAPTER 3: MARKET OVERVIEW
3.1. Market definition and scope
3.2. Key findings
3.2.1. Top investment pockets
3.3. Porter’s five forces analysis
3.4. Market dynamics
3.4.1. Drivers
3.4.1.1. The high demand for efficient power transmission solutions
3.4.1.2. The need for integration of smart grid technologies
3.4.2. Restraint
3.4.2.1. Capital-intensive nature of manufacturing process and the lack of product standardization
3.4.3. Opportunities
3.4.3.1. The increase in power generation by offshore wind farms and environmental concerns regarding high power transmission
3.5. Value chain analysis
3.6. Impact of key regulations on the global GLOBAL CONVERTOR TRANSFORMER market
3.7. Impact of COVID-19 on the global GLOBAL CONVERTOR TRANSFORMER market
CHAPTER 4: GLOBAL CONVERTOR TRANSFORMER MARKET, BY TYPE
4.1. Overview
4.1.1. Market size and forecast
4.2. 201-400 Kv
4.2.1. Key market trends, growth factors, and opportunities
4.2.2. Market size and forecast, by region
4.2.3. Comparative Share Analysis, by Country
4.3. 401-600 Kv
4.3.1. Key market trends, growth factors, and opportunities
4.3.2. Market size and forecast, by region
4.3.3. Comparative Share Analysis, by Country
4.4. 601-800 Kv
4.4.1. Key market trends, growth factors, and opportunities
4.4.2. Market size and forecast, by region
4.4.3. Comparative Share Analysis, by Country
CHAPTER 5: GLOBAL CONVERTOR TRANSFORMER MARKET, BY APPLICATION
5.1. Overview
5.1.1. Market size and forecast
5.2. Wind farms
5.2.1. Key market trends, growth factors, and opportunities
5.2.2. Market size and forecast, by region
5.2.3. Comparative Share Analysis, by Country
5.3. Oil and gas
5.3.1. Key market trends, growth factors, and opportunities
5.3.2. Market size and forecast, by region
5.3.3. Comparative Share Analysis, by Country
5.4. Grid connections
5.4.1. Key market trends, growth factors, and opportunities
5.4.2. Market size and forecast, by region
5.4.3. Comparative Share Analysis, by Country
CHAPTER 6: GLOBAL CONVERTOR TRANSFORMER MARKET, BY REGION
6.1. Overview
6.1.1. Market size and forecast, by region
6.2. North America
6.2.1. Key market trends, growth factors, and opportunities
6.2.2. Market size and forecast, by type
6.2.3. Market size and forecast, by application
6.2.4. Market analysis, by country
6.2.4.1. U.S.
6.2.4.1.1. Market size and forecast, by type
6.2.4.1.2. Market size and forecast, by Application
6.2.4.2. Canada
6.2.4.2.1. Market size and forecast, by type
6.2.4.2.2. Market size and forecast, by Application
6.2.4.3. Mexico
6.2.4.3.1. Market size and forecast, by type
6.2.4.3.2. Market size and forecast, by Application
6.3. Europe
6.3.1. Key market trends, growth factors, and opportunities
6.3.2. Market size and forecast, by type
6.3.3. Market size and forecast, by application
6.3.4. Market analysis, by country
6.3.4.1. Germany
6.3.4.1.1. Market size and forecast, by type
6.3.4.1.2. Market size and forecast, by Application
6.3.4.2. France
6.3.4.2.1. Market size and forecast, by type
6.3.4.2.2. Market size and forecast, by Application
6.3.4.3. Italy
6.3.4.3.1. Market size and forecast, by type
6.3.4.3.2. Market size and forecast, by Application
6.3.4.4. Spain
6.3.4.4.1. Market size and forecast, by type
6.3.4.4.2. Market size and forecast, by Application
6.3.4.5. UK
6.3.4.5.1. Market size and forecast, by type
6.3.4.5.2. Market size and forecast, by Application
6.3.4.6. Rest of Europe
6.3.4.6.1. Market size and forecast, by type
6.3.4.6.2. Market size and forecast, by Application
6.4. Asia-Pacific
6.4.1. Key market trends, growth factors, and opportunities
6.4.2. Market size and forecast, by type
6.4.3. Market size and forecast, by application
6.4.4. Market analysis, by country
6.4.4.1. China
6.4.4.1.1. Market size and forecast, by type
6.4.4.1.2. Market size and forecast, by Application
6.4.4.2. Japan
6.4.4.2.1. Market size and forecast, by type
6.4.4.2.2. Market size and forecast, by Application
6.4.4.3. India
6.4.4.3.1. Market size and forecast, by type
6.4.4.3.2. Market size and forecast, by Application
6.4.4.4. South Korea
6.4.4.4.1. Market size and forecast, by type
6.4.4.4.2. Market size and forecast, by Application
6.4.4.5. Rest of Asia-Pacific
6.4.4.5.1. Market size and forecast, by type
6.4.4.5.2. Market size and forecast, by Application
6.5. LAMEA
6.5.1. Key market trends, growth factors, and opportunities
6.5.2. Market size and forecast, by type
6.5.3. Market size and forecast, by application
6.5.4. Market analysis, by country
6.5.4.1. Brazil
6.5.4.1.1. Market size and forecast, by type
6.5.4.1.2. Market size and forecast, by Application
6.5.4.2. Saudi Arabia
6.5.4.2.1. Market size and forecast, by type
6.5.4.2.2. Market size and forecast, by Application
6.5.4.3. South Africa
6.5.4.3.1. Market size and forecast, by type
6.5.4.3.2. Market size and forecast, by Application
6.5.4.4. Rest of LAMEA
6.5.4.4.1. Market size and forecast, by type
6.5.4.4.2. Market size and forecast, by Application
CHAPTER 7: COMPETITIVE LANDSCAPE
7.1. Introduction
7.1.1. Market player positioning, 2020
7.2. Top winning strategies
7.2.1. Top winning strategies, by year
7.2.2. Top winning strategies, by development
7.2.3. Top winning strategies, by company
7.3. Key developments
7.3.1. Other developments
CHAPTER 8: COMPANY PROFILES
8.1. ABB Power Systems
8.1.1. Company overview
8.1.2. Key executives
8.1.3. Company snapshot
8.1.4. Operating business segments
8.1.5. Product portfolio
8.1.6. R&D expenditure
8.1.7. Business performance
8.1.8. Key strategic moves and developments
8.2. Bharat Heavy Electricals Limited
8.2.1. Company overview
8.2.2. Key executives
8.2.3. Company snapshot
8.2.4. Operating business segments
8.2.5. Product portfolio
8.2.6. Business performance
8.2.7. Key strategic moves and developments
8.3. Crompton Greaves
8.3.1. Company overview
8.3.2. Key executives
8.3.3. Company snapshot
8.3.4. Operating business segments
8.3.5. 172
8.3.6. Product portfolio
8.3.1. R&D expenditure
8.3.2. Business performance
8.4. GENERAL ELECTRIC
8.4.1. Company overview
8.4.2. Company snapshot
8.4.3. Operating Product segments
8.4.4. Product portfolio
8.4.5. R&D expenditure
8.4.6. Business Performance
8.4.7. Key strategic moves and developments
8.5. KIRLOSKAR ELECTRIC COMPANY LIMITED
8.5.1. Company overview
8.5.2. Key executives
8.5.3. Company snapshot
8.5.4. Product portfolio
8.5.5. Business performance
8.6. Mitsubishi Electric
8.6.1. Company overview
8.6.2. Key executives
8.6.3. Company snapshot
8.6.4. Operating business segments
8.6.5. Product portfolio
8.6.6. R&D expenditure
8.6.7. Business performance
8.6.8. Key strategic moves and developments
8.7. SHANDONG POWER EQUIPMENT COMPANY LIMITED
8.7.1. Company overview
8.7.2. Key executives
8.7.3. Company snapshot
8.7.4. Product portfolio
8.8. Siemens AG
8.8.1. Company overview
8.8.2. Key executives
8.8.3. Company snapshot
8.8.4. Operating business segments
8.8.5. Product portfolio
8.8.6. R&D expenditure
8.8.7. Business performance
8.9. Toshiba Corporation
8.9.1. Company overview
8.9.2. Key executives
8.9.3. Company snapshot
8.9.4. Operating business segments
8.9.5. Product portfolio
8.9.6. R&D expenditure
8.9.7. Business performance
8.10. XIAN XD TRANSFORMER CO. LTD
8.10.1. Company overview
8.10.2. Key executives
8.10.3. Company snapshot
8.10.4. Product portfolio
LIST OF TABLES
TABLE 01. GLOBAL CONVERTOR TRANSFORMER MARKET, BY TYPE, 2020–2030 ($MILLION)
TABLE 02. GLOBAL CONVERTOR TRANSFORMER MARKET FOR 201-400 KV, BY REGION, 2020–2030 ($MILLION)
TABLE 03. GLOBAL CONVERTOR TRANSFORMER MARKET FOR 401-600 KV, BY REGION, 2020–2030 ($MILLION)
TABLE 04. GLOBAL CONVERTOR TRANSFORMER MARKET FOR 601-800 KV, BY REGION, 2020–2030 ($MILLION)
TABLE 05. GLOBAL CONVERTOR TRANSFORMER MARKET, BY APPLICATION, 2020–2030 ($MILLION)
TABLE 06. GLOBAL CONVERTOR TRANSFORMER MARKET FOR WIND FARMS, BY REGION, 2020–2030 ($MILLION)
TABLE 07. GLOBAL CONVERTOR TRANSFORMER MARKET FOR OIL AND GAS, BY REGION, 2020–2030 ($MILLION)
TABLE 08. GLOBAL CONVERTOR TRANSFORMER MARKET FOR GRID CONNECTIONS, BY REGION, 2020–2030 ($MILLION)
TABLE 09. GLOBAL CONVERTOR TRANSFORMER MARKET, BY REGION, 2020–2030 ($MILLION)
TABLE 10. NORTH AMERICA CONVERTOR TRANSFORMER MARKET, BY TYPE, 2020–2030 ($MILLION)
TABLE 11. NORTH AMERICA CONVERTOR TRANSFORMER MARKET, BY APPLICATION, 2020–2030 ($MILLION)
TABLE 12. NORTH AMERICA CONVERTOR TRANSFORMER MARKET, BY COUNTRY, 2020–2030 ($MILLION)
TABLE 13. U.S. CONVERTOR TRANSFORMER MARKET, BY TYPE, 2020–2030 ($MILLION)
TABLE 14. U.S. CONVERTOR TRANSFORMER MARKET, BY APPLICATION, 2020–2030 ($MILLION)
TABLE 15. CANADA CONVERTOR TRANSFORMER MARKET, BY TYPE, 2020–2030 ($MILLION)
TABLE 16. CANADA CONVERTOR TRANSFORMER MARKET, BY APPLICATION, 2020–2030 ($MILLION)
TABLE 17. MEXICO CONVERTOR TRANSFORMER MARKET, BY TYPE, 2020–2030 ($MILLION)
TABLE 18. MEXICO CONVERTOR TRANSFORMER MARKET, BY APPLICATION, 2020–2030 ($MILLION)
TABLE 19. EUROPE CONVERTOR TRANSFORMER MARKET, BY TYPE, 2020–2030 ($MILLION)
TABLE 20. EUROPE CONVERTOR TRANSFORMER MARKET, BY APPLICATION, 2020–2030 ($MILLION)
TABLE 21. EUROPE CONVERTOR TRANSFORMER MARKET, BY COUNTRY, 2020–2030 ($MILLION)
TABLE 22. GERMANY CONVERTOR TRANSFORMER MARKET, BY TYPE, 2020–2030 ($MILLION)
TABLE 23. GERMANY CONVERTOR TRANSFORMER MARKET, BY APPLICATION, 2020–2030 ($MILLION)
TABLE 24. FRANCE CONVERTOR TRANSFORMER MARKET, BY TYPE, 2020–2030 ($MILLION)
TABLE 25. FRANCE CONVERTOR TRANSFORMER MARKET, BY APPLICATION, 2020–2030 ($MILLION)
TABLE 26. ITALY CONVERTOR TRANSFORMER MARKET, BY TYPE, 2020–2030 ($MILLION)
TABLE 27. ITALY CONVERTOR TRANSFORMER MARKET, BY APPLICATION, 2020–2030 ($MILLION)
TABLE 28. SPAIN CONVERTOR TRANSFORMER MARKET, BY TYPE, 2020–2030 ($MILLION)
TABLE 29. SPAIN CONVERTOR TRANSFORMER MARKET, BY APPLICATION, 2020–2030 ($MILLION)
TABLE 30. UK CONVERTOR TRANSFORMER MARKET, BY TYPE, 2020–2030 ($MILLION)
TABLE 31. UK CONVERTOR TRANSFORMER MARKET, BY APPLICATION, 2020–2030 ($MILLION)
TABLE 32. REST OF EUROPE CONVERTOR TRANSFORMER MARKET, BY TYPE, 2020–2030 ($MILLION)
TABLE 33. REST OF EUROPE CONVERTOR TRANSFORMER MARKET, BY APPLICATION, 2020–2030 ($MILLION)
TABLE 34. ASIA-PACIFIC CONVERTOR TRANSFORMER MARKET, BY TYPE, 2020–2030 ($MILLION)
TABLE 35. ASIA-PACIFIC CONVERTOR TRANSFORMER MARKET, BY APPLICATION, 2020–2030 ($MILLION)
TABLE 36. ASIA-PACIFIC CONVERTOR TRANSFORMER MARKET, BY COUNTRY, 2020–2030 ($MILLION)
TABLE 37. CHINA CONVERTOR TRANSFORMER MARKET, BY TYPE, 2020–2030 ($MILLION)
TABLE 38. CHINA CONVERTOR TRANSFORMER MARKET, BY APPLICATION, 2020–2030 ($MILLION)
TABLE 39. JAPAN CONVERTOR TRANSFORMER MARKET, BY TYPE, 2020–2030 ($MILLION)
TABLE 40. JAPAN CONVERTOR TRANSFORMER MARKET, BY APPLICATION, 2020–2030 ($MILLION)
TABLE 41. INDIA CONVERTOR TRANSFORMER MARKET, BY TYPE, 2020–2030 ($MILLION)
TABLE 42. INDIA CONVERTOR TRANSFORMER MARKET, BY APPLICATION, 2020–2030 ($MILLION)
TABLE 43. SOUTH KOREA CONVERTOR TRANSFORMER MARKET, BY TYPE, 2020–2030 ($MILLION)
TABLE 44. SOUTH KOREA CONVERTOR TRANSFORMER MARKET, BY APPLICATION, 2020–2030 ($MILLION)
TABLE 45. REST OF ASIA-PACIFIC CONVERTOR TRANSFORMER MARKET, BY TYPE, 2020–2030 ($MILLION)
TABLE 46. REST OF ASIA-PACIFIC CONVERTOR TRANSFORMER MARKET, BY APPLICATION, 2020–2030 ($MILLION)
TABLE 47. LAMEA CONVERTOR TRANSFORMER MARKET, BY TYPE, 2020–2030 ($MILLION)
TABLE 48. LAMEA CONVERTOR TRANSFORMER MARKET, BY APPLICATION, 2020–2030 ($MILLION)
TABLE 49. LAMEA CONVERTOR TRANSFORMER MARKET, BY COUNTRY, 2020–2030 ($MILLION)
TABLE 50. BRAZIL CONVERTOR TRANSFORMER MARKET, BY TYPE, 2020–2030 ($MILLION)
TABLE 51. BRAZIL CONVERTOR TRANSFORMER MARKET, BY APPLICATION, 2020–2030 ($MILLION)
TABLE 52. SAUDI ARABIA CONVERTOR TRANSFORMER MARKET, BY TYPE, 2020–2030 ($MILLION)
TABLE 53. SAUDI ARABIA CONVERTOR TRANSFORMER MARKET, BY APPLICATION, 2020–2030 ($MILLION)
TABLE 54. SOUTH AFRICA CONVERTOR TRANSFORMER MARKET, BY TYPE, 2020–2030 ($MILLION)
TABLE 55. SOUTH AFRICA CONVERTOR TRANSFORMER MARKET, BY APPLICATION, 2020–2030 ($MILLION)
TABLE 56. REST OF LAMEA CONVERTOR TRANSFORMER MARKET, BY TYPE, 2020–2030 ($MILLION)
TABLE 57. REST OF LAMEA CONVERTOR TRANSFORMER MARKET, BY APPLICATION, 2020–2030 ($MILLION)
TABLE 58. OTHER KEY DEVELOPMENTS (2018-2021)
TABLE 59. ABB POWER SYSTEMS: KEY EXECUTIVES
TABLE 60. ABB POWER SYSTEMS: COMPANY SNAPSHOT
TABLE 61. ABB POWER SYSTEMS: OPERATING SEGMENTS
TABLE 62. ABB POWER SYSTEMS: PRODUCT PORTFOLIO
TABLE 63. ABB POWER SYSTEMS: R&D EXPENDITURE, 2019–2021 ($MILLION)
TABLE 64. ABB POWER SYSTEMS: NET SALES, 2019–2021 ($MILLION)
TABLE 65. BHARAT HEAVY ELECTRICALS LIMITED: KEY EXECUTIVES
TABLE 66. BHARAT HEAVY ELECTRICALS LIMITED: COMPANY SNAPSHOT
TABLE 67. BHARAT HEAVY ELECTRICALS LIMITED: OPERATING SEGMENTS
TABLE 68. BHARAT HEAVY ELECTRICALS LIMITED: PRODUCT PORTFOLIO
TABLE 69. BHARAT HEAVY ELECTRICALS LIMITED: NET SALES, 2019–2021 ($MILLION)
TABLE 70. CROMPTON GREAVES: KEY EXECUTIVES
TABLE 71. CROMPTON GREAVES: COMPANY SNAPSHOT
TABLE 72. CROMPTON GREAVES: OPERATING SEGMENTS
TABLE 73. CROMPTON GREAVES: PRODUCT PORTFOLIO
TABLE 74. CROMPTON GREAVES: R&D EXPENDITURE, 2018–2020 ($MILLION)
TABLE 75. CROMPTON GREAVES: NET SALES, 2018–2020 ($MILLION)
TABLE 76. GENERAL ELECTRIC: COMPANY SNAPSHOT
TABLE 77. GENERAL ELECTRIC: OPERATING PRODUCT SEGMENTS
TABLE 78. GENERAL ELECTRIC: PRODUCT PORTFOLIO
TABLE 79. GENERAL ELECTRIC: R&D EXPENDITURE, 2019–2021 ($MILLION)
TABLE 80. GENERAL ELECTRIC: OVERALL FINANCIAL STATUS ($MILLION)
TABLE 81. GENERAL ELECTRIC: KEY STRATEGIC MOVES AND DEVELOPMENTS
TABLE 82. KIRLOSKAR ELECTRIC COMPANY LIMITED: KEY EXECUTIVES
TABLE 83. KIRLOSKAR ELECTRIC COMPANY LIMITED: COMPANY SNAPSHOT
TABLE 84. KIRLOSKAR ELECTRIC COMPANY LIMITED: PRODUCT PORTFOLIO
TABLE 85. KIRLOSKAR ELECTRIC COMPANY LIMITED: NET SALES, 2019–2021 ($MILLION)
TABLE 86. MITSUBISHI ELECTRIC: KEY EXECUTIVES
TABLE 87. MITSUBISHI ELECTRIC: COMPANY SNAPSHOT
TABLE 88. MITSUBISHI ELECTRIC: OPERATING SEGMENTS
TABLE 89. MITSUBISHI ELECTRIC: PRODUCT PORTFOLIO
TABLE 90. MITSUBISHI ELECTRIC: R&D EXPENDITURE, 2019–2021 ($MILLION)
TABLE 91. MITSUBISHI ELECTRIC: NET SALES, 2019–2021 ($MILLION)
TABLE 92. SHANDONG POWER EQUIPMENT COMPANY LIMITED: KEY EXECUTIVES
TABLE 93. SHANDONG POWER EQUIPMENT COMPANY LIMITED: COMPANY SNAPSHOT
TABLE 94. SHANDONG POWER EQUIPMENT COMPANY LIMITED: PRODUCT PORTFOLIO
TABLE 95. SIEMENS AG: KEY EXECUTIVES
TABLE 96. SIEMENS AG: COMPANY SNAPSHOT
TABLE 97. SIEMENS AG: OPERATING SEGMENTS
TABLE 98. SIEMENS AG: PRODUCT PORTFOLIO
TABLE 99. SIEMENS AG: R&D EXPENDITURE, 2018–2020 ($MILLION)
TABLE 100. SIEMENS AG: NET SALES, 2019–2021 ($MILLION)
TABLE 101. TOSHIBA CORPORATION: KEY EXECUTIVES
TABLE 102. TOSHIBA CORPORATION: COMPANY SNAPSHOT
TABLE 103. TOSHIBA CORPORATION: OPERATING SEGMENTS
TABLE 104. TOSHIBA CORPORATION: PRODUCT PORTFOLIO
TABLE 105. TOSHIBA CORPORATION: R&D EXPENDITURE, 2019–2021 ($MILLION)
TABLE 106. TOSHIBA CORPORATION: NET SALES, 2019–2021 ($MILLION)
TABLE 107. XIAN XD TRANSFORMER CO. LTD: KEY EXECUTIVES
TABLE 108. XIAN XD TRANSFORMER CO. LTD: COMPANY SNAPSHOT
TABLE 109. XIAN XD TRANSFORMER CO. LTD: PRODUCT PORTFOLIO
LIST OF FIGURES
FIGURE 01. GLOBAL CONVERTOR TRANSFORMER MARKET SNAPSHOT
FIGURE 02. GLOBAL CONVERTOR TRANSFORMER MARKET SNAPSHOT
FIGURE 03. GLOBAL CONVERTOR TRANSFORMER MARKET SEGMENTATION
FIGURE 04. TOP INVESTMENT POCKETS
FIGURE 05. HIGH BARGAINING POWER OF SUPPLIERS
FIGURE 06. MODERATE BARGAINING POWER OF BUYERS
FIGURE 07. MODERATE THREAT OF NEW ENTRANTS
FIGURE 08. HIGH THREAT OF SUBSTITUTES
FIGURE 09. MODERATE COMPETITIVE RIVALRY
FIGURE 10. CONVERTOR TRANSFORMER MARKET DYNAMICS
FIGURE 11. VALUE CHAIN ANALYSIS
FIGURE 12. GLOBAL CONVERTOR TRANSFORMER MARKET, BY TYPE, 2020–2030 ($MILLION)
FIGURE 13. COMPARATIVE ANALYSIS OF GLOBAL CONVERTOR TRANSFORMER MARKET FOR 201-400 KV, BY COUNTRY, 2021 & 2030 ($MILLION)
FIGURE 14. COMPARATIVE ANALYSIS OF GLOBAL CONVERTOR TRANSFORMER MARKET FOR 401-600 KV, BY COUNTRY, 2021 & 2030 ($MILLION)
FIGURE 15. COMPARATIVE ANALYSIS OF GLOBAL CONVERTOR TRANSFORMER MARKET FOR 601-800 KV, BY COUNTRY, 2021 & 2030 ($MILLION)
FIGURE 16. GLOBAL CONVERTOR TRANSFORMER MARKET, BY APPLICATION, 2020–2030 ($MILLION)
FIGURE 17. COMPARATIVE ANALYSIS OF GLOBAL CONVERTOR TRANSFORMER MARKET FOR WIND FARMS, BY COUNTRY, 2021 & 2030 ($MILLION)
FIGURE 18. COMPARATIVE ANALYSIS OF GLOBAL CONVERTOR TRANSFORMER MARKET FOR OIL AND GAS, BY COUNTRY, 2021 & 2030 ($MILLION)
FIGURE 19. COMPARATIVE ANALYSIS OF GLOBAL CONVERTOR TRANSFORMER MARKET FOR GRID CONNECTIONS, BY COUNTRY, 2021 & 2030 ($MILLION)
FIGURE 20. U.S. CONVERTOR TRANSFORMER MARKET REVENUE, 2020–2030 ($MILLION)
FIGURE 21. CANADA CONVERTOR TRANSFORMER MARKET REVENUE, 2020–2030 ($MILLION)
FIGURE 22. MEXICO CONVERTOR TRANSFORMER MARKET REVENUE, 2020–2030 ($MILLION)
FIGURE 23. GERMANY CONVERTOR TRANSFORMER MARKET REVENUE, 2020–2030 ($MILLION)
FIGURE 24. FRANCE CONVERTOR TRANSFORMER MARKET REVENUE, 2020–2030 ($MILLION)
FIGURE 25. ITALY CONVERTOR TRANSFORMER MARKET REVENUE, 2020–2030 ($MILLION)
FIGURE 26. SPAIN CONVERTOR TRANSFORMER MARKET REVENUE, 2020–2030 ($MILLION)
FIGURE 27. UK CONVERTOR TRANSFORMER MARKET REVENUE, 2020–2030 ($MILLION)
FIGURE 28. REST OF EUROPE CONVERTOR TRANSFORMER MARKET REVENUE, 2020–2030 ($MILLION)
FIGURE 29. CHINA CONVERTOR TRANSFORMER MARKET REVENUE, 2020–2030 ($MILLION)
FIGURE 30. JAPAN CONVERTOR TRANSFORMER MARKET REVENUE, 2020–2030 ($MILLION)
FIGURE 31. INDIA CONVERTOR TRANSFORMER MARKET REVENUE, 2020–2030 ($MILLION)
FIGURE 32. SOUTH KOREA CONVERTOR TRANSFORMER MARKET REVENUE, 2020–2030 ($MILLION)
FIGURE 33. REST OF ASIA-PACIFIC CONVERTOR TRANSFORMER MARKET REVENUE, 2020–2030 ($MILLION)
FIGURE 34. BRAZIL CONVERTOR TRANSFORMER MARKET REVENUE, 2020–2030 ($MILLION)
FIGURE 35. SAUDI ARABIA CONVERTOR TRANSFORMER MARKET REVENUE, 2020–2030 ($MILLION)
FIGURE 36. SOUTH AFRICA CONVERTOR TRANSFORMER MARKET REVENUE, 2020–2030 ($MILLION)
FIGURE 37. REST OF LAMEA CONVERTOR TRANSFORMER MARKET REVENUE, 2020–2030 ($MILLION)
FIGURE 38. MARKET PLAYER POSITIONING, 2020
FIGURE 39. TOP WINNING STRATEGIES, BY YEAR, 2018–2021
FIGURE 40. TOP WINNING STRATEGIES, BY DEVELOPMENT, 2018–2021 (%)
FIGURE 41. TOP WINNING STRATEGIES, BY COMPANY, 2018–2021
FIGURE 42. ABB POWER SYSTEMS: R&D EXPENDITURE, 2019–2021 ($MILLION)
FIGURE 43. ABB POWER SYSTEMS: NET SALES, 2019–2021 ($MILLION)
FIGURE 44. ABB POWER SYSTEMS: REVENUE SHARE BY SEGMENT, 2021 (%)
FIGURE 45. ABB POWER SYSTEMS: REVENUE SHARE BY REGION, 2021 (%)
FIGURE 46. BHARAT HEAVY ELECTRICALS LIMITED: NET SALES, 2019–2021 ($MILLION)
FIGURE 47. BHARAT HEAVY ELECTRICALS LIMITED: REVENUE SHARE BY SEGMENT, 2021 (%)
FIGURE 48. CROMPTON GREAVES: R&D EXPENDITURE, 2018–2020 ($MILLION)
FIGURE 49. CROMPTON GREAVES: NET SALES, 2018–2020 ($MILLION)
FIGURE 50. CROMPTON GREAVES: REVENUE SHARE BY SEGMENT, 2020 (%)
FIGURE 51. GENERAL ELECTRIC: R&D EXPENDITURE, 2019–2021 ($MILLION)
FIGURE 52. GENERAL ELECTRIC: REVENUE, 2019–2021 ($MILLION)
FIGURE 53. GENERAL ELECTRIC: REVENUE SHARE BY SEGMENT, 2021 (%)
FIGURE 54. GENERAL ELECTRIC: REVENUE SHARE BY REGION, 2021 (%)
FIGURE 55. KIRLOSKAR ELECTRIC COMPANY LIMITED: NET SALES, 2019–2021 ($MILLION)
FIGURE 56. MITSUBISHI ELECTRIC: R&D EXPENDITURE, 2019–2021 ($MILLION)
FIGURE 57. MITSUBISHI ELECTRIC: NET SALES, 2019–2021 ($MILLION)
FIGURE 58. MITSUBISHI ELECTRIC: REVENUE SHARE BY SEGMENT, 2021 (%)
FIGURE 59. SIEMENS AG: R&D EXPENDITURE, 2019–2021 ($MILLION)
FIGURE 60. SIEMENS AG: NET SALES, 2019–2021 ($MILLION)
FIGURE 61. SIEMENS AG: REVENUE SHARE BY SEGMENT, 2021 (%)
FIGURE 62. SIEMENS AG: REVENUE SHARE BY REGION, 2021 (%)
FIGURE 63. TOSHIBA CORPORATION: R&D EXPENDITURE, 2019–2021 ($MILLION)
FIGURE 64. TOSHIBA CORPORATION: NET SALES, 2019–2021 ($MILLION)
FIGURE 65. TOSHIBA CORPORATION: REVENUE SHARE BY SEGMENT, 2021 (%)
FIGURE 66. TOSHIBA CORPORATION: REVENUE SHARE BY REGION, 2021 (%)
The global converter transformer market is expected to gain traction during the forecast period as a result of government regulations and investments that are aimed at developing potentially underutilized renewable resources. In addition to this, expansion of electricity distribution network across the globe and rapid industrialization in developing countries drive the market growth.
Industries such as oil & gas, mining, and marine have specialized voltage requirements, such as fire safety, which is important in these sectors. In an effort to reduce coal-based electricity generation, countries have agreed to increase the adoption of renewable energy generation in the total electricity produced. The percentage of renewable energy increases on the yearly basis. For instance, European Member states such as Germany are required to provide 10-year National Energy and Climate Plans (NECPs) that are expected to be inspected every two years. Further, countries are required to publish results in their respective national renewable energy progress reports. This leads to investments in offshore solar and wind farms that require transformers for integrating with central power grid. Such expansionist policies increase the demand for power transmission and distribution grid expansion projects. This is a major driving force for the global converter transformer market.
A. High demand for efficient power transmission solutions and increase in power generation by offshore wind farms and environmental concerns regarding high power transmission are the driving factors and opportunities in the Convertor Transformer market
A. The market value of Convertor Transformer in 2030 is expected to be US$ 7.2 Billion
A. Asia-Pacific region will provide more business opportunities for Convertor Transformer in future
A. ABB Power Systems, General Electric, Siemens AG, Crompton Greaves, Bharat Heavy Electricals Limited, Toshiba Corporation, Kirloskar Electric Company Limited, Shadong Power Equipment Company Limited, Mitsubishi Electric, and XIAN XD Transformer Co. Ltd.
A. Agreement, partnership and business expansion are the key growth strategies of Convertor Transformer market players
Start reading instantly.
This Report and over 13,000+ thousand more Reports, Available with Avenue Library. T&C*.
Enterprise
License/PDF
*Taxes/Fees, if applicable will be added during checkout. All prices in USD
To ensure high-level data integrity, accurate analysis, and impeccable forecasts
For complete satisfaction
On-demand customization of scope of the report to exactly meet your needs
Targeted market view to provide pertinent information and save time of readers
Get insights on topics that are crucial for your business. Stay abreast of your interest areas.
To ensure high-level data integrity, accurate analysis, and impeccable forecasts
For complete satisfaction
On-demand customization of scope of the report to exactly meet your needs
Targeted market view to provide pertinent information and save time of readers