
Copper Chemicals Market Research, 2032
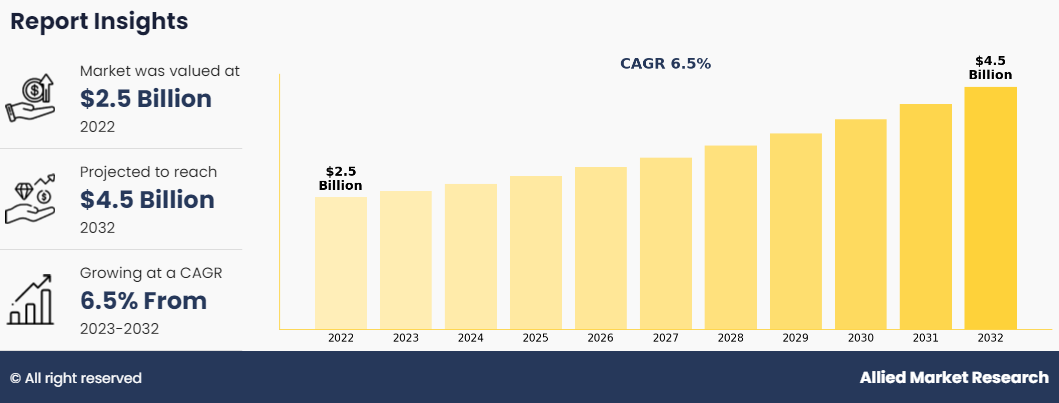
The global copper chemicals market was valued at $2.5 billion in 2022, and is projected to reach $4.5 billion by 2032, growing at a CAGR of 6.5% from 2023 to 2032. The rise in demand for agrochemicals and the rise in demand for copper chemicals from the mining industry is poised to significantly drive the growth of the copper chemicals market.
Copper chemicals refer to compounds containing copper ions, utilized in various industries including agriculture, electronics, and manufacturing. These chemicals include a wide range of substances such as copper sulfate, copper oxide, and copper carbonate. They exhibit diverse properties, including high thermal and electrical conductivity, corrosion resistance, and antimicrobial activity, making them valuable in applications such as fungicides, catalysts, and pigment production. In addition, copper chemicals play a crucial role in agriculture as micronutrients for plant growth and in electronics for circuitry fabrication.
Report Key Highlighters:
- Quantitative information mentioned in the global copper chemicals market includes the market numbers in terms of value ($Million) and volume (Kilotons) concerning different segments, pricing analysis, annual growth rate, CAGR (2023-32), and growth analysis.
- The analysis in the report is provided on the basis of type, application, and region. The study is expected to contain qualitative information such as the market dynamics (drivers, restraints, opportunities), Porter’s Five Force Analysis, key regulations across the region, and value chain analysis.
- A few companies, including Pan-Continental Chemical Co., Ltd., Noah Chemicals, Sumitomo Metal Mining Co., Ltd., Syngenta AG, hold a large proportion of the Copper chemicals market.
- This report makes it easier for existing market players and new entrants to the copper chemicals business to plan their strategies and understand the dynamics of the industry, which helps them make better decisions.
Market Dynamics
The rise in demand for agrochemicals is expected to drive the growth of the copper chemicals market. Agrochemicals, including fertilizers and pesticides, play a crucial role in enhancing agricultural productivity to meet the rising global food demand. Copper chemicals are widely utilized in the formulation of fungicides and bactericides used in agriculture, as copper compounds exhibit effective antimicrobial properties. With the expanding population and shrinking arable land, there's a growing need for agrochemicals to improve crop yields and safeguard against crop diseases.
According to the UNFAO (United Nation Food and Agriculture Organization), the global food demand is expected to increase by 40.0% by 2050, owing to the significant surge in the global population, especially in developing economies such as China and India. Furthermore, due to the growing global population, the global food production needs are expected to increase by around 70.0% by 2050 to meet the growing food demand. This will increase the demand for agrochemicals. Consequently, this surge in agrochemical usage directly translates to heightened demand for copper chemicals. Moreover, the push towards sustainable agricultural practices, which often involve reduced chemical inputs and increased organic farming, further highlights the importance of copper-based solutions due to their relatively low environmental impact compared to other chemical alternatives. As a result, the copper chemicals market is poised to witness significant growth, driven by the expanding agricultural sector's need for effective crop protection solutions.
Rise in demand copper chemicals from the mining industry is poised to significantly drive the growth of the copper chemicals market. As a vital component in various stages of the mining process, copper chemicals play essential roles in extraction, beneficiation, and processing activities. In mining operations, copper chemicals are primarily utilized in flotation processes to separate valuable minerals from gangue materials, thereby enhancing the efficiency of ore recovery. In addition, these chemicals find applications in mineral processing, where they facilitate the extraction of copper and other metals from ores through leaching, solvent extraction, and electro-winning processes. With rise demand for metals such as copper globally, driven by industrialization, infrastructure development, and the transition to renewable energy sources, the mining industry is experiencing heightened activity.
In addition, rise in mining operations and increased investments in the mining industry are expected to drive the market expansion of copper chemicals during the forecast period. The International Energy Agency (IEA) projected those global investments in the coal supply chain amounted to $115 billion by 2022. It was projected that $80 billion would be invested by China and India. China and India were the world's two biggest producers of coal in 2021. In these two countries, thermal power generation made up more than 80% of the total power generation capacity. As a result, manufacturers of copper chemicals are expected to witness a surge in demand from the mining sector, leading to the expansion of the copper chemicals market.
Health risks associated with exposure to certain copper compounds pose a significant challenge to the growth of the copper chemicals market. Copper compounds such as copper sulfate, copper oxide, and copper carbonate can have adverse effects on human health when encountered in high concentrations or through prolonged exposure. Inhalation or ingestion of copper dust, fumes, or vapors may lead to respiratory issues, gastrointestinal problems, and skin irritation. Chronic exposure to copper compounds has been linked to more severe health conditions such as liver and kidney damage, neurological disorders, and carcinogenic effects. In addition, occupational exposure among workers in industries utilizing copper chemicals, such as agriculture, mining, and manufacturing, presents a notable concern. Stringent regulatory measures aimed at limiting exposure levels and enforcing safety protocols further increase these challenges for copper chemical producers. Thus, heightened awareness of health risks associated with copper compounds, coupled with regulatory pressures, is expected to deter their use in various applications, impacting the growth prospects of the copper chemicals market.
To mitigate these concerns, industry stakeholders must prioritize R&D efforts towards safer alternatives and invest in robust safety measures to minimize health risks associated with copper chemical exposure. To manage these heath risks, some regulatory actions have been taken by the government, for instance, The U.S. Environmental Protection Agency (EPA) has set an MCLG for copper in drinking water at 1.3 mg Cu/L. This level is based on acute gastrointestinal effects observed in nurses exposed to elevated copper levels. The goal is to protect against adverse health effects while considering background dietary exposures.
The utilization of copper chemicals in pharmaceutical formulations presents a highly lucrative opportunity for the growth of the copper chemicals market. Copper compounds exhibit significant antimicrobial properties, making them invaluable in pharmaceutical applications aimed at combating infections and promoting wound healing. Copper-based formulations are increasingly being incorporated into topical treatments, wound dressings, and antimicrobial coatings due to their ability to inhibit the growth of various pathogens, including bacteria, viruses, and fungi. Moreover, copper chemicals have gained attention in skincare formulations for their antioxidant properties and role in stimulating collagen production, contributing to anti-aging treatments. In addition, research into the therapeutic potential of copper compounds in areas such as cancer treatment and neurodegenerative diseases further drives the demand for copper chemicals in pharmaceuticals.
The increasing prevalence of chronic diseases and the aging population are expected to drive demand for innovative pharmaceuticals, leading to growth in the pharmaceutical industry. For instance, in 2023, the American Cancer Society reported 1.93 million new cancer cases in the United States, up from 1.9 million in 2022. Additionally, according to the Centers for Disease Control's National Diabetes Statistics Report for 2022, diabetes prevalence in the United States reached 37.3 million in 2022. These global trends in chronic diseases are forecasted to boost pharmaceutical demand and consequently, stimulate growth in pharmaceutical manufacturing.
Furthermore, Australia estimated an increase in lung cancer cases from 14,529 in 2022 to 14,800 in 2023, as per the Australian Institute of Health and Welfare. Moreover, pharmaceutical companies are focusing on expansion and making significant investments to enhance production. For instance, in December 2023, Piramal Pharma Solutions invested $ 57.15 million (GBP 45 million) in a new manufacturing facility in Scotland, UK, to produce antibody-drug conjugates (ADC). This investment strengthened the company's ADC manufacturing capabilities.
Similarly, in April 2022, Ferring Pharmaceuticals inaugurated an integrated R&D and manufacturing facility in Hyderabad with a total investment of $ 31.78 million (EUR 30 million). This facility primarily aims to accelerate the production of solid dosage formulations. Hence, the projected growth in the pharmaceutical industry, driven by factors such as aging populations, increased healthcare spending, and the prevalence of chronic diseases, is poised to fuel the demand for copper chemicals in the foreseeable future, positioning it as a vital component in pharmaceutical manufacturing supply chains.
As the demand for effective antimicrobial agents and innovative medical treatments continues to rise, the pharmaceutical industry's reliance on copper chemicals is poised to grow significantly, offering growth opportunities for manufacturers and suppliers in the copper chemicals market.
Segment Overview
The copper chemicals market is segmented into type, application, and region. By type, the market is divided into copper sulphate, copper oxychloride, cupric oxide, cuprous chloride, basic copper carbonate, cupric chloride, and others. By application, it is categorized into agriculture, mining and metallurgy, ceramic, paints, textile, and others. Region-wise, the market is studied across North America, Europe, Asia-Pacific, and LAMEA.

The copper sulphate segment accounted for the largest share in 2022. The increasing demand for copper sulfate in the copper chemicals market can be attributed to several factors. Its wide application across various industries, including agriculture, mining, and electronics, contributes to its growing need. Furthermore, the expanding agricultural sector, particularly in developing countries, relies on copper sulfate as a key component in fungicides and pesticides. Additionally, its usage in electroplating and as a catalyst in chemical processes further drives demand. Moreover, the rise in infrastructure development projects global fuels the need for copper sulfate-based products, indicating a sustained growth trajectory in the market.
In North America, particularly in the U.S., the electronics industry is predicted to increase considerably. According to the Consumer Technology Association (CTA), the U.S. consumer technology sector is predicted to generate $ 505 billion in retail sales revenue by the end of this year, representing a 2.8% increase over 2021's 9.6% gain over 2020. The market is likely to expand in the future as demand for new technology items rises.
According to the JEITA (Japan Electronics and Information Technology Industries Association), total global electronics and IT production increased by 11% year on year in 2021 to $3,415.9 billion. Thus, this factor is projected to boost demand for copper compounds used in the electronics industry.
Copper Oxychloride is expected to register the highest CAGR of 7.3%. The demand for copper oxychloride in the copper chemicals market is propelled by several factors. These include its effectiveness as a fungicide and bactericide in agricultural applications, its use in the production of pigments and coatings, and its role in wood preservation. Additionally, increasing awareness about sustainable agricultural practices and the growing demand for high-quality crops further drive its utilization. Inadequate arable land has put farmers under pressure to raise yields. According to the World Bank, by 2050, farmers may need to increase yields by 50% per hectare. Using agrochemicals like fungicides can significantly enhance yields. The copper oxychloride segment is expected to grow rapidly, driven by government assistance for agrochemicals.

The agriculture segment accounted for the largest share in 2022. The increasing demand for copper chemicals in agriculture applications can be attributed to several factors. The rise in global population necessitates higher food production, driving the need for efficient crop protection solutions. Additionally, the growing awareness and adoption of sustainable agricultural practices favor the use of copper chemicals due to their effectiveness in controlling various pests and diseases while minimizing environmental impact. For instance, in May 2022, the Union Ministry of Agriculture and Farmers' Welfare announced that the nation's foodgrain production is projected to reach a record 314.51 metric tons, marking an increase of 3.77 metric tons compared to the previous year, 2020-21. This estimate also exceeds the average production of the preceding five years (2016-17 to 2020-21) by 23.80 metric tons.
Ceramic is expected to register the highest CAGR of 7.1%. The demand for copper chemicals in ceramic applications is increasing due to several factors. The growing popularity of ceramic products in construction, electronics, and automotive industries drives the need for copper-based glazes and pigments. For instance, in India, the smart cities mission is a major project undertaken by the government, which will construct more than 100 smart cities all over the country to achieve rapid urbanization in the country. In the budget 2021-2022, the smart cities mission was given $864.5 million as compared to $455.7 million in 2020-2021.
Moreover, in Germany, the increasing migration to the country has been stimulating the demand for new residential construction. Around 3.6 million migrants were expected to arrive in Germany by the end of 2020-2021, requiring at least 350,000 new dwellings per year. The demand for ceramics is anticipated to surge owing to the growing construction industry across the globe, which is expected to drive the demand for copper chemicals during the forecast period. Additionally, the rising focus on sustainable and eco-friendly manufacturing processes encourages the use of copper chemicals as they offer efficient coloration and antimicrobial properties, meeting evolving consumer preferences.

Asia-Pacific garnered the largest share in 2022. The increasing demand for copper chemicals in the Asia-Pacific region can be attributed to several factors. Rapid industrialization, particularly in countries like China and India, drives the need for copper-based products in agriculture, electronics, and construction sectors. Additionally, the growth of urbanization and infrastructure projects further bolsters demand, while advancements in technology fuel the use of copper chemicals in various applications, sustaining market expansion.
China's transportation infrastructure is expanding rapidly. For example, in 2022, China's State Council issued the 14th five-year plan to improve its transportation infrastructure. The plan aims to construct and strengthen roads, trains, ports, and canals, as well as the technology and human capital required for the transportation industry. The country places a strong priority on transportation infrastructure development. China currently possesses eight vertical (north-south) and eight horizontal (east-west) high-speed railways, while bottlenecks in regular-speed railways have been addressed.
Competitive Analysis
The major players operating in the global copper chemicals market are Pan-Continental Chemical Co., Ltd., Noah Chemicals, Sumitomo Metal Mining Co., Ltd., Syngenta AG, Bayer AG, William Blythe Ltd, Jost Chemical Co., PERRYCHEM, Shyam Chemicals Pvt. Ltd., and Parikh Entreprises Pvt. Ltd.
Other players include SHEPHERD CHEMICALS, TIB Chemicals AG, American Chemet Corporation, Pan-Continental Chemical Co., Ltd., American Elements, Meghachem, and Kidarnath Chemical Co.
Key Benefits For Stakeholders
- This report provides a quantitative analysis of the market segments, current trends, estimations, and dynamics of the copper chemicals market analysis from 2022 to 2032 to identify the prevailing copper chemicals market opportunities.
- The market research is offered along with information related to key drivers, restraints, and opportunities.
- Porter's five forces analysis highlights the potency of buyers and suppliers to enable stakeholders make profit-oriented business decisions and strengthen their supplier-buyer network.
- In-depth analysis of the copper chemicals market segmentation assists to determine the prevailing market opportunities.
- Major countries in each region are mapped according to their revenue contribution to the global market.
- Market player positioning facilitates benchmarking and provides a clear understanding of the present position of the market players.
- The report includes the analysis of the regional as well as global copper chemicals market trends, key players, market segments, application areas, and market growth strategies.
Copper Chemicals Market Report Highlights
| Aspects | Details |
| Market Size By 2032 | USD 4.5 billion |
| Growth Rate | CAGR of 6.5% |
| Forecast period | 2022 - 2032 |
| Report Pages | 250 |
| By Type |
|
| By Application |
|
| By Region |
|
| Key Market Players | Parikh Entreprises Pvt. Ltd., Jost Chemical Co., William Blythe Ltd., Shyam Chemicals Pvt. Ltd., Bayer AG, Noah Chemicals, Pan-Continental Chemical Co., Ltd., Syngenta AG, Sumitomo Metal Mining Co., Ltd., PERRYCHEM |
Analyst Review
According to the insights of the CXOs of leading companies, the growing demand for copper chemicals in agriculture, mining, and various industrial applications due to their effectiveness in controlling pests, diseases, and enhancing plant growth is driving the growth of the market. In addition, rise in emphasis on sustainable agricultural practices propels the adoption of copper-based fungicides and bactericides as alternatives to synthetic chemicals, fostering market growth. Moreover, technological advancements in copper chemical production processes, such as the development of eco-friendly synthesis methods, contribute to the market expansion.
However, the market faces restraints including fluctuation of raw material prices, particularly copper metal, which significantly impact the overall production costs and profitability of copper chemicals. Regulatory constraints related to environmental regulations and safety standards pose challenges to manufacturers, requiring compliance measures that may add to operational costs. Furthermore, the potential environmental impact of copper chemical usage, including soil contamination and toxicity concerns, raises scrutiny from regulatory bodies and environmental organizations, potentially impeding the market growth.
The CXOs further added that rise in demand for copper chemicals in emerging economies, where agricultural intensification and industrial development drive the need for effective crop protection and industrial processes, is expected to offer lucrative opportunities for the market growth. In addition, innovations in copper chemical formulations, such as nanotechnology-based solutions, offer growth opportunities for market players to differentiate their products and capture new market segments. Strategic partnerships and collaborations for R&D initiatives further enhance the growth prospects for the copper chemicals industry, fostering innovation and market expansion.
The copper chemicals market attained $2.5 billion in 2022 and is projected to reach $4.5 billion by 2032, growing at a CAGR of 6.5% from 2023 to 2032.
Government initiatives aimed at promoting domestic manufacturing of agrochemicals is the upcoming trend of Copper Chemicals Market in the world.
The rise in demand for agrochemicals and the rise in demand for copper chemicals from the mining industry are the drivers of the of the Copper Chemicals Market.
Agriculture is the leading application of Copper Chemicals Market.
The major players operating in the global copper chemicals market are Pan-Continental Chemical Co., Ltd., Noah Chemicals, Sumitomo Metal Mining Co., Ltd., Syngenta AG, Bayer AG, William Blythe Ltd, Jost Chemical Co., PERRYCHEM, Shyam Chemicals Pvt. Ltd., and Parikh Entreprises Pvt. Ltd.
Asia-Pacific is the largest regional market for Copper Chemicals.
Loading Table Of Content...
Loading Research Methodology...

