
Cordless Power Tools Market Research, 2033
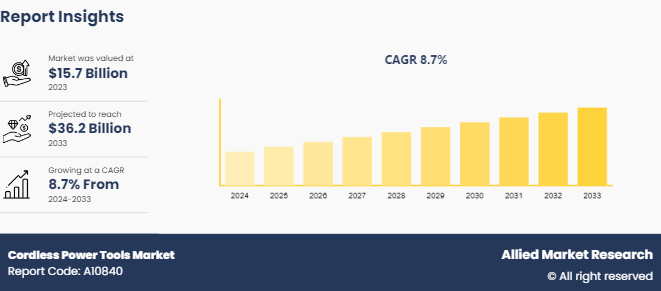
The global cordless power tools market size was valued at $15.7 billion in 2023, and is projected to reach $36.2 billion by 2033, growing at a CAGR of 8.7% from 2024 to 2033.
Market Introduction and Definition
Cordless power tools are battery-operated devices used in construction, DIY projects, and maintenance tasks, offering the advantage of mobility without the need for a power outlet. Their portability allows for use in remote or outdoor locations and tight spaces where cords would be impractical. These tools eliminate the need for extension cords, reducing setup time and minimizing tripping hazards, thereby enhancing safety. Advances in battery technology, particularly with lithium-ion batteries, have significantly improved their efficiency, power, and longevity, resulting in longer run times and quicker recharges. The ergonomic design of cordless tools reduces user fatigue, making them more comfortable for prolonged use. Furthermore, many cordless tools feature interchangeable batteries, adding to their versatility and cost-effectiveness. The convenience, safety, and technological advancements of cordless power tools make them indispensable for both professional tradespeople and home improvement enthusiasts.
Key Takeaways
- The cordless power tools market studies more than 23 countries. The analysis includes a country-by-country breakdown analysis in terms of value ($billion) available from 2023 to 2033.
- The research combined high-quality data, professional opinion, and research, with significant independent opinion. The research methodology aims to provide a balanced view of the global market, and help stakeholders make educated decisions to achieve ambitious growth objectives.
- The research reviewed more than 3, 700 product catalogs, annual reports, industry descriptions, and other comparable resources from leading industry players to gain a better understanding of the market.
- The cordless power tools market share is marginally fragmented, with players such as DeWalt Industrial Tool Company, Makita Corporation, Robert Bosch GmbH, Milwaukee Electric Tool Corporation, Ryobi Limited, Black & Decker Corporation, Ridgid (Emerson Electric Co.) , Koki Holdings Co., Ltd. (Metabo HPT) , Festool GmbH, and Porter-Cable (Stanley Black & Decker, Inc.) . Major strategies such as product launch, partnerships, expansion, and other strategies of players operating in the market are tracked and monitored.
Industry Trends:
Advancements in Battery Technology
- Lithium-Ion Batteries: Ongoing improvements in lithium-ion battery technology are resulting in longer run times, faster charging, and greater power output. High-capacity and more durable batteries are becoming standard, enhancing tool performance and efficiency.
- Brushless Motors: Tools with brushless motors are becoming more popular due to their efficiency, longer lifespan, and reduced maintenance compared to brushed motors.
Increased Integration of Smart Technology
- Connectivity Features: Many cordless tools now include Bluetooth and Wi-Fi capabilities, allowing users to connect to apps for tool tracking, battery management, and performance monitoring.
- IoT Integration: Integration with the Internet of Things (IoT) is enabling real-time data collection and remote control of tools, enhancing productivity and safety on job sites.
Key Market Dynamics
The market for cordless power tools is currently driven by several key factors. Technological advancements in battery technology, particularly in lithium-ion batteries, are revolutionizing these tools, making them more powerful and reliable for both professionals and DIY enthusiasts alike. The growing adoption of cordless tools in sectors such as construction and automotive underscores their portability, power, and versatility, meeting stringent industry demands. Simultaneously, the surge in DIY culture and home improvement projects, influenced by social media and televised shows, is fueling demand among homeowners and hobbyists seeking user-friendly, affordable options. However, high initial costs remain a significant restraint, posing a challenge for budget-conscious consumers and small businesses looking to invest in these efficient tools. It is expected that the prices of these tools will reduce during the Cordless Power Tools Market forecast period owing to constant technological advancements. Nevertheless, the industry sees promising opportunities in emerging markets, where rapid infrastructure development is creating new avenues for Cordless Power Tools Market growth and expansion, allowing manufacturers to reach untapped customer bases and bolster their global presence.
Market Segmentation
The cordless power tools market is segmented into product type, motor type, and end user. By products type, it is categorized into Drilling and Fastening Tools, Sawing and Cutting Tools, Demolition Tools, Material Removal Tools, and Garden Tools. By motor type, it is bifurcated into Brushed Motor and Brushless Motor. By end user, it is classified into Construction, DIY, Gardening, Industrial, and Others. Region wise, the market is analyzed across North America, Europe, Asia-Pacific, and Latin America, and Middle East & Africa.
Regional/Country Market Outlook
The global Cordless Power Tools Industry displays a diverse regional outlook. North America and Europe lead with advanced technological adoption and robust construction sectors driving demand for high-performance tools. In Asia-Pacific, rapid urbanization and infrastructure development propel significant market expansion, particularly in China, India, and Southeast Asia where there's a growing preference for efficient, portable tools across diverse industrial sectors. Latin America shows potential amidst increasing construction activities, while the Middle East and Africa see demand driven by infrastructure projects despite varying economic conditions. Overall, while mature markets like North America and Europe emphasize technological advancements, emerging regions in Asia-Pacific, Latin America, and Africa present promising growth opportunities fueled by urbanization and industrial development.
Industry Developments
- In February 2022, Ryobi, a brand under TTI, introduced a new series of 2 AH rechargeable lithium-ion batteries designed for handheld tools. These batteries feature a USB-C port, eliminating the need for custom battery chargers. Ryobi plans to deploy this USB lithium line in tools such as cordless screwdrivers, power cutters, power carvers, and rotary tools.
- In December 2021, Stanley Black & Decker Inc. completed the acquisition of outdoor power equipment companies Excel Industries and MTD Holdings. This strategic acquisition bolstered the company's presence in the cordless electric outdoor power equipment sector, leveraging brands such as CRAFTSMAN, BLACK+DECKER, and DEWALT to enhance its market position.
- In January 2022, Makita expanded its XGT CORDLESS tools lineup with 9 new additions, including outdoor power equipment, lighting solutions, and concrete tools. Among these releases are cordless chainsaws equipped with brushless motors, a brushless concrete vibrator for concrete applications, and a high-performance cordless impact driver for fastening tasks.
- In July 2020, Bosch and Husqvarna Group's Gardena division formed an alliance to establish the Power for All Alliance. This collaboration, which incorporates Bosch's battery technology, aims to create a multi-vendor battery system powering various household products. The alliance includes participation from other renowned brands, fostering a strong foundation for cooperative efforts.
Competitive Landscape
The major players operating in the cordless power tools market include as DeWalt Industrial Tool Company, Makita Corporation, Robert Bosch GmbH, Milwaukee Electric Tool Corporation, Ryobi Limited, Black & Decker Corporation, Ridgid (Emerson Electric Co.) , Koki Holdings Co., Ltd. (Metabo HPT) , Festool GmbH, and Porter-Cable (Stanley Black & Decker, Inc.) .
Key Sources Referred
- Power Tool Institute (PTI) : PTI is a trade association based in North America representing power tool manufacturers. It focuses on advocating for safety standards, regulatory policies, and technological innovations in the power tool industry.
- European Power Tool Association (EPTA) : EPTA represents power tool manufacturers across Europe. It works to harmonize standards, promote sustainable practices, and enhance market competitiveness for European manufacturers.
- Japan Electric Tool Manufacturers' Association (JETMA) : JETMA is an association in Japan that represents electric tool manufacturers. It aims to advance technological developments, ensure product safety, and strengthen the competitiveness of Japanese manufacturers in the global market.
- Outdoor Power Equipment Institute (OPEI) : Although primarily focused on outdoor power equipment, OPEI also includes manufacturers of cordless tools. It advocates for industry standards, environmental regulations, and safety protocols related to power equipment and tools.
Key Benefits For Stakeholders
- This report provides a quantitative analysis of the cordless power tools market segments, current trends, estimations, and dynamics of the cordless power tools market analysis from 2023 to 2033 to identify the prevailing cordless power tools market opportunities.
- The market research is offered along with information related to key drivers, restraints, and opportunities.
- Porter's five forces analysis highlights the potency of buyers and suppliers to enable stakeholders make profit-oriented business decisions and strengthen their supplier-buyer network.
- In-depth analysis of the cordless power tools market segmentation assists to determine the prevailing Cordless Power Tools Market opportunity.
- Major countries in each region are mapped according to their revenue contribution to the global cordless power tools market statistics.
- Market player positioning facilitates benchmarking and provides a clear understanding of the present position of the market players.
- The report includes the analysis of the regional as well as global cordless power tools market trends, key players, market segments, application areas, and market growth strategies.
Cordless Power Tools Market Report Highlights
| Aspects | Details |
| Market Size By 2033 | USD 36.2 Billion |
| Growth Rate | CAGR of 8.7% |
| Forecast period | 2024 - 2033 |
| Report Pages | 234 |
| By Product Type |
|
| By Motor Type |
|
| By End User |
|
| By Region |
|
| Key Market Players | Porter-Cable (Stanley Black & Decker, Inc.), Ridgid (Emerson Electric Co.), Koki Holdings Co., Ltd. (Metabo HPT), Makita Corporation, Robert Bosch GmbH, DeWalt Industrial Tool Company, Black & Decker Corporation, Ryobi Limited, Milwaukee Electric Tool Corporation., Festool GmbH & Co. KG |
The global cordless power tools market was valued at $15.7 billion in 2023 and is projected to reach $36.2 billion by 2033, growing at a compound annual growth rate (CAGR) of 8.7% from 2024 to 2033.
Key factors include rapid infrastructure development, technological advancements in battery efficiency, and the increasing popularity of DIY projects among consumers.
Rising popularity of Do-It-Yourself concept is expected to be a major market driver in the coming years.
Drilling and Fastening Tools segment is the leading product type of Cordless Power Tools Market.
Asia-Pacific is the largest regional market for Cordless Power Tools.
The cordless power tools market was valued at $15.7 billion in 2023.
Key Players in the market are DeWalt Industrial Tool Company, Makita Corporation, Robert Bosch GmbH, Milwaukee Electric Tool Corporation, Ryobi Limited, Black & Decker Corporation, Ridgid (Emerson Electric Co.), Koki Holdings Co., Ltd. (Metabo HPT), Festool GmbH, and Porter-Cable (Stanley Black & Decker, Inc.).
Loading Table Of Content...

