0
2022
Corrugators Market

Corrugators Market

by Type (Automatic, Manual), by Production Capacity (Less than 10 ton, 11-50 ton, 51-100 ton, More than 100 ton), by End User (Food and Beverages, Electronics, Pharmaceuticals, Logistics and Shipping, Others): Global Opportunity Analysis and Industry Forecast, 2021-2031

Report Code: A09630
Dec 2022 | Pages: 289
Tables: 139
Charts: 57
  • Formats*:

  • pdf

    Single User License, Five User
    License & Enterprise User License

  • xls

    Data Pack Excel License

  • ppt

    It comes with the additional cost
    of $2500.00 contact sales.


Corrugators Market Research, 2031

The global corrugators market size was valued at $2.7 billion in 2021, and is projected to reach $4.2 billion by 2031, growing at a CAGR of 4.2% from 2022 to 2031. The corrugators market primarily includes manufacturers and users of machines that are responsible for producing corrugated paperboards. Corrugation is a process of pressing paper sheets into a wave-like shape known as ‘flutes’, which is sandwiched and glued between two plain paper sheets. The corrugated boards are very strong and have high tensile strength, making it suitable for industrial applications mostly for box packaging. 
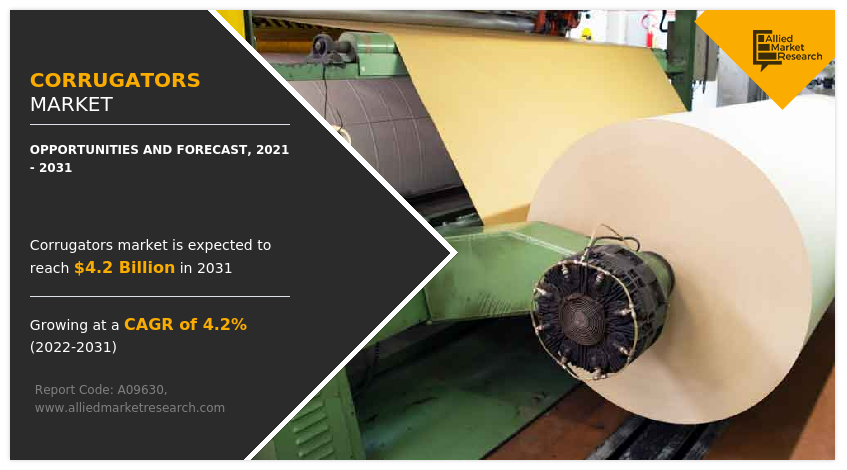
The corrugators market was severely hampered during the lockdown period owning to the outbreak of COVID-19. The end-users of corrugators i.e., food & beverages, logistics & supply chain, and other industries were severely affected. However, the market recovered by the end of 2021.

Corrugators Market

Market Dynamics 

The corrugators market has been witnessing rapid growth for the past few decades, largely due to increase in industrialization, and increased demand for sustainable packaging boxes from industries such as food and beverages, pharmaceuticals, logistics & supply chain, FMCG, and others. Furthermore, e-commerce along with the traditional retail industry is experiencing growth, with the rise in disposable income of people, which is also positively influencing the corrugators market outlook. In addition, various benefits associated with online purchases, such as ease of buying, the option to choose products at a discounted rate, and others are also playing important role in driving the growth of the e-commerce sector. For instance, the quarterly U.S. retail e-commerce sales as a percent of total quarterly retail sales increased to more than 14% in 2022, which was only 6% in 2013. Boxes made from corrugated paperboards are sturdy enough to hold heavy, delicate, fragile, and other types of products that are typically bought online. As a result of the growth in e-commerce and the retail sector, the demand for corrugated boxes has increased, which is positively affecting the market. Various companies such as U Pack, CANPAC, Packman Packaging Private Limited, and others offer a wide range of corrugated boxes for e-commerce and other industrial applications. Furthermore, the corrugated boxes produced by corrugator machines are typically made with recycled paper, if not, it is made with naturally occurring products such as sugarcane bagasse, trees, bamboo, and others. Therefore, producing the packaging requires less energy, and the use of organic materials reduces the carbon footprint of this packaging. Furthermore, these raw materials can be sourced locally; thereby, reducing the energy required for transportation. Moreover, according to UN Environment Programme, around 36% of all plastics produced are used for packaging purpose, out of which 85% or 400 million tones ends up in landfills or as unregulated waste. 98% of single-use plastic products are produced from fossil fuels, resulting in increased greenhouse gas emissions. Therefore, authorities in various countries such as U.S., UK, India, and others have restricted or banned the use of single-use plastic to safeguard the earth’s environment and achieve sustainability. Furthermore, governments in developing countries such as India, Argentina, China, Vietnam, Indonesia, and Brazil have introduced initiatives and policies that aim to foster the growth of the manufacturing and other industrial sectors in the respective countries. For instance, in October 2022, Argentina launched a $3.2 billion scheme called ‘Argentine Credit Programme’. This is done to help grow SMEs and large industrial and agro-industrial companies for investments and import substitution projects. Corrugated paperboards are widely used in the industrial sector in form of corrugated packaging; thus, the growth of the industrial sector is expected to positively influence the corrugators market. For instance, in November 2022, JK Paper an India-based business in the paper and pulp industry entered into Share Purchase and Shareholders' Agreements (SPSHAs) for the acquisition of 85% shares of Horizon Packs and Securipax Packaging, both of which are the major businesses dealing in corrugated packaging. 

However, fluctuations in the raw material prices are anticipated to restrain the corrugators market growth. Steel, the material primarily used for the production of corrugators machines is witnessing major fluctuations in the prices, owing to economic turmoil in the world. In addition, fluctuations in the prices of paper and pulp is a major obstruction for new businesses to enter the corrugated paperboard market; thereby, restraining the market growth. 

The demand for corrugator machines decreased in 2020, owing to low demand for corrugated paper, and paperboard from different industries due to lockdowns imposed by the government of many countries. The COVID-19 pandemic had shut-down the production of various products for the corrugated paperboard end-user. This has hampered the growth of the corrugators market significantly during the pandemic. The major demand for corrugators was previously noticed from giant manufacturing countries including the U.S., Germany, Italy, the UK, and China, which were badly affected by the spread of coronavirus, thereby halting demand for corrugators. However, owing to the introduction of various vaccines, the severity of the COVID-19 pandemic has significantly reduced. This has led to the full-fledged reopening of corrugator machine manufacturing companies, and their end user sector at their full-scale capacities. Furthermore, it has been more than two years since the outbreak of this pandemic, and many companies have already shown notable signs of recovery. Contrarily, as of end-2022, the number of Covid-19 infection cases are surging again, especially in China, this has brought negative sentiments in the market, which may have negative impact on the corrugators market. 

Segmental Overview 

The corrugators market is segmented on the basis of type, production capacity, end-user, and region. By paper type, it is divided into automatic and manual.  By production type, the market is categorized into less than 10 ton, 11-50 ton, 51-100 ton, and more than 100 ton. By end-user, it is classified into food & beverages, electronics, pharmaceuticals, logistics & shipping, and others. By region, it is analyzed across North America, Europe, Asia-Pacific, and LAMEA. 
Corrugators Market

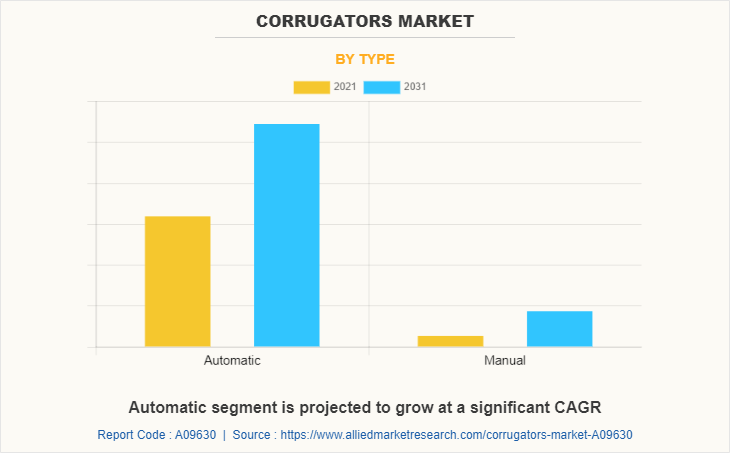
By type: The corrugators market is bifurcated into automatic and manual. In 2021, the automatic corrugator machine segment dominated the market, in terms of revenue, and the same is expected to grow with a higher CAGR during the forecast period. The automatic corrugator machine segment includes the machines that function autonomously with little to no input from the operator. Companies such as Mitsubishi Heavy Industries, Ltd., and BW Papersystems, along with others offer automatic corrugator lines/machines. The productivity of automatic corrugator machines is substantially high, as they function autonomously. In addition to this, the elimination of human intervention significantly decreases the possibility of human error in the end product. Moreover, manual corrugator machines witness a slow yet positive demand from the small- and medium-scale industries. 
Corrugators Market

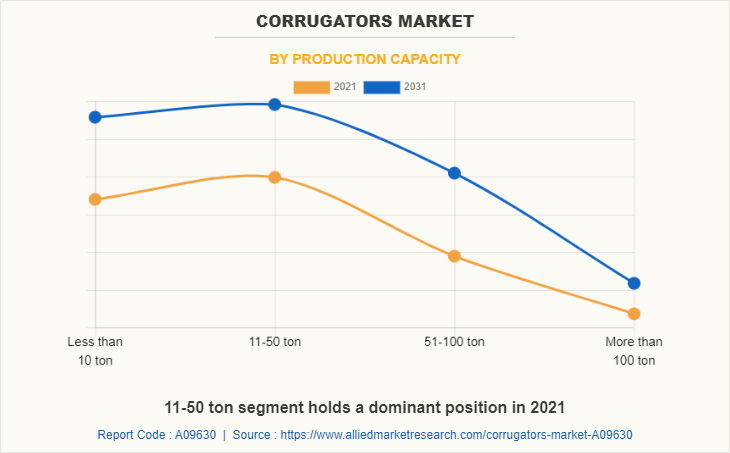
By production capacity: The corrugators market on the basis of production capacity is categorized into less than 10 ton, 11-50 ton, 51-100 ton, and more than 100 ton. The 11-50 ton segment accounted for a higher revenue in 2021. The 51-100 ton segment is expected to grow with the highest CAGR during the forecast period. The corrugator machine with 11-50 ton production capacity is widely demanded by the Small- and medium-scale industries owing to the smaller order volumes they receive. The increasing demand for corrugated paperboard from growing end-user industries is expected to positively influence this segment. Moreover, the higher growth rate for machines with 51-100 ton production capacity is attributed to growth in large scale industries. 
Corrugators Market

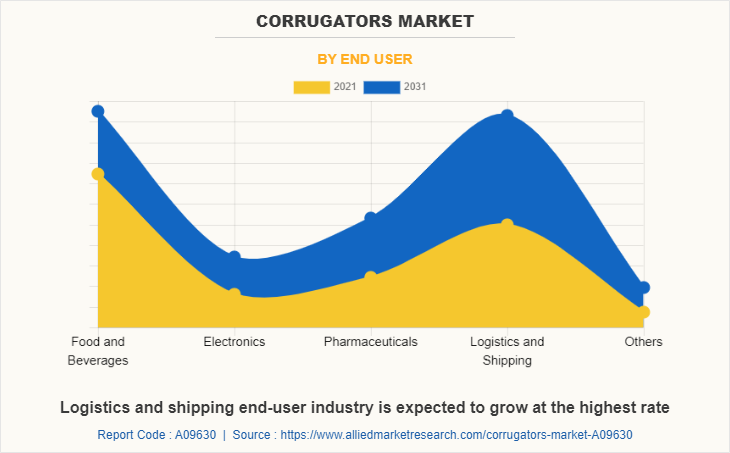
By end-user: On the basis of end-user, the corrugators market is classified into food & beverages, electronics, pharmaceuticals, logistics & shipping, and others. The food and beverages segment dominated the market in 2021, and the logistics & supply chain segment is expected to grow with the highest CAGR during the forecast period. The food and beverages industry is significantly large owing to a larger number of people who consume fast-food, order food online, and the rising global trade of food. This has been a profound reason for the introduction of various food grade corrugated packaging made form corrugated paper boards. For instance, Stora Enso, a leading provider of renewable products in packaging offers a wide range of corrugated box packaging for food and beverages. Moreover, increasing disposable income, rising industrialization, and rising globalization are playing a crucial role in the growth of the logistics & supply-chain industry. For instance, in June 2022, Delhivery, a logistic giant announced plans to expand its infrastructure in Mumbai, and Bangalore, two key cities of India by collaborating with Welspun. 
Corrugators Market

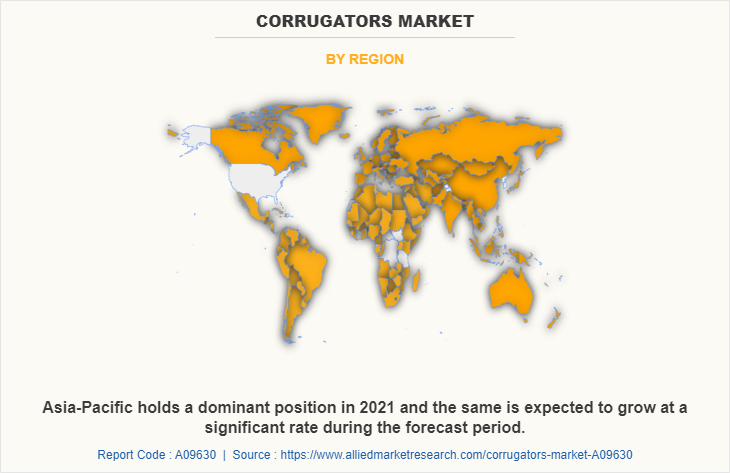
By region: The market is analyzed across North America, Europe, Asia-Pacific, and LAMEA. Asia-Pacific accounted for the highest corrugators market share in 2021, and the same is anticipated to secure the leading position during the forecast period, due to the high growth potential of the manufacturing sector including food and beverages, electrical and electronics, healthcare, and other industries. India, China, and Vietnam are a few of the major manufacturing hubs in Asia-Pacific, owing to relatively easy statutory guidelines. Therefore, major players are striving to develop manufacturing units in these markets to improve production quantities as well as serve the industries in Asia-Pacific. Moreover, various government initiatives to ban or restrict the usage of single-use plastic products and bags are also playing a crucial role in driving the growth of the corrugator market. In July 2022, the Indian government banned single-use plastic items. According to M.L. Agarwal, President of the Corrugated Box Manufacturers Association of Telangana, Hyderabad, at the end of last decade, the total corrugated box manufacturing business in India is worth $4.11 billion, approximately 8 million tons of production. Furthermore, in May 2022, Kerala Paper Products Ltd (KPPL), a manufacturer of paper products invested 126 million to increase its production capacity of packaging grades of kraft paper, which is expected to positively affect the market for corrugator machines, as corrugated packaging is largely made using kraft paper.  

Competition Analysis

Competitive analysis and profiles of the major players in the corrugators market, such as ISOWA Corporation, Mitsubishi Heavy Industries, Ltd., BW Papersystems, Wenzhou Kingsun Machinery Industrial Co., Ltd, Acme Machinery Co. Pvt. Ltd., HIC Machinery Co., Sai Engineering, BHS Corrugated Maschinen- und Anlagenbau GmbH, Champion Corrugated Co., LTD., and Guangdong Dongfang Precision Science & Technology Co., Ltd (Fosber S.p.A.) are provided in this report.  

Key Benefits For Stakeholders 

  • The report provides an extensive analysis of the current and emerging corrugators market trends and dynamics.   

  • In-depth corrugators market analysis is conducted by constructing market estimations for key market segments between 2021 and 2031.  

  • Extensive analysis of the corrugators market is conducted by following key product positioning and monitoring of top competitors within the market framework. 

  • A comprehensive analysis of all the regions is provided to determine the prevailing opportunities. 

  • The corrugators market forecast analysis from 2022 to 2031 is included in the report. 

  • The key players within the corrugators market are profiled in this report and their strategies are analyzed thoroughly, which help understand the competitive outlook of the corrugators industry. 

Corrugators Market Report Highlights

Aspects Details
Market Size By 2031 USD 4.2 billion
Growth Rate CAGR of 4.2%
Forecast period 2021 - 2031
Report Pages 289
By Type
  • Automatic
  • Manual
By Production Capacity
  • Less than 10 ton
  • 11-50 ton
  • 51-100 ton
  • More than 100 ton
By End User
  • Food and Beverages
  • Electronics
  • Pharmaceuticals
  • Logistics and Shipping
  • Others
By Region
  • North America  (U.S., Canada, Mexico)
  • Europe  (Germany, France, UK, Italy, Rest of Europe)
  • Asia-Pacific  (China, India, Japan, South Korea, Rest of Asia-Pacific)
  • LAMEA  (Latin America, Middle East, Africa)
Key Market Players Sai Engineering, Champion Corrugated Co., LTD., Wenzhou Kingsun Machinery Industrial Co.,Ltd., ISOWA Corporation, BHS Corrugated Maschinen- und Anlagenbau GmbH, Mitsubishi Heavy Industries, Ltd., Acme Machinery Co. Pvt. Ltd, BW Papersystems, HIC Machinery Co., Guangdong Dongfang Precision Science & Technology Co., Ltd (Fosber S.p.A.)
 
  • CHAPTER 1:INTRODUCTION

    • 1.1.Report description

    • 1.2.Key market segments

    • 1.3.Key benefits to the stakeholders

    • 1.4.Research Methodology

      • 1.4.1.Secondary research

      • 1.4.2.Primary research

      • 1.4.3.Analyst tools and models

  • CHAPTER 2:EXECUTIVE SUMMARY

    • 2.1.Key findings of the study

    • 2.2.CXO Perspective

  • CHAPTER 3:MARKET OVERVIEW

    • 3.1.Market definition and scope

    • 3.2.Key findings

      • 3.2.1.Top investment pockets

    • 3.3.Porter’s five forces analysis

    • 3.4.Market dynamics

      • 3.4.1.Drivers

        • 3.4.1.1. Growth of e-commerce and retail sector
        • 3.4.1.2. Increasing Industrialization
        • 3.4.1.3. High Recyclability of corrugated packaging

      • 3.4.2.Restraints

        • 3.4.2.1. Fluctuating raw material prices

      • 3.4.3.Opportunities

        • 3.4.3.1. Technological developments in the corrugators industry

    • 3.5.COVID-19 Impact Analysis on the market

  • CHAPTER 4: CORRUGATORS MARKET, BY TYPE

    • 4.1 Overview

      • 4.1.1 Market size and forecast

    • 4.2. Automatic

      • 4.2.1 Key market trends, growth factors and opportunities

      • 4.2.2 Market size and forecast, by region

      • 4.2.3 Market share analysis by country

    • 4.3. Manual

      • 4.3.1 Key market trends, growth factors and opportunities

      • 4.3.2 Market size and forecast, by region

      • 4.3.3 Market share analysis by country

  • CHAPTER 5: CORRUGATORS MARKET, BY PRODUCTION CAPACITY

    • 5.1 Overview

      • 5.1.1 Market size and forecast

    • 5.2. Less than 10 ton

      • 5.2.1 Key market trends, growth factors and opportunities

      • 5.2.2 Market size and forecast, by region

      • 5.2.3 Market share analysis by country

    • 5.3. 11-50 ton

      • 5.3.1 Key market trends, growth factors and opportunities

      • 5.3.2 Market size and forecast, by region

      • 5.3.3 Market share analysis by country

    • 5.4. 51-100 ton

      • 5.4.1 Key market trends, growth factors and opportunities

      • 5.4.2 Market size and forecast, by region

      • 5.4.3 Market share analysis by country

    • 5.5. More than 100 ton

      • 5.5.1 Key market trends, growth factors and opportunities

      • 5.5.2 Market size and forecast, by region

      • 5.5.3 Market share analysis by country

  • CHAPTER 6: CORRUGATORS MARKET, BY END USER

    • 6.1 Overview

      • 6.1.1 Market size and forecast

    • 6.2. Food and Beverages

      • 6.2.1 Key market trends, growth factors and opportunities

      • 6.2.2 Market size and forecast, by region

      • 6.2.3 Market share analysis by country

    • 6.3. Electronics

      • 6.3.1 Key market trends, growth factors and opportunities

      • 6.3.2 Market size and forecast, by region

      • 6.3.3 Market share analysis by country

    • 6.4. Pharmaceuticals

      • 6.4.1 Key market trends, growth factors and opportunities

      • 6.4.2 Market size and forecast, by region

      • 6.4.3 Market share analysis by country

    • 6.5. Logistics and Shipping

      • 6.5.1 Key market trends, growth factors and opportunities

      • 6.5.2 Market size and forecast, by region

      • 6.5.3 Market share analysis by country

    • 6.6. Others

      • 6.6.1 Key market trends, growth factors and opportunities

      • 6.6.2 Market size and forecast, by region

      • 6.6.3 Market share analysis by country

  • CHAPTER 7: CORRUGATORS MARKET, BY REGION

    • 7.1 Overview

      • 7.1.1 Market size and forecast

    • 7.2 North America

      • 7.2.1 Key trends and opportunities

      • 7.2.2 North America Market size and forecast, by Type

      • 7.2.3 North America Market size and forecast, by Production Capacity

      • 7.2.4 North America Market size and forecast, by End User

      • 7.2.5 North America Market size and forecast, by country

        • 7.2.5.1 U.S.
          • 7.2.5.1.1 Key market trends, growth factors and opportunities
          • 7.2.5.1.2 Market size and forecast, by Type
          • 7.2.5.1.3 Market size and forecast, by Production Capacity
          • 7.2.5.1.4 Market size and forecast, by End User
        • 7.2.5.2 Canada
          • 7.2.5.2.1 Key market trends, growth factors and opportunities
          • 7.2.5.2.2 Market size and forecast, by Type
          • 7.2.5.2.3 Market size and forecast, by Production Capacity
          • 7.2.5.2.4 Market size and forecast, by End User
        • 7.2.5.3 Mexico
          • 7.2.5.3.1 Key market trends, growth factors and opportunities
          • 7.2.5.3.2 Market size and forecast, by Type
          • 7.2.5.3.3 Market size and forecast, by Production Capacity
          • 7.2.5.3.4 Market size and forecast, by End User
    • 7.3 Europe

      • 7.3.1 Key trends and opportunities

      • 7.3.2 Europe Market size and forecast, by Type

      • 7.3.3 Europe Market size and forecast, by Production Capacity

      • 7.3.4 Europe Market size and forecast, by End User

      • 7.3.5 Europe Market size and forecast, by country

        • 7.3.5.1 Germany
          • 7.3.5.1.1 Key market trends, growth factors and opportunities
          • 7.3.5.1.2 Market size and forecast, by Type
          • 7.3.5.1.3 Market size and forecast, by Production Capacity
          • 7.3.5.1.4 Market size and forecast, by End User
        • 7.3.5.2 France
          • 7.3.5.2.1 Key market trends, growth factors and opportunities
          • 7.3.5.2.2 Market size and forecast, by Type
          • 7.3.5.2.3 Market size and forecast, by Production Capacity
          • 7.3.5.2.4 Market size and forecast, by End User
        • 7.3.5.3 UK
          • 7.3.5.3.1 Key market trends, growth factors and opportunities
          • 7.3.5.3.2 Market size and forecast, by Type
          • 7.3.5.3.3 Market size and forecast, by Production Capacity
          • 7.3.5.3.4 Market size and forecast, by End User
        • 7.3.5.4 Italy
          • 7.3.5.4.1 Key market trends, growth factors and opportunities
          • 7.3.5.4.2 Market size and forecast, by Type
          • 7.3.5.4.3 Market size and forecast, by Production Capacity
          • 7.3.5.4.4 Market size and forecast, by End User
        • 7.3.5.5 Rest of Europe
          • 7.3.5.5.1 Key market trends, growth factors and opportunities
          • 7.3.5.5.2 Market size and forecast, by Type
          • 7.3.5.5.3 Market size and forecast, by Production Capacity
          • 7.3.5.5.4 Market size and forecast, by End User
    • 7.4 Asia-Pacific

      • 7.4.1 Key trends and opportunities

      • 7.4.2 Asia-Pacific Market size and forecast, by Type

      • 7.4.3 Asia-Pacific Market size and forecast, by Production Capacity

      • 7.4.4 Asia-Pacific Market size and forecast, by End User

      • 7.4.5 Asia-Pacific Market size and forecast, by country

        • 7.4.5.1 China
          • 7.4.5.1.1 Key market trends, growth factors and opportunities
          • 7.4.5.1.2 Market size and forecast, by Type
          • 7.4.5.1.3 Market size and forecast, by Production Capacity
          • 7.4.5.1.4 Market size and forecast, by End User
        • 7.4.5.2 India
          • 7.4.5.2.1 Key market trends, growth factors and opportunities
          • 7.4.5.2.2 Market size and forecast, by Type
          • 7.4.5.2.3 Market size and forecast, by Production Capacity
          • 7.4.5.2.4 Market size and forecast, by End User
        • 7.4.5.3 Japan
          • 7.4.5.3.1 Key market trends, growth factors and opportunities
          • 7.4.5.3.2 Market size and forecast, by Type
          • 7.4.5.3.3 Market size and forecast, by Production Capacity
          • 7.4.5.3.4 Market size and forecast, by End User
        • 7.4.5.4 South Korea
          • 7.4.5.4.1 Key market trends, growth factors and opportunities
          • 7.4.5.4.2 Market size and forecast, by Type
          • 7.4.5.4.3 Market size and forecast, by Production Capacity
          • 7.4.5.4.4 Market size and forecast, by End User
        • 7.4.5.5 Rest of Asia-Pacific
          • 7.4.5.5.1 Key market trends, growth factors and opportunities
          • 7.4.5.5.2 Market size and forecast, by Type
          • 7.4.5.5.3 Market size and forecast, by Production Capacity
          • 7.4.5.5.4 Market size and forecast, by End User
    • 7.5 LAMEA

      • 7.5.1 Key trends and opportunities

      • 7.5.2 LAMEA Market size and forecast, by Type

      • 7.5.3 LAMEA Market size and forecast, by Production Capacity

      • 7.5.4 LAMEA Market size and forecast, by End User

      • 7.5.5 LAMEA Market size and forecast, by country

        • 7.5.5.1 Latin America
          • 7.5.5.1.1 Key market trends, growth factors and opportunities
          • 7.5.5.1.2 Market size and forecast, by Type
          • 7.5.5.1.3 Market size and forecast, by Production Capacity
          • 7.5.5.1.4 Market size and forecast, by End User
        • 7.5.5.2 Middle East
          • 7.5.5.2.1 Key market trends, growth factors and opportunities
          • 7.5.5.2.2 Market size and forecast, by Type
          • 7.5.5.2.3 Market size and forecast, by Production Capacity
          • 7.5.5.2.4 Market size and forecast, by End User
        • 7.5.5.3 Africa
          • 7.5.5.3.1 Key market trends, growth factors and opportunities
          • 7.5.5.3.2 Market size and forecast, by Type
          • 7.5.5.3.3 Market size and forecast, by Production Capacity
          • 7.5.5.3.4 Market size and forecast, by End User
  • CHAPTER 8: COMPETITIVE LANDSCAPE

    • 8.1. Introduction

    • 8.2. Top winning strategies

    • 8.3. Product Mapping of Top 10 Player

    • 8.4. Competitive Dashboard

    • 8.5. Competitive Heatmap

    • 8.6. Top player positioning, 2021

  • CHAPTER 9: COMPANY PROFILES

    • 9.1 ISOWA Corporation

      • 9.1.1 Company overview

      • 9.1.2 Key Executives

      • 9.1.3 Company snapshot

      • 9.1.4 Operating business segments

      • 9.1.5 Product portfolio

      • 9.1.6 Business performance

      • 9.1.7 Key strategic moves and developments

    • 9.2 Mitsubishi Heavy Industries, Ltd.

      • 9.2.1 Company overview

      • 9.2.2 Key Executives

      • 9.2.3 Company snapshot

      • 9.2.4 Operating business segments

      • 9.2.5 Product portfolio

      • 9.2.6 Business performance

      • 9.2.7 Key strategic moves and developments

    • 9.3 BW Papersystems

      • 9.3.1 Company overview

      • 9.3.2 Key Executives

      • 9.3.3 Company snapshot

      • 9.3.4 Operating business segments

      • 9.3.5 Product portfolio

      • 9.3.6 Business performance

      • 9.3.7 Key strategic moves and developments

    • 9.4 Wenzhou Kingsun Machinery Industrial Co.,Ltd.

      • 9.4.1 Company overview

      • 9.4.2 Key Executives

      • 9.4.3 Company snapshot

      • 9.4.4 Operating business segments

      • 9.4.5 Product portfolio

      • 9.4.6 Business performance

      • 9.4.7 Key strategic moves and developments

    • 9.5 Acme Machinery Co. Pvt. Ltd

      • 9.5.1 Company overview

      • 9.5.2 Key Executives

      • 9.5.3 Company snapshot

      • 9.5.4 Operating business segments

      • 9.5.5 Product portfolio

      • 9.5.6 Business performance

      • 9.5.7 Key strategic moves and developments

    • 9.6 HIC Machinery Co.

      • 9.6.1 Company overview

      • 9.6.2 Key Executives

      • 9.6.3 Company snapshot

      • 9.6.4 Operating business segments

      • 9.6.5 Product portfolio

      • 9.6.6 Business performance

      • 9.6.7 Key strategic moves and developments

    • 9.7 Sai Engineering

      • 9.7.1 Company overview

      • 9.7.2 Key Executives

      • 9.7.3 Company snapshot

      • 9.7.4 Operating business segments

      • 9.7.5 Product portfolio

      • 9.7.6 Business performance

      • 9.7.7 Key strategic moves and developments

    • 9.8 BHS Corrugated Maschinen- und Anlagenbau GmbH

      • 9.8.1 Company overview

      • 9.8.2 Key Executives

      • 9.8.3 Company snapshot

      • 9.8.4 Operating business segments

      • 9.8.5 Product portfolio

      • 9.8.6 Business performance

      • 9.8.7 Key strategic moves and developments

    • 9.9 Champion Corrugated Co., LTD.

      • 9.9.1 Company overview

      • 9.9.2 Key Executives

      • 9.9.3 Company snapshot

      • 9.9.4 Operating business segments

      • 9.9.5 Product portfolio

      • 9.9.6 Business performance

      • 9.9.7 Key strategic moves and developments

    • 9.10 Guangdong Dongfang Precision Science & Technology Co., Ltd (Fosber S.p.A.)

      • 9.10.1 Company overview

      • 9.10.2 Key Executives

      • 9.10.3 Company snapshot

      • 9.10.4 Operating business segments

      • 9.10.5 Product portfolio

      • 9.10.6 Business performance

      • 9.10.7 Key strategic moves and developments

  • LIST OF TABLES

  • TABLE 1. GLOBAL CORRUGATORS MARKET, BY TYPE, 2021-2031 (REVENUE, $MILLION)
    TABLE 2. CORRUGATORS MARKET FOR AUTOMATIC, BY REGION, 2021-2031 (REVENUE, $MILLION)
    TABLE 3. CORRUGATORS MARKET FOR MANUAL, BY REGION, 2021-2031 (REVENUE, $MILLION)
    TABLE 4. GLOBAL CORRUGATORS MARKET, BY PRODUCTION CAPACITY, 2021-2031 (REVENUE, $MILLION)
    TABLE 5. CORRUGATORS MARKET FOR LESS THAN 10 TON, BY REGION, 2021-2031 (REVENUE, $MILLION)
    TABLE 6. CORRUGATORS MARKET FOR 11-50 TON, BY REGION, 2021-2031 (REVENUE, $MILLION)
    TABLE 7. CORRUGATORS MARKET FOR 51-100 TON, BY REGION, 2021-2031 (REVENUE, $MILLION)
    TABLE 8. CORRUGATORS MARKET FOR MORE THAN 100 TON, BY REGION, 2021-2031 (REVENUE, $MILLION)
    TABLE 9. GLOBAL CORRUGATORS MARKET, BY END USER, 2021-2031 (REVENUE, $MILLION)
    TABLE 10. CORRUGATORS MARKET FOR FOOD AND BEVERAGES, BY REGION, 2021-2031 (REVENUE, $MILLION)
    TABLE 11. CORRUGATORS MARKET FOR ELECTRONICS, BY REGION, 2021-2031 (REVENUE, $MILLION)
    TABLE 12. CORRUGATORS MARKET FOR PHARMACEUTICALS, BY REGION, 2021-2031 (REVENUE, $MILLION)
    TABLE 13. CORRUGATORS MARKET FOR LOGISTICS AND SHIPPING, BY REGION, 2021-2031 (REVENUE, $MILLION)
    TABLE 14. CORRUGATORS MARKET FOR OTHERS, BY REGION, 2021-2031 (REVENUE, $MILLION)
    TABLE 15. CORRUGATORS MARKET, BY REGION, 2021-2031 (REVENUE, $MILLION)
    TABLE 16. NORTH AMERICA CORRUGATORS MARKET, BY TYPE, 2021-2031 (REVENUE, $MILLION)
    TABLE 17. NORTH AMERICA CORRUGATORS MARKET, BY PRODUCTION CAPACITY, 2021-2031 (REVENUE, $MILLION)
    TABLE 18. NORTH AMERICA CORRUGATORS MARKET, BY END USER, 2021-2031 (REVENUE, $MILLION)
    TABLE 19. NORTH AMERICA CORRUGATORS MARKET, BY COUNTRY, 2021-2031 (REVENUE, $MILLION)
    TABLE 20. U.S. CORRUGATORS MARKET, BY TYPE, 2021-2031 (REVENUE, $MILLION)
    TABLE 21. U.S. CORRUGATORS MARKET, BY PRODUCTION CAPACITY, 2021-2031 (REVENUE, $MILLION)
    TABLE 22. U.S. CORRUGATORS MARKET, BY END USER, 2021-2031 (REVENUE, $MILLION)
    TABLE 23. CANADA CORRUGATORS MARKET, BY TYPE, 2021-2031 (REVENUE, $MILLION)
    TABLE 24. CANADA CORRUGATORS MARKET, BY PRODUCTION CAPACITY, 2021-2031 (REVENUE, $MILLION)
    TABLE 25. CANADA CORRUGATORS MARKET, BY END USER, 2021-2031 (REVENUE, $MILLION)
    TABLE 26. MEXICO CORRUGATORS MARKET, BY TYPE, 2021-2031 (REVENUE, $MILLION)
    TABLE 27. MEXICO CORRUGATORS MARKET, BY PRODUCTION CAPACITY, 2021-2031 (REVENUE, $MILLION)
    TABLE 28. MEXICO CORRUGATORS MARKET, BY END USER, 2021-2031 (REVENUE, $MILLION)
    TABLE 29. EUROPE CORRUGATORS MARKET, BY TYPE, 2021-2031 (REVENUE, $MILLION)
    TABLE 30. EUROPE CORRUGATORS MARKET, BY PRODUCTION CAPACITY, 2021-2031 (REVENUE, $MILLION)
    TABLE 31. EUROPE CORRUGATORS MARKET, BY END USER, 2021-2031 (REVENUE, $MILLION)
    TABLE 32. EUROPE CORRUGATORS MARKET, BY COUNTRY, 2021-2031 (REVENUE, $MILLION)
    TABLE 33. GERMANY CORRUGATORS MARKET, BY TYPE, 2021-2031 (REVENUE, $MILLION)
    TABLE 34. GERMANY CORRUGATORS MARKET, BY PRODUCTION CAPACITY, 2021-2031 (REVENUE, $MILLION)
    TABLE 35. GERMANY CORRUGATORS MARKET, BY END USER, 2021-2031 (REVENUE, $MILLION)
    TABLE 36. FRANCE CORRUGATORS MARKET, BY TYPE, 2021-2031 (REVENUE, $MILLION)
    TABLE 37. FRANCE CORRUGATORS MARKET, BY PRODUCTION CAPACITY, 2021-2031 (REVENUE, $MILLION)
    TABLE 38. FRANCE CORRUGATORS MARKET, BY END USER, 2021-2031 (REVENUE, $MILLION)
    TABLE 39. UK CORRUGATORS MARKET, BY TYPE, 2021-2031 (REVENUE, $MILLION)
    TABLE 40. UK CORRUGATORS MARKET, BY PRODUCTION CAPACITY, 2021-2031 (REVENUE, $MILLION)
    TABLE 41. UK CORRUGATORS MARKET, BY END USER, 2021-2031 (REVENUE, $MILLION)
    TABLE 42. ITALY CORRUGATORS MARKET, BY TYPE, 2021-2031 (REVENUE, $MILLION)
    TABLE 43. ITALY CORRUGATORS MARKET, BY PRODUCTION CAPACITY, 2021-2031 (REVENUE, $MILLION)
    TABLE 44. ITALY CORRUGATORS MARKET, BY END USER, 2021-2031 (REVENUE, $MILLION)
    TABLE 45. REST OF EUROPE CORRUGATORS MARKET, BY TYPE, 2021-2031 (REVENUE, $MILLION)
    TABLE 46. REST OF EUROPE CORRUGATORS MARKET, BY PRODUCTION CAPACITY, 2021-2031 (REVENUE, $MILLION)
    TABLE 47. REST OF EUROPE CORRUGATORS MARKET, BY END USER, 2021-2031 (REVENUE, $MILLION)
    TABLE 48. ASIA-PACIFIC CORRUGATORS MARKET, BY TYPE, 2021-2031 (REVENUE, $MILLION)
    TABLE 49. ASIA-PACIFIC CORRUGATORS MARKET, BY PRODUCTION CAPACITY, 2021-2031 (REVENUE, $MILLION)
    TABLE 50. ASIA-PACIFIC CORRUGATORS MARKET, BY END USER, 2021-2031 (REVENUE, $MILLION)
    TABLE 51. ASIA-PACIFIC CORRUGATORS MARKET, BY COUNTRY, 2021-2031 (REVENUE, $MILLION)
    TABLE 52. CHINA CORRUGATORS MARKET, BY TYPE, 2021-2031 (REVENUE, $MILLION)
    TABLE 53. CHINA CORRUGATORS MARKET, BY PRODUCTION CAPACITY, 2021-2031 (REVENUE, $MILLION)
    TABLE 54. CHINA CORRUGATORS MARKET, BY END USER, 2021-2031 (REVENUE, $MILLION)
    TABLE 55. INDIA CORRUGATORS MARKET, BY TYPE, 2021-2031 (REVENUE, $MILLION)
    TABLE 56. INDIA CORRUGATORS MARKET, BY PRODUCTION CAPACITY, 2021-2031 (REVENUE, $MILLION)
    TABLE 57. INDIA CORRUGATORS MARKET, BY END USER, 2021-2031 (REVENUE, $MILLION)
    TABLE 58. JAPAN CORRUGATORS MARKET, BY TYPE, 2021-2031 (REVENUE, $MILLION)
    TABLE 59. JAPAN CORRUGATORS MARKET, BY PRODUCTION CAPACITY, 2021-2031 (REVENUE, $MILLION)
    TABLE 60. JAPAN CORRUGATORS MARKET, BY END USER, 2021-2031 (REVENUE, $MILLION)
    TABLE 61. SOUTH KOREA CORRUGATORS MARKET, BY TYPE, 2021-2031 (REVENUE, $MILLION)
    TABLE 62. SOUTH KOREA CORRUGATORS MARKET, BY PRODUCTION CAPACITY, 2021-2031 (REVENUE, $MILLION)
    TABLE 63. SOUTH KOREA CORRUGATORS MARKET, BY END USER, 2021-2031 (REVENUE, $MILLION)
    TABLE 64. REST OF ASIA-PACIFIC CORRUGATORS MARKET, BY TYPE, 2021-2031 (REVENUE, $MILLION)
    TABLE 65. REST OF ASIA-PACIFIC CORRUGATORS MARKET, BY PRODUCTION CAPACITY, 2021-2031 (REVENUE, $MILLION)
    TABLE 66. REST OF ASIA-PACIFIC CORRUGATORS MARKET, BY END USER, 2021-2031 (REVENUE, $MILLION)
    TABLE 67. LAMEA CORRUGATORS MARKET, BY TYPE, 2021-2031 (REVENUE, $MILLION)
    TABLE 68. LAMEA CORRUGATORS MARKET, BY PRODUCTION CAPACITY, 2021-2031 (REVENUE, $MILLION)
    TABLE 69. LAMEA CORRUGATORS MARKET, BY END USER, 2021-2031 (REVENUE, $MILLION)
    TABLE 70. LAMEA CORRUGATORS MARKET, BY COUNTRY, 2021-2031 (REVENUE, $MILLION)
    TABLE 71. LATIN AMERICA CORRUGATORS MARKET, BY TYPE, 2021-2031 (REVENUE, $MILLION)
    TABLE 72. LATIN AMERICA CORRUGATORS MARKET, BY PRODUCTION CAPACITY, 2021-2031 (REVENUE, $MILLION)
    TABLE 73. LATIN AMERICA CORRUGATORS MARKET, BY END USER, 2021-2031 (REVENUE, $MILLION)
    TABLE 74. MIDDLE EAST CORRUGATORS MARKET, BY TYPE, 2021-2031 (REVENUE, $MILLION)
    TABLE 75. MIDDLE EAST CORRUGATORS MARKET, BY PRODUCTION CAPACITY, 2021-2031 (REVENUE, $MILLION)
    TABLE 76. MIDDLE EAST CORRUGATORS MARKET, BY END USER, 2021-2031 (REVENUE, $MILLION)
    TABLE 77. AFRICA CORRUGATORS MARKET, BY TYPE, 2021-2031 (REVENUE, $MILLION)
    TABLE 78. AFRICA CORRUGATORS MARKET, BY PRODUCTION CAPACITY, 2021-2031 (REVENUE, $MILLION)
    TABLE 79. AFRICA CORRUGATORS MARKET, BY END USER, 2021-2031 (REVENUE, $MILLION)
    TABLE 80. ISOWA CORPORATION: KEY EXECUTIVES
    TABLE 81. ISOWA CORPORATION: COMPANY SNAPSHOT
    TABLE 82. ISOWA CORPORATION: OPERATING SEGMENTS
    TABLE 83. ISOWA CORPORATION: PRODUCT PORTFOLIO
    TABLE 84. ISOWA CORPORATION: NET SALES
    TABLE 85. ISOWA CORPORATION: KEY STRATERGIES
    TABLE 86. MITSUBISHI HEAVY INDUSTRIES, LTD.: KEY EXECUTIVES
    TABLE 87. MITSUBISHI HEAVY INDUSTRIES, LTD.: COMPANY SNAPSHOT
    TABLE 88. MITSUBISHI HEAVY INDUSTRIES, LTD.: OPERATING SEGMENTS
    TABLE 89. MITSUBISHI HEAVY INDUSTRIES, LTD.: PRODUCT PORTFOLIO
    TABLE 90. MITSUBISHI HEAVY INDUSTRIES, LTD.: NET SALES
    TABLE 91. MITSUBISHI HEAVY INDUSTRIES, LTD.: KEY STRATERGIES
    TABLE 92. BW PAPERSYSTEMS: KEY EXECUTIVES
    TABLE 93. BW PAPERSYSTEMS: COMPANY SNAPSHOT
    TABLE 94. BW PAPERSYSTEMS: OPERATING SEGMENTS
    TABLE 95. BW PAPERSYSTEMS: PRODUCT PORTFOLIO
    TABLE 96. BW PAPERSYSTEMS: NET SALES
    TABLE 97. BW PAPERSYSTEMS: KEY STRATERGIES
    TABLE 98. WENZHOU KINGSUN MACHINERY INDUSTRIAL CO.,LTD.: KEY EXECUTIVES
    TABLE 99. WENZHOU KINGSUN MACHINERY INDUSTRIAL CO.,LTD.: COMPANY SNAPSHOT
    TABLE 100. WENZHOU KINGSUN MACHINERY INDUSTRIAL CO.,LTD.: OPERATING SEGMENTS
    TABLE 101. WENZHOU KINGSUN MACHINERY INDUSTRIAL CO.,LTD.: PRODUCT PORTFOLIO
    TABLE 102. WENZHOU KINGSUN MACHINERY INDUSTRIAL CO.,LTD.: NET SALES
    TABLE 103. WENZHOU KINGSUN MACHINERY INDUSTRIAL CO.,LTD.: KEY STRATERGIES
    TABLE 104. ACME MACHINERY CO. PVT. LTD: KEY EXECUTIVES
    TABLE 105. ACME MACHINERY CO. PVT. LTD: COMPANY SNAPSHOT
    TABLE 106. ACME MACHINERY CO. PVT. LTD: OPERATING SEGMENTS
    TABLE 107. ACME MACHINERY CO. PVT. LTD: PRODUCT PORTFOLIO
    TABLE 108. ACME MACHINERY CO. PVT. LTD: NET SALES
    TABLE 109. ACME MACHINERY CO. PVT. LTD: KEY STRATERGIES
    TABLE 110. HIC MACHINERY CO.: KEY EXECUTIVES
    TABLE 111. HIC MACHINERY CO.: COMPANY SNAPSHOT
    TABLE 112. HIC MACHINERY CO.: OPERATING SEGMENTS
    TABLE 113. HIC MACHINERY CO.: PRODUCT PORTFOLIO
    TABLE 114. HIC MACHINERY CO.: NET SALES
    TABLE 115. HIC MACHINERY CO.: KEY STRATERGIES
    TABLE 116. SAI ENGINEERING: KEY EXECUTIVES
    TABLE 117. SAI ENGINEERING: COMPANY SNAPSHOT
    TABLE 118. SAI ENGINEERING: OPERATING SEGMENTS
    TABLE 119. SAI ENGINEERING: PRODUCT PORTFOLIO
    TABLE 120. SAI ENGINEERING: NET SALES
    TABLE 121. SAI ENGINEERING: KEY STRATERGIES
    TABLE 122. BHS CORRUGATED MASCHINEN- UND ANLAGENBAU GMBH: KEY EXECUTIVES
    TABLE 123. BHS CORRUGATED MASCHINEN- UND ANLAGENBAU GMBH: COMPANY SNAPSHOT
    TABLE 124. BHS CORRUGATED MASCHINEN- UND ANLAGENBAU GMBH: OPERATING SEGMENTS
    TABLE 125. BHS CORRUGATED MASCHINEN- UND ANLAGENBAU GMBH: PRODUCT PORTFOLIO
    TABLE 126. BHS CORRUGATED MASCHINEN- UND ANLAGENBAU GMBH: NET SALES
    TABLE 127. BHS CORRUGATED MASCHINEN- UND ANLAGENBAU GMBH: KEY STRATERGIES
    TABLE 128. CHAMPION CORRUGATED CO., LTD.: KEY EXECUTIVES
    TABLE 129. CHAMPION CORRUGATED CO., LTD.: COMPANY SNAPSHOT
    TABLE 130. CHAMPION CORRUGATED CO., LTD.: OPERATING SEGMENTS
    TABLE 131. CHAMPION CORRUGATED CO., LTD.: PRODUCT PORTFOLIO
    TABLE 132. CHAMPION CORRUGATED CO., LTD.: NET SALES
    TABLE 133. CHAMPION CORRUGATED CO., LTD.: KEY STRATERGIES
    TABLE 134. GUANGDONG DONGFANG PRECISION SCIENCE & TECHNOLOGY CO., LTD (FOSBER S.P.A.): KEY EXECUTIVES
    TABLE 135. GUANGDONG DONGFANG PRECISION SCIENCE & TECHNOLOGY CO., LTD (FOSBER S.P.A.): COMPANY SNAPSHOT
    TABLE 136. GUANGDONG DONGFANG PRECISION SCIENCE & TECHNOLOGY CO., LTD (FOSBER S.P.A.): OPERATING SEGMENTS
    TABLE 137. GUANGDONG DONGFANG PRECISION SCIENCE & TECHNOLOGY CO., LTD (FOSBER S.P.A.): PRODUCT PORTFOLIO
    TABLE 138. GUANGDONG DONGFANG PRECISION SCIENCE & TECHNOLOGY CO., LTD (FOSBER S.P.A.): NET SALES
    TABLE 139. GUANGDONG DONGFANG PRECISION SCIENCE & TECHNOLOGY CO., LTD (FOSBER S.P.A.): KEY STRATERGIES
  • LIST OF FIGURES

  • FIGURE 1. SEGMENTATION OF CORRUGATORS MARKET,2021-2031
    FIGURE 2. CORRUGATORS MARKET,2021-2031
    FIGURE 3. TOP INVESTMENT POCKETS, BY REGION
    FIGURE 4. PORTER FIVE-1
    FIGURE 5. PORTER FIVE-2
    FIGURE 6. PORTER FIVE-3
    FIGURE 7. PORTER FIVE-4
    FIGURE 8. PORTER FIVE-5
    FIGURE 9. CORRUGATORS MARKET:DRIVERS, RESTRAINTS AND OPPORTUNITIES
    FIGURE 10. CORRUGATORS MARKET,BY TYPE,2021(%)
    FIGURE 11. COMPARATIVE SHARE ANALYSIS OF AUTOMATIC CORRUGATORS MARKET, 2021 AND 2031(%)
    FIGURE 12. COMPARATIVE SHARE ANALYSIS OF MANUAL CORRUGATORS MARKET, 2021 AND 2031(%)
    FIGURE 13. CORRUGATORS MARKET,BY PRODUCTION CAPACITY,2021(%)
    FIGURE 14. COMPARATIVE SHARE ANALYSIS OF LESS THAN 10 TON CORRUGATORS MARKET, 2021 AND 2031(%)
    FIGURE 15. COMPARATIVE SHARE ANALYSIS OF 11-50 TON CORRUGATORS MARKET, 2021 AND 2031(%)
    FIGURE 16. COMPARATIVE SHARE ANALYSIS OF 51-100 TON CORRUGATORS MARKET, 2021 AND 2031(%)
    FIGURE 17. COMPARATIVE SHARE ANALYSIS OF MORE THAN 100 TON CORRUGATORS MARKET, 2021 AND 2031(%)
    FIGURE 18. CORRUGATORS MARKET,BY END USER,2021(%)
    FIGURE 19. COMPARATIVE SHARE ANALYSIS OF FOOD AND BEVERAGES CORRUGATORS MARKET, 2021 AND 2031(%)
    FIGURE 20. COMPARATIVE SHARE ANALYSIS OF ELECTRONICS CORRUGATORS MARKET, 2021 AND 2031(%)
    FIGURE 21. COMPARATIVE SHARE ANALYSIS OF PHARMACEUTICALS CORRUGATORS MARKET, 2021 AND 2031(%)
    FIGURE 22. COMPARATIVE SHARE ANALYSIS OF LOGISTICS AND SHIPPING CORRUGATORS MARKET, 2021 AND 2031(%)
    FIGURE 23. COMPARATIVE SHARE ANALYSIS OF OTHERS CORRUGATORS MARKET, 2021 AND 2031(%)
    FIGURE 24. CORRUGATORS MARKET BY REGION,2021
    FIGURE 25. U.S. CORRUGATORS MARKET,2021-2031($MILLION)
    FIGURE 26. CANADA CORRUGATORS MARKET,2021-2031($MILLION)
    FIGURE 27. MEXICO CORRUGATORS MARKET,2021-2031($MILLION)
    FIGURE 28. GERMANY CORRUGATORS MARKET,2021-2031($MILLION)
    FIGURE 29. FRANCE CORRUGATORS MARKET,2021-2031($MILLION)
    FIGURE 30. UK CORRUGATORS MARKET,2021-2031($MILLION)
    FIGURE 31. ITALY CORRUGATORS MARKET,2021-2031($MILLION)
    FIGURE 32. REST OF EUROPE CORRUGATORS MARKET,2021-2031($MILLION)
    FIGURE 33. CHINA CORRUGATORS MARKET,2021-2031($MILLION)
    FIGURE 34. INDIA CORRUGATORS MARKET,2021-2031($MILLION)
    FIGURE 35. JAPAN CORRUGATORS MARKET,2021-2031($MILLION)
    FIGURE 36. SOUTH KOREA CORRUGATORS MARKET,2021-2031($MILLION)
    FIGURE 37. REST OF ASIA-PACIFIC CORRUGATORS MARKET,2021-2031($MILLION)
    FIGURE 38. LATIN AMERICA CORRUGATORS MARKET,2021-2031($MILLION)
    FIGURE 39. MIDDLE EAST CORRUGATORS MARKET,2021-2031($MILLION)
    FIGURE 40. AFRICA CORRUGATORS MARKET,2021-2031($MILLION)
    FIGURE 41. TOP WINNING STRATEGIES, BY YEAR
    FIGURE 42. TOP WINNING STRATEGIES, BY DEVELOPMENT
    FIGURE 43. TOP WINNING STRATEGIES, BY COMPANY
    FIGURE 44. PRODUCT MAPPING OF TOP 10 PLAYERS
    FIGURE 45. COMPETITIVE DASHBOARD
    FIGURE 46. COMPETITIVE HEATMAP OF TOP 10 KEY PLAYERS
    FIGURE 47. TOP PLAYER POSITIONING, 2021
    FIGURE 48. ISOWA CORPORATION.: NET SALES ($MILLION)
    FIGURE 49. MITSUBISHI HEAVY INDUSTRIES, LTD..: NET SALES ($MILLION)
    FIGURE 50. BW PAPERSYSTEMS.: NET SALES ($MILLION)
    FIGURE 51. WENZHOU KINGSUN MACHINERY INDUSTRIAL CO.,LTD..: NET SALES ($MILLION)
    FIGURE 52. ACME MACHINERY CO. PVT. LTD.: NET SALES ($MILLION)
    FIGURE 53. HIC MACHINERY CO..: NET SALES ($MILLION)
    FIGURE 54. SAI ENGINEERING.: NET SALES ($MILLION)
    FIGURE 55. BHS CORRUGATED MASCHINEN- UND ANLAGENBAU GMBH.: NET SALES ($MILLION)
    FIGURE 56. CHAMPION CORRUGATED CO., LTD..: NET SALES ($MILLION)
    FIGURE 57. GUANGDONG DONGFANG PRECISION SCIENCE & TECHNOLOGY CO., LTD (FOSBER S.P.A.).: NET SALES ($MILLION)


The corrugators market has witnessed significant growth in the past few years, owing to a surge in demand for eco-friendly secondary, as well as primary packaging mediums for FMCG products, food & beverage, and other industrial and non-industrial products.  

A corrugated sheet is strong and lightweight, and can easily retain its shape, along with providing a safe packing of products from weathering elements. In addition to this, governments of their respective countries across the globe are introducing various policies to reduce the use of single use plastic packaging, and to encourage sustainable packaging. This is expected to drive demand for corrugated boxes; hence, positively impacting the growth of the corrugators market.  

Furthermore, the e-commerce sector, along with other industries is witnessing rapid growth, owing to the rise in disposable income of people, and favorable government policies that support the industry growth. 

PURCHASE OPTIONS

Call or Email us

U.S.-Canada Toll-free: +1-800-792-5285
Int'l : +1-503-894-6022
Europe : +44-845-528-1300
Email : help@alliedmarketresearch.com
 
FREQUENTLY ASKED QUESTIONS?

A. Growth of e-commerce and retail sector, and increasing industrialization, are a few of the upcoming trends of Corrugators Market in the world.

A. Corrugators are largely used for producing corrugated paperboards used for making rigid packaging for food & beverages, electronics, pharmaceuticals, logistics & shipping, and other industries.

A. Asia-Pacific region was the largest contributor to the corrugators market revenue in 2021.

A. Corrugators market size was valued at $2,722.3 million in 2021.

A. ISOWA Corporation, Mitsubishi Heavy Industries, Ltd., BW Papersystems, Wenzhou Kingsun Machinery Industrial Co., Ltd, Acme Machinery Co. Pvt. Ltd., HIC Machinery Co., Sai Engineering, BHS Corrugated Maschinen- und Anlagenbau GmbH, Champion Corrugated Co., LTD., and Guangdong Dongfang Precision Science & Technology Co., Ltd (Fosber S.p.A.). are the top companies included in corrugators market.

A. By end-user, the food and beverages segment dominated the market in 2021.

A. The company profile has been selected on factors such as geographical presence, market dominance (in terms of revenue and volume sales), various strategies and recent developments.

A. The estimated industry size of the corrugators market is projected to reach $4,147.2 million by 2031.

Looking for Customization?

 Customization Request

Have a Question?

 Speak with Analyst

Any Confusion?

 Inquire Before Buying

Have a glance of the Report

  Request Sample
RELATED TAGS

Purchase Full Report of
Corrugators Market

Start reading instantly.
This Report and over 66,905+ more Reports, Available with Avenue Library. T&C*.

  • Online Only
  • $3,570
  • Online cloud access only
  • Restricted print, copy, paste & download
  • Read only
  • Free industry update
    (Within 180 days)
  • Free report update in next update cycle
    (Dec 2023 - Dec 2024)
  • Data Pack
  • $3,840
  • Restricted to one authorized user
  • One print only
  • Available in
    Excel
  • Free industry update
    (Within 180 days)
  •   Free report update in next update cycle
    (Dec 2023 - Dec 2024)
  • Single User
  • $5,730
  • Restricted to one authorized user
  • One print only
  • Available in
    PDF
  • Free industry update
    (Within 180 days)
  •   Free report update in next update cycle
    (Dec 2023 - Dec 2024)
  • Five Users
  • $6,450
  • Limited to five authorized users
  • Print upto five copies
  • Available in
    PDF
  • Free industry update
    (Within 180 days)
  •   Free report update in next update cycle
    (Dec 2023 - Dec 2024)
  • Enterprise
    License/PDF

  • $9,600
  • Unlimited
    within
    company/enterprise
  • Available in Excel & PDF
  • Free industry update
    (Within 180 days)
  •   Free report update in next update cycle
    (Dec 2023 - Dec 2024)
  • Library
    Membership

  • $999 $ 1,175
    Per User/ Per month/ Billed annually
  • Published Content
    E-access
  • Company Profiles
    E-access
  • Newly Added Content Access
  • 10 PDF
    Downloads
  • 5 Excel Data
    Pack Downloads
  • 250 Company Profiles PDF Downloads
  • Buy Now

*Taxes/Fees, if applicable will be added during checkout. All prices in USD

RELATED REPORTS
 

Why Allied Market Research?


Infallible Methodology

To ensure high-level data integrity, accurate analysis, and impeccable forecasts

Analyst Support

For complete satisfaction

Customization

On-demand customization of scope of the report to exactly meet your needs

TARGETED MARKET VIEW

Targeted market view to provide pertinent information and save time of readers

Get fresh content delivered

Get insights on topics that are crucial for your business. Stay abreast of your interest areas.

Get Industry Data Alerts

Why Allied Market Research?

Infallible Methodology

To ensure high-level data integrity, accurate analysis, and impeccable forecasts

Analyst Support

For complete satisfaction

Customization

On-demand customization of scope of the report to exactly meet your needs

TARGETED MARKET VIEW

Targeted market view to provide pertinent information and save time of readers