
Cotton Pads Market Research, 2033
Market Introduction and Definition
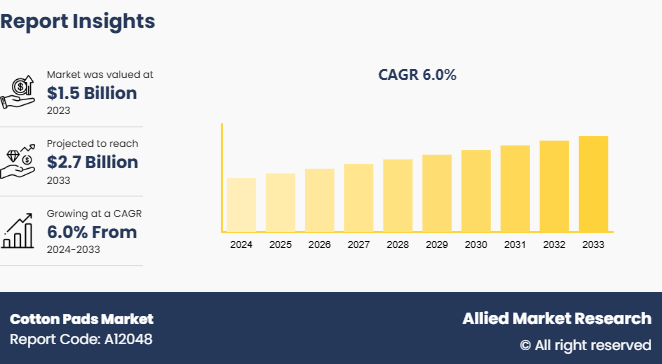
The global cotton pads market size was valued at $1.5 billion in 2023, and is projected to reach $2.7 billion by 2033, growing at a CAGR of 6% from 2024 to 2033. Cotton pads are used for skincare, cosmetics, and personal hygiene. They are a popular choice for applying skincare products, removing makeup, and cleansing sensitive parts of the skin since they are soft, absorbent, and disposable. These pads are recommended because of their gentleness and adaptability, whether they are made of synthetic or natural cotton fibers. Rise in consumer awareness of hygiene, rising demand for eco-friendly and organic products, and expanding beauty and skincare treatments are the main factors driving the market. The cotton pad market has expanded steadily rise in personal hygiene standards across the globe, especially in areas with thriving beauty care and high disposable income sectors.
Key Takeaways
- The cotton pads market study covers 20 countries. The research includes a segment analysis of each country in terms of value for the projected period.
- More than 1, 500 product literature, industry releases, annual reports, and other such documents of major cotton pads industry participants along with authentic industry journals, trade associations' releases, and government websites have been reviewed for generating high-value industry insights.
- The study integrated high-quality data, professional opinions and analysis, and critical independent perspectives. The research approach is intended to provide a balanced view of global markets and to assist stakeholders in making educated decisions in order to achieve their most ambitious growth objectives.
Key market dynamics
A major factor contributing to this trend is the growing consumer knowledge of skincare practices, makeup removal, and overall health maintenance, which boosts demand for personal hygiene and care products. Cotton pads are essential for toning, cleaning, and removing makeup, and their demand has increased as more individuals include skin care in their daily routines.
The market has begun to shift due to environmental concerns as well as consumers' increased preference for eco-friendly and sustainable products. The environmental impact of traditional single-use cotton pads is being challenged, which has led to a shift toward reusable, organic, and biodegradable options. Growing emphasis on "green beauty" and environmentally sensitive consumer behavior are contributing factors to growing sustainability trend by pushing businesses to use sustainable sourcing and production methods, including employing organic cotton or providing reusable cotton pads.
The quality and functionality of cotton pads has improved due to technological developments in the production process. Manufacturers are now able to produce customized cotton pads for various skin types and cosmetic purposes due to advancements in texture, absorbency, and softness. As a result, the market has grown rapidly, and more products are made accessible to satisfy a wider range of customer requirements.
However, the market faces challenges such as volatile cotton prices, which affect manufacturing costs and profit margins. Conventional cotton pads face competition from the growing number of reusable skincare items such as silicone pads and microfiber cloths.
By region, the market is dominated by North America and Europe because of the high consumer expenditure on personal care products in these regions, while Asia-Pacific is predicted to rise rapidly because of rising disposable incomes and urbanization. The global cotton pads market growth, innovation, and competitive environment are all influenced by these dynamics together.
Parent Market Overview of the Global Cotton Pads Market

The broader personal care and hygiene market, which includes a broad range of product categories like skincare, cosmetics, and health and wellness products, is the parent market of the global cotton pads market. Growing consumer knowledge of grooming techniques, skincare regimens, and personal cleanliness is driving this industry. Global demand for personal care products has been driven by rising disposable incomes, urbanization, and an increasing emphasis on self-care. Toners, cleansers, and makeup removers are important product categories in the parent market; these products are frequently used in conjunction with cotton pads. Furthermore, the market has been impacted by the trend toward eco-friendly and sustainable beauty products. Customers are looking for biodegradable and organic options for personal hygiene, which is driving up demand for specialty cotton pads.
Market Segmentation
The cotton pads market is segmented into type, end-use industry, distribution channel, and region. On the basis of type, the market is divided into round cotton pads, square cotton pads, and oval cotton pads. On the basis of end-use industry, the market is classified into cosmetic, medical, and others. On the basis of distribution channel, the market is categorized into hypermarket/supermarket, specialty stores, online, and others. Region-wise, the market is analyzed across North America, Europe, Asia-Pacific, and LAMEA.
Regional/Country Market Outlook
The rise in demand for skincare, cosmetics, and personal hygiene products propels the demand for cotton pads globally. Different customer preferences, economic conditions, and production capacities are reflected in the variations in market dynamics across different regions.
Consumer awareness of skincare routines and personal care products is driving up demand for cotton pads in North America. The U.S. leads the region, and as environmental concerns develop, more people are looking for organic and environmentally friendly cotton pads. E-commerce sites and retail giants that provide a wide selection of cotton pad brands readily available further aid in the expansion of the market.
Another important market is Europe, where the demand for cotton pads is highest in nations such as France, Germany, and the UK. Cotton pads that are organic, biodegradable, and cruelty-free are being offered by manufacturers due to the region's strong emphasis on sustainability and green beauty trends. High-quality cotton pads are preferred by European customers for use in skincare and cosmetics, which increases sales through retail and internet channels.
China, Japan, South Korea, and India are the main contributors to the Asia-Pacific region's rapid market growth. Demand is being driven by these countries' increasing urbanization, disposable income, and growing interest in skincare. Premium cotton pads for skincare and makeup removal have witnessed high sales owing to beauty-conscious consumers, especially in China and South Korea. In addition to maintaining cost-effectiveness, local manufacturers make products more accessible to middle-class consumers.
With a growing emphasis on hygiene and the use of skincare products, the market is progressively growing across Latin America and the Middle East and Africa (MEA) . Notable markets where organic and reasonably priced cotton pads are becoming more popular are Brazil and South Africa.
Industry Trends:
- Swisspers introduced a new line of cotton pads that are biodegradable and environmentally friendly in June 2024, aimed at customers who care about the environment. The product range places a strong emphasis on sustainability to meet the growing demand for natural and organic personal care products.
- Johnson & Johnson strengthened its position in the expanding cotton pad market in November 2023 by acquiring PurCotton, a manufacturer of products based on cotton, to broaden its range of personal care products.
- A new manufacturing facility in Guangdong Province allowed Shanghai Jahwa United to increase the number of cotton pads it could produce in April 2024. The company decided to expand to meet the growing demand for high-quality cotton pads for skin care.
- A line of luxurious cotton pads intended for use in premium skincare products was introduced by Shiseido in July 2024. The organic cotton pads are marketed as a high-end product, appealing to Japan's expanding beauty and cosmetics industry.
- The Cotton on Group mentioned in December 2023 that it would be working with organic cotton farms to create eco-friendly cotton pads that would be sold in both home and foreign markets. This action is in line with the business's environmental goals.
Competitive Landscape
The major players operating in the cotton pads market include CMC Consumer Medical Care GMBH, COTTON HIGH TECH, S.L., CottonClub, Falu AG, Groupe Lemoine, Hidrofer S.A., Johnson & Johnson Services, Inc., L'Oreal S.A., Lohmann & Rauscher GmbH & Co. KG., Mavala USA, Noleo Care Company, LLC, Ontex BV, Organics and More, LLC, Sanitars S.p.A, Septona S.A., Shiseido Company Limited, TZMO SA, U.S. Cotton, LLC, Unicharm Corporation, VEGA Industries Private Limited, Winner Medical Co., Ltd., and ZHEJIANG B.I. Industrial Co., Ltd.
Recent Key Strategies and Developments
- In September 2024, a new range of organic cotton pads was introduced by Procter & Gamble, which aims to meet the growing demand for green products in the personal care industry by focusing on sustainability and eco-friendly packaging.
- In August 2024, Hengan International Group Company Limited increased the output of cotton pads and other hygiene products by expanding its production facilities in Jiangsu province in response to rising domestic market demand.
Key Benefits For Stakeholders
- This cotton pads market report provides a quantitative analysis of the cotton pads market size, segments, current trends, estimations, and dynamics of the cotton pads market analysis from 2024 to 2033 to identify the prevailing cotton pads market opportunities.
- The market research is offered along with information related to key drivers, restraints, and opportunities.
- Porter's five forces analysis highlights the potency of buyers and suppliers to enable stakeholders make profit-oriented business decisions and strengthen their supplier-buyer network.
- In-depth analysis of the cotton pads market segmentation assists to determine the prevailing market opportunities.
- Major countries in each region are mapped according to their revenue contribution to the global cotton pads market forecast.
- Market player positioning facilitates benchmarking and provides a clear understanding of the present position of the market players.
- The report includes the analysis of the regional as well as global cotton pads market trends, key players, cotton pads market share, segments, application areas, and market growth strategies.
Cotton Pads Market Report Highlights
| Aspects | Details |
| Market Size By 2033 | USD 2.7 Billion |
| Growth Rate | CAGR of 6% |
| Forecast period | 2024 - 2033 |
| Report Pages | 250 |
| By Type |
|
| By End Use Industry |
|
| By Distribution Channel |
|
| By Region |
|
| Key Market Players | Falu AG, Johnson & Johnson Services, Inc., Lohmann & Rauscher GmbH & Co. KG., Hidrofer S.A., Cohitech-Cotton High Tech, S.L., L'Oreal S.A., CottonClub, CMC Consumer Medical Care GMBH, groupe lemoine, Mavala USA |
Upcoming trends in the global cotton pads market include increased demand for eco-friendly, biodegradable products, innovations in absorbency, and growth in organic cotton usage, driven by sustainability and consumer health concerns.
The leading application of the Cotton Pads Market is in personal care and hygiene, primarily for skincare routines, makeup removal, and cleansing, driven by increasing demand for convenient, disposable beauty products.
The largest regional market for cotton pads is **Asia-Pacific**, driven by high consumer demand in countries like China, India, and Japan, along with growing awareness of personal care and hygiene products.
The global cotton pads market was valued at $1.5 billion in 2023, and is projected to reach $2.7 billion by 2033, growing at a CAGR of 6% from 2024 to 2033.
The major players operating in the cotton pads market include CMC Consumer Medical Care GMBH, COTTON HIGH TECH, S.L., CottonClub, Falu AG, Groupe Lemoine, Hidrofer S.A., Johnson & Johnson Services, Inc., L'Oreal S.A., Lohmann & Rauscher GmbH & Co. KG., Mavala USA, Noleo Care Company, LLC, Ontex BV, Organics and More, LLC, Sanitars S.p.A, Septona S.A., Shiseido Company Limited, TZMO SA, U.S. Cotton, LLC, Unicharm Corporation, VEGA Industries Private Limited, Winner Medical Co., Ltd., and ZHEJIANG
Loading Table Of Content...

