0
2023
Cross-connect System Market

Cross-Connect System Market

by Type (Fiber, CAT Cables, COAX, Others), by Application (Connectivity, Protection Switching and Network Restoration): Global Opportunity Analysis and Industry Forecast, 2022-2031

Report Code: A13171
Jan 2023 | Pages: 290
Tables: 98
Charts: 50
  • Formats*:

  • pdf

    Single User License, Five User
    License & Enterprise User License

  • xls

    Data Pack Excel License

  • ppt

    It comes with the additional cost
    of $2500.00 contact sales.


Cross-Connect System Market Research, 2031

The global cross-connect system market was valued at $2.5 billion in 2021, and is projected to reach $7.1 billion by 2031, growing at a CAGR of 11.1% from 2022 to 2031.

The term cross connect represents the cabling necessary to establish a direct link between two separate hardware units in a data center. It allows the owners of the units to establish a private network link and eliminate the need to connect using the internet. Collocation providers typically provide tenants only with a connection to the main distribution frame. This connection is established by linking the patch panel in the tenant's enclosure with another patch panel that mirrors the ports of the original panel. The second patch panel for each tenant sits in the Meet-Me Room (MMR). If two tenants wish to establish a direct connection between their enclosures, they may ask the colocation owner to provide a cross-connect, i.e., to use a patch cable to connect their respective patch panels in the MMR.

The cross-connect system market has been severely impacted by the outbreak of the COVID-19 pandemic. With governments of several nations imposing and extending lockdowns, production and manufacturing facilities across the globe have been shut down, owing crisis and unavailability of workforce. Considering the inputs from various industry experts belonging to the various stages of the value chain, such as OEMs, suppliers, integrators, end users, and distributors, and the financial release of various companies in the cross-connect system ecosystem, it is calculated that the market has experienced a decline during 2019–2020. Furthermore, the outbreak of the pandemic has disrupted the global supply chain, thereby creating significant gap in supply chain. Economic impact of the pandemic has been disruptive. Key players operating in the cross-connect system industry temporarily witnessed a slowdown, owing to lack of availability of skilled professional to develop cross-connect system market solutions, which has led to decline in revenues for the financial year 2020 to 2021. However, it is expected that the market will recover from 2021 and remain in the growth stage during the forecast period.

Cross-Connect System Market

The cross-connect system market is segmented into Type and Application.

Cross-Connect System Market

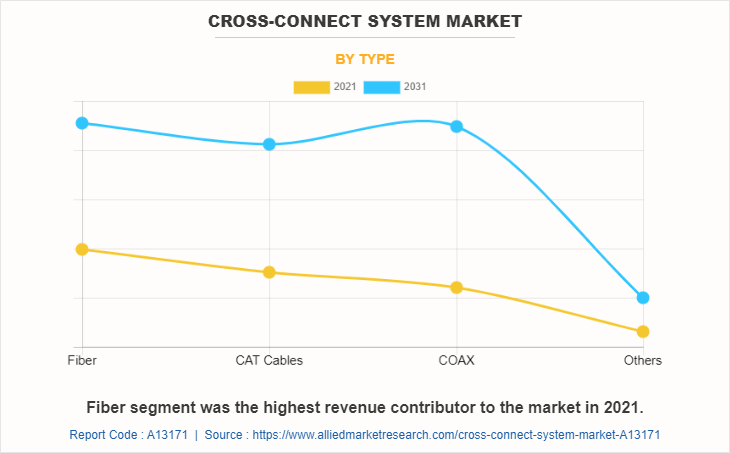
By type, the market is divided into fiber, CAT cables, COAX and others. The fiber segment was the highest revenue contributor to the market in 2021.
Cross-Connect System Market

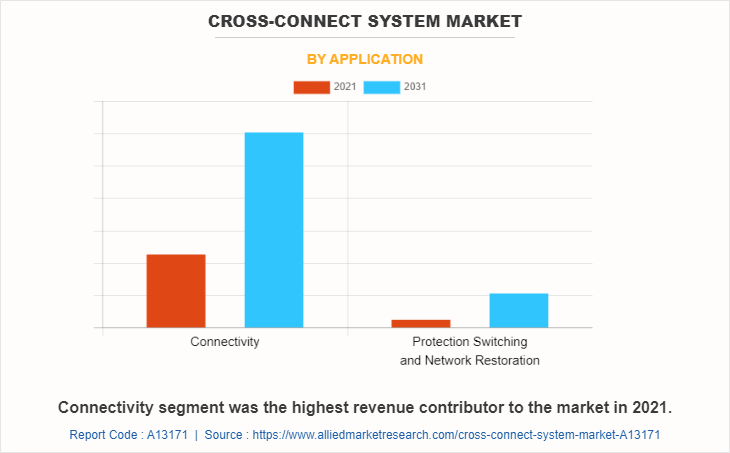
By application, it is segmented into connectivity and protection switching & network restoration. The connectivity segment was the highest revenue contributor to the market in 2021.
Cross-Connect System Market

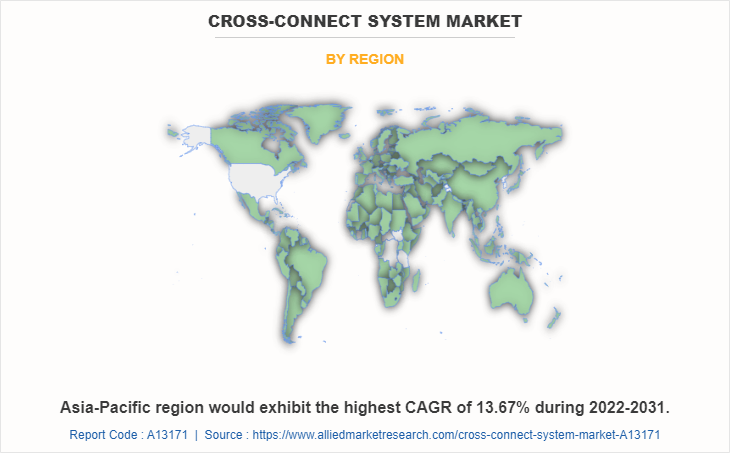
Region wise, the cross connect system market trends are analyzed across North America (the U.S. and Canada), Europe (UK, Germany, France, Italy and rest of Europe), Asia-Pacific (China, Japan, India, South Korea and rest of Asia-Pacific), and LAMEA (Latin America, the Middle East, and Africa).
Cross Connect Network offers numerous advantages compared to standard ISP connections. From increased security and data loss protection to performance improvements, cross connects present the best connectivity solution for a wide range of use cases. Using cross connects simplifies the network topology and eliminates many potential points of failure commonly found in public networks. Therefore, cross connections are much more reliable for organizations that cannot afford server downtime.

Significant factors that impact growth of the cross-connect system market size include surge in usage in datacenters. Moreover, emergence of internet of things (IoT) is expected to drive the cross-connect system market growth. However, rise in concerns related to high installation cost might hamper the cross-connect system industry. On the contrary, rise in investments in optical fiber cable (OFC) network infrastructure offers potential growth opportunities for the cross-connect system market share.

The cross-connect system market analysis and profiles of the major players, such as Huawei Technologies Co., Ltd., Optiwave Systems Inc., Fujitsu Ltd., Sercalo Microtechnology Ltd., Xros Inc., ZTE Corporation, CommScope, Equinix, Inc., CoreSite and Cyxtera Technologies Inc are provided in this report.

Key Benefits For Stakeholders

  • This report provides a quantitative analysis of the market segments, current trends, estimations, and dynamics of the cross-connect system market analysis from 2021 to 2031 to identify the prevailing cross-connect system market opportunity.
  • The market research is offered along with information related to key drivers, restraints, and opportunities.
  • Porter's five forces analysis highlights the potency of buyers and suppliers to enable stakeholders make profit-oriented business decisions and strengthen their supplier-buyer network.
  • In-depth analysis of the cross-connect system market outlook assists to determine the prevailing market opportunities.
  • Major countries in each region are mapped according to their revenue contribution to the global market.
  • Market player positioning facilitates benchmarking and provides a clear understanding of the present position of the market players.
  • The report includes the analysis of the regional as well as global cross-connect system market trends, key players, market segments, application areas, cross-connect system market forecast and market growth strategies.

Cross-Connect System Market Report Highlights

Aspects Details
Market Size By 2031 USD 7.1 billion
Growth Rate CAGR of 11.1%
Forecast period 2021 - 2031
Report Pages 290
By Type
  • Fiber
  • CAT Cables
  • COAX
  • Others
By Application
  • Connectivity
  • Protection Switching and Network Restoration
By Region
  • North America  (U.S., Canada)
  • Europe  (UK, Germany, France, Italy, Rest of Europe)
  • Asia-Pacific  (China, Japan, India, South Korea, Rest of Asia-Pacific)
  • LAMEA  (Latin America, Middle East, Africa)
Key Market Players Xros Inc., CommScope, Sercalo Microtechnology Ltd., ZTE Corporation, Fujitsu Ltd., Cyxtera Technologies Inc., Huawei Technologies Co., Ltd., Equinix, Inc., CoreSite, Optiwave Systems Inc.

Analyst Review

Cross connects are a convenient and hassle-free way to improve the quality of the service. Cross connects are also used to connect to other data center facilities within a data center campus setting. This is referred to as an intracampus cross connect. They are used to connect the colocation racks in one data center to a campus of data centers. It works by connecting an aggregation point inside one data center to an aggregation point inside another data center. With intracampus cross connects, there is no need for switching or routing. The connection speed is very fast as it is a private connection for moving data over short distances.

The key players profiled in the report include cross connect system market players, such as Huawei Technologies Co., Ltd., Optiwave Systems Inc., Fujitsu Ltd., Sercalo Microtechnology Ltd., Xros Inc., ZTE Corporation, CommScope, Equinix, Inc., CoreSite and Cyxtera Technologies Inc.

 
  • CHAPTER 1: INTRODUCTION

    • 1.1. Report description

    • 1.2. Key market segments

    • 1.3. Key benefits to the stakeholders

    • 1.4. Research Methodology

      • 1.4.1. Primary research

      • 1.4.2. Secondary research

      • 1.4.3. Analyst tools and models

  • CHAPTER 2: EXECUTIVE SUMMARY

    • 2.1. CXO Perspective

  • CHAPTER 3: MARKET OVERVIEW

    • 3.1. Market definition and scope

    • 3.2. Key findings

      • 3.2.1. Top impacting factors

      • 3.2.2. Top investment pockets

    • 3.3. Porter’s five forces analysis

      • 3.3.1. Moderate bargaining power of suppliers

      • 3.3.2. Moderate threat of new entrants

      • 3.3.3. Moderate threat of substitutes

      • 3.3.4. Moderate intensity of rivalry

      • 3.3.5. Moderate bargaining power of buyers

    • 3.4. Market dynamics

      • 3.4.1. Drivers

        • 3.4.1.1. Emergence of internet of things (IoT)
        • 3.4.1.2. Surge in usage in datacenters

      • 3.4.2. Restraints

        • 3.4.2.1. High installation cost

      • 3.4.3. Opportunities

        • 3.4.3.1. Rising investments in optical fiber cable (OFC) network infrastructure

    • 3.5. COVID-19 Impact Analysis on the market

  • CHAPTER 4: CROSS-CONNECT SYSTEM MARKET, BY TYPE

    • 4.1. Overview

      • 4.1.1. Market size and forecast

    • 4.2. Fiber

      • 4.2.1. Key market trends, growth factors and opportunities

      • 4.2.2. Market size and forecast, by region

      • 4.2.3. Market share analysis by country

    • 4.3. CAT Cables

      • 4.3.1. Key market trends, growth factors and opportunities

      • 4.3.2. Market size and forecast, by region

      • 4.3.3. Market share analysis by country

    • 4.4. COAX

      • 4.4.1. Key market trends, growth factors and opportunities

      • 4.4.2. Market size and forecast, by region

      • 4.4.3. Market share analysis by country

    • 4.5. Others

      • 4.5.1. Key market trends, growth factors and opportunities

      • 4.5.2. Market size and forecast, by region

      • 4.5.3. Market share analysis by country

  • CHAPTER 5: CROSS-CONNECT SYSTEM MARKET, BY APPLICATION

    • 5.1. Overview

      • 5.1.1. Market size and forecast

    • 5.2. Connectivity

      • 5.2.1. Key market trends, growth factors and opportunities

      • 5.2.2. Market size and forecast, by region

      • 5.2.3. Market share analysis by country

    • 5.3. Protection Switching and Network Restoration

      • 5.3.1. Key market trends, growth factors and opportunities

      • 5.3.2. Market size and forecast, by region

      • 5.3.3. Market share analysis by country

  • CHAPTER 6: CROSS-CONNECT SYSTEM MARKET, BY REGION

    • 6.1. Overview

      • 6.1.1. Market size and forecast By Region

    • 6.2. North America

      • 6.2.1. Key trends and opportunities

      • 6.2.2. Market size and forecast, by Type

      • 6.2.3. Market size and forecast, by Application

      • 6.2.4. Market size and forecast, by country

        • 6.2.4.1. U.S.
          • 6.2.4.1.1. Key market trends, growth factors and opportunities
          • 6.2.4.1.2. Market size and forecast, by Type
          • 6.2.4.1.3. Market size and forecast, by Application
        • 6.2.4.2. Canada
          • 6.2.4.2.1. Key market trends, growth factors and opportunities
          • 6.2.4.2.2. Market size and forecast, by Type
          • 6.2.4.2.3. Market size and forecast, by Application
    • 6.3. Europe

      • 6.3.1. Key trends and opportunities

      • 6.3.2. Market size and forecast, by Type

      • 6.3.3. Market size and forecast, by Application

      • 6.3.4. Market size and forecast, by country

        • 6.3.4.1. UK
          • 6.3.4.1.1. Key market trends, growth factors and opportunities
          • 6.3.4.1.2. Market size and forecast, by Type
          • 6.3.4.1.3. Market size and forecast, by Application
        • 6.3.4.2. Germany
          • 6.3.4.2.1. Key market trends, growth factors and opportunities
          • 6.3.4.2.2. Market size and forecast, by Type
          • 6.3.4.2.3. Market size and forecast, by Application
        • 6.3.4.3. France
          • 6.3.4.3.1. Key market trends, growth factors and opportunities
          • 6.3.4.3.2. Market size and forecast, by Type
          • 6.3.4.3.3. Market size and forecast, by Application
        • 6.3.4.4. Italy
          • 6.3.4.4.1. Key market trends, growth factors and opportunities
          • 6.3.4.4.2. Market size and forecast, by Type
          • 6.3.4.4.3. Market size and forecast, by Application
        • 6.3.4.5. Rest of Europe
          • 6.3.4.5.1. Key market trends, growth factors and opportunities
          • 6.3.4.5.2. Market size and forecast, by Type
          • 6.3.4.5.3. Market size and forecast, by Application
    • 6.4. Asia-Pacific

      • 6.4.1. Key trends and opportunities

      • 6.4.2. Market size and forecast, by Type

      • 6.4.3. Market size and forecast, by Application

      • 6.4.4. Market size and forecast, by country

        • 6.4.4.1. China
          • 6.4.4.1.1. Key market trends, growth factors and opportunities
          • 6.4.4.1.2. Market size and forecast, by Type
          • 6.4.4.1.3. Market size and forecast, by Application
        • 6.4.4.2. Japan
          • 6.4.4.2.1. Key market trends, growth factors and opportunities
          • 6.4.4.2.2. Market size and forecast, by Type
          • 6.4.4.2.3. Market size and forecast, by Application
        • 6.4.4.3. India
          • 6.4.4.3.1. Key market trends, growth factors and opportunities
          • 6.4.4.3.2. Market size and forecast, by Type
          • 6.4.4.3.3. Market size and forecast, by Application
        • 6.4.4.4. South Korea
          • 6.4.4.4.1. Key market trends, growth factors and opportunities
          • 6.4.4.4.2. Market size and forecast, by Type
          • 6.4.4.4.3. Market size and forecast, by Application
        • 6.4.4.5. Rest of Asia-Pacific
          • 6.4.4.5.1. Key market trends, growth factors and opportunities
          • 6.4.4.5.2. Market size and forecast, by Type
          • 6.4.4.5.3. Market size and forecast, by Application
    • 6.5. LAMEA

      • 6.5.1. Key trends and opportunities

      • 6.5.2. Market size and forecast, by Type

      • 6.5.3. Market size and forecast, by Application

      • 6.5.4. Market size and forecast, by country

        • 6.5.4.1. Latin America
          • 6.5.4.1.1. Key market trends, growth factors and opportunities
          • 6.5.4.1.2. Market size and forecast, by Type
          • 6.5.4.1.3. Market size and forecast, by Application
        • 6.5.4.2. Middle East
          • 6.5.4.2.1. Key market trends, growth factors and opportunities
          • 6.5.4.2.2. Market size and forecast, by Type
          • 6.5.4.2.3. Market size and forecast, by Application
        • 6.5.4.3. Africa
          • 6.5.4.3.1. Key market trends, growth factors and opportunities
          • 6.5.4.3.2. Market size and forecast, by Type
          • 6.5.4.3.3. Market size and forecast, by Application
  • CHAPTER 7: COMPETITIVE LANDSCAPE

    • 7.1. Introduction

    • 7.2. Top winning strategies

    • 7.3. Product Mapping of Top 10 Player

    • 7.4. Competitive Dashboard

    • 7.5. Competitive Heatmap

    • 7.6. Top player positioning, 2021

  • CHAPTER 8: COMPANY PROFILES

    • 8.1. Huawei Technologies Co., Ltd.

      • 8.1.1. Company overview

      • 8.1.2. Key Executives

      • 8.1.3. Company snapshot

      • 8.1.4. Operating business segments

      • 8.1.5. Product portfolio

      • 8.1.6. Business performance

      • 8.1.7. Key strategic moves and developments

    • 8.2. Optiwave Systems Inc.

      • 8.2.1. Company overview

      • 8.2.2. Key Executives

      • 8.2.3. Company snapshot

      • 8.2.4. Operating business segments

      • 8.2.5. Product portfolio

    • 8.3. Fujitsu Ltd.

      • 8.3.1. Company overview

      • 8.3.2. Key Executives

      • 8.3.3. Company snapshot

      • 8.3.4. Operating business segments

      • 8.3.5. Product portfolio

      • 8.3.6. Business performance

      • 8.3.7. Key strategic moves and developments

    • 8.4. Sercalo Microtechnology Ltd.

      • 8.4.1. Company overview

      • 8.4.2. Key Executives

      • 8.4.3. Company snapshot

      • 8.4.4. Operating business segments

      • 8.4.5. Product portfolio

    • 8.5. Xros Inc.

      • 8.5.1. Company overview

      • 8.5.2. Key Executives

      • 8.5.3. Company snapshot

      • 8.5.4. Operating business segments

      • 8.5.5. Product portfolio

    • 8.6. ZTE Corporation

      • 8.6.1. Company overview

      • 8.6.2. Key Executives

      • 8.6.3. Company snapshot

      • 8.6.4. Operating business segments

      • 8.6.5. Product portfolio

      • 8.6.6. Business performance

      • 8.6.7. Key strategic moves and developments

    • 8.7. CommScope

      • 8.7.1. Company overview

      • 8.7.2. Key Executives

      • 8.7.3. Company snapshot

      • 8.7.4. Operating business segments

      • 8.7.5. Product portfolio

      • 8.7.6. Business performance

      • 8.7.7. Key strategic moves and developments

    • 8.8. Equinix, Inc.

      • 8.8.1. Company overview

      • 8.8.2. Key Executives

      • 8.8.3. Company snapshot

      • 8.8.4. Operating business segments

      • 8.8.5. Product portfolio

      • 8.8.6. Business performance

      • 8.8.7. Key strategic moves and developments

    • 8.9. CoreSite

      • 8.9.1. Company overview

      • 8.9.2. Key Executives

      • 8.9.3. Company snapshot

      • 8.9.4. Operating business segments

      • 8.9.5. Product portfolio

      • 8.9.6. Key strategic moves and developments

    • 8.10. Cyxtera Technologies Inc.

      • 8.10.1. Company overview

      • 8.10.2. Key Executives

      • 8.10.3. Company snapshot

      • 8.10.4. Operating business segments

      • 8.10.5. Product portfolio

      • 8.10.6. Business performance

      • 8.10.7. Key strategic moves and developments

  • LIST OF TABLES

  • TABLE 01. GLOBAL CROSS-CONNECT SYSTEM MARKET, BY TYPE, 2021-2031 ($MILLION)
    TABLE 02. CROSS-CONNECT SYSTEM MARKET FOR FIBER, BY REGION, 2021-2031 ($MILLION)
    TABLE 03. CROSS-CONNECT SYSTEM MARKET FOR CAT CABLES, BY REGION, 2021-2031 ($MILLION)
    TABLE 04. CROSS-CONNECT SYSTEM MARKET FOR COAX, BY REGION, 2021-2031 ($MILLION)
    TABLE 05. CROSS-CONNECT SYSTEM MARKET FOR OTHERS, BY REGION, 2021-2031 ($MILLION)
    TABLE 06. GLOBAL CROSS-CONNECT SYSTEM MARKET, BY APPLICATION, 2021-2031 ($MILLION)
    TABLE 07. CROSS-CONNECT SYSTEM MARKET FOR CONNECTIVITY, BY REGION, 2021-2031 ($MILLION)
    TABLE 08. CROSS-CONNECT SYSTEM MARKET FOR PROTECTION SWITCHING AND NETWORK RESTORATION, BY REGION, 2021-2031 ($MILLION)
    TABLE 09. CROSS-CONNECT SYSTEM MARKET, BY REGION, 2021-2031 ($MILLION)
    TABLE 10. NORTH AMERICA CROSS-CONNECT SYSTEM MARKET, BY TYPE, 2021-2031 ($MILLION)
    TABLE 11. NORTH AMERICA CROSS-CONNECT SYSTEM MARKET, BY APPLICATION, 2021-2031 ($MILLION)
    TABLE 12. NORTH AMERICA CROSS-CONNECT SYSTEM MARKET, BY COUNTRY, 2021-2031 ($MILLION)
    TABLE 13. U.S. CROSS-CONNECT SYSTEM MARKET, BY TYPE, 2021-2031 ($MILLION)
    TABLE 14. U.S. CROSS-CONNECT SYSTEM MARKET, BY APPLICATION, 2021-2031 ($MILLION)
    TABLE 15. CANADA CROSS-CONNECT SYSTEM MARKET, BY TYPE, 2021-2031 ($MILLION)
    TABLE 16. CANADA CROSS-CONNECT SYSTEM MARKET, BY APPLICATION, 2021-2031 ($MILLION)
    TABLE 17. EUROPE CROSS-CONNECT SYSTEM MARKET, BY TYPE, 2021-2031 ($MILLION)
    TABLE 18. EUROPE CROSS-CONNECT SYSTEM MARKET, BY APPLICATION, 2021-2031 ($MILLION)
    TABLE 19. EUROPE CROSS-CONNECT SYSTEM MARKET, BY COUNTRY, 2021-2031 ($MILLION)
    TABLE 20. UK CROSS-CONNECT SYSTEM MARKET, BY TYPE, 2021-2031 ($MILLION)
    TABLE 21. UK CROSS-CONNECT SYSTEM MARKET, BY APPLICATION, 2021-2031 ($MILLION)
    TABLE 22. GERMANY CROSS-CONNECT SYSTEM MARKET, BY TYPE, 2021-2031 ($MILLION)
    TABLE 23. GERMANY CROSS-CONNECT SYSTEM MARKET, BY APPLICATION, 2021-2031 ($MILLION)
    TABLE 24. FRANCE CROSS-CONNECT SYSTEM MARKET, BY TYPE, 2021-2031 ($MILLION)
    TABLE 25. FRANCE CROSS-CONNECT SYSTEM MARKET, BY APPLICATION, 2021-2031 ($MILLION)
    TABLE 26. ITALY CROSS-CONNECT SYSTEM MARKET, BY TYPE, 2021-2031 ($MILLION)
    TABLE 27. ITALY CROSS-CONNECT SYSTEM MARKET, BY APPLICATION, 2021-2031 ($MILLION)
    TABLE 28. REST OF EUROPE CROSS-CONNECT SYSTEM MARKET, BY TYPE, 2021-2031 ($MILLION)
    TABLE 29. REST OF EUROPE CROSS-CONNECT SYSTEM MARKET, BY APPLICATION, 2021-2031 ($MILLION)
    TABLE 30. ASIA-PACIFIC CROSS-CONNECT SYSTEM MARKET, BY TYPE, 2021-2031 ($MILLION)
    TABLE 31. ASIA-PACIFIC CROSS-CONNECT SYSTEM MARKET, BY APPLICATION, 2021-2031 ($MILLION)
    TABLE 32. ASIA-PACIFIC CROSS-CONNECT SYSTEM MARKET, BY COUNTRY, 2021-2031 ($MILLION)
    TABLE 33. CHINA CROSS-CONNECT SYSTEM MARKET, BY TYPE, 2021-2031 ($MILLION)
    TABLE 34. CHINA CROSS-CONNECT SYSTEM MARKET, BY APPLICATION, 2021-2031 ($MILLION)
    TABLE 35. JAPAN CROSS-CONNECT SYSTEM MARKET, BY TYPE, 2021-2031 ($MILLION)
    TABLE 36. JAPAN CROSS-CONNECT SYSTEM MARKET, BY APPLICATION, 2021-2031 ($MILLION)
    TABLE 37. INDIA CROSS-CONNECT SYSTEM MARKET, BY TYPE, 2021-2031 ($MILLION)
    TABLE 38. INDIA CROSS-CONNECT SYSTEM MARKET, BY APPLICATION, 2021-2031 ($MILLION)
    TABLE 39. SOUTH KOREA CROSS-CONNECT SYSTEM MARKET, BY TYPE, 2021-2031 ($MILLION)
    TABLE 40. SOUTH KOREA CROSS-CONNECT SYSTEM MARKET, BY APPLICATION, 2021-2031 ($MILLION)
    TABLE 41. REST OF ASIA-PACIFIC CROSS-CONNECT SYSTEM MARKET, BY TYPE, 2021-2031 ($MILLION)
    TABLE 42. REST OF ASIA-PACIFIC CROSS-CONNECT SYSTEM MARKET, BY APPLICATION, 2021-2031 ($MILLION)
    TABLE 43. LAMEA CROSS-CONNECT SYSTEM MARKET, BY TYPE, 2021-2031 ($MILLION)
    TABLE 44. LAMEA CROSS-CONNECT SYSTEM MARKET, BY APPLICATION, 2021-2031 ($MILLION)
    TABLE 45. LAMEA CROSS-CONNECT SYSTEM MARKET, BY COUNTRY, 2021-2031 ($MILLION)
    TABLE 46. LATIN AMERICA CROSS-CONNECT SYSTEM MARKET, BY TYPE, 2021-2031 ($MILLION)
    TABLE 47. LATIN AMERICA CROSS-CONNECT SYSTEM MARKET, BY APPLICATION, 2021-2031 ($MILLION)
    TABLE 48. MIDDLE EAST CROSS-CONNECT SYSTEM MARKET, BY TYPE, 2021-2031 ($MILLION)
    TABLE 49. MIDDLE EAST CROSS-CONNECT SYSTEM MARKET, BY APPLICATION, 2021-2031 ($MILLION)
    TABLE 50. AFRICA CROSS-CONNECT SYSTEM MARKET, BY TYPE, 2021-2031 ($MILLION)
    TABLE 51. AFRICA CROSS-CONNECT SYSTEM MARKET, BY APPLICATION, 2021-2031 ($MILLION)
    TABLE 52. HUAWEI TECHNOLOGIES CO., LTD.: KEY EXECUTIVES
    TABLE 53. HUAWEI TECHNOLOGIES CO., LTD.: COMPANY SNAPSHOT
    TABLE 54. HUAWEI TECHNOLOGIES CO., LTD.: SERVICE SEGMENTS
    TABLE 55. HUAWEI TECHNOLOGIES CO., LTD.: PRODUCT PORTFOLIO
    TABLE 56. HUAWEI TECHNOLOGIES CO., LTD.: KEY STRATERGIES
    TABLE 57. OPTIWAVE SYSTEMS INC.: KEY EXECUTIVES
    TABLE 58. OPTIWAVE SYSTEMS INC.: COMPANY SNAPSHOT
    TABLE 59. OPTIWAVE SYSTEMS INC.: PRODUCT SEGMENTS
    TABLE 60. OPTIWAVE SYSTEMS INC.: PRODUCT PORTFOLIO
    TABLE 61. FUJITSU LTD.: KEY EXECUTIVES
    TABLE 62. FUJITSU LTD.: COMPANY SNAPSHOT
    TABLE 63. FUJITSU LTD.: SERVICE SEGMENTS
    TABLE 64. FUJITSU LTD.: PRODUCT PORTFOLIO
    TABLE 65. FUJITSU LTD.: KEY STRATERGIES
    TABLE 66. SERCALO MICROTECHNOLOGY LTD.: KEY EXECUTIVES
    TABLE 67. SERCALO MICROTECHNOLOGY LTD.: COMPANY SNAPSHOT
    TABLE 68. SERCALO MICROTECHNOLOGY LTD.: SERVICE SEGMENTS
    TABLE 69. SERCALO MICROTECHNOLOGY LTD.: PRODUCT PORTFOLIO
    TABLE 70. XROS INC.: KEY EXECUTIVES
    TABLE 71. XROS INC.: COMPANY SNAPSHOT
    TABLE 72. XROS INC.: SERVICE SEGMENTS
    TABLE 73. XROS INC.: PRODUCT PORTFOLIO
    TABLE 74. ZTE CORPORATION: KEY EXECUTIVES
    TABLE 75. ZTE CORPORATION: COMPANY SNAPSHOT
    TABLE 76. ZTE CORPORATION: SERVICE SEGMENTS
    TABLE 77. ZTE CORPORATION: PRODUCT PORTFOLIO
    TABLE 78. ZTE CORPORATION: KEY STRATERGIES
    TABLE 79. COMMSCOPE: KEY EXECUTIVES
    TABLE 80. COMMSCOPE: COMPANY SNAPSHOT
    TABLE 81. COMMSCOPE: SERVICE SEGMENTS
    TABLE 82. COMMSCOPE: PRODUCT PORTFOLIO
    TABLE 83. COMMSCOPE: KEY STRATERGIES
    TABLE 84. EQUINIX, INC.: KEY EXECUTIVES
    TABLE 85. EQUINIX, INC.: COMPANY SNAPSHOT
    TABLE 86. EQUINIX, INC.: SERVICE SEGMENTS
    TABLE 87. EQUINIX, INC.: PRODUCT PORTFOLIO
    TABLE 88. EQUINIX, INC.: KEY STRATERGIES
    TABLE 89. CORESITE: KEY EXECUTIVES
    TABLE 90. CORESITE: COMPANY SNAPSHOT
    TABLE 91. CORESITE: SERVICE SEGMENTS
    TABLE 92. CORESITE: PRODUCT PORTFOLIO
    TABLE 93. CORESITE: KEY STRATERGIES
    TABLE 94. CYXTERA TECHNOLOGIES INC.: KEY EXECUTIVES
    TABLE 95. CYXTERA TECHNOLOGIES INC.: COMPANY SNAPSHOT
    TABLE 96. CYXTERA TECHNOLOGIES INC.: SERVICE SEGMENTS
    TABLE 97. CYXTERA TECHNOLOGIES INC.: PRODUCT PORTFOLIO
    TABLE 98. CYXTERA TECHNOLOGIES INC.: KEY STRATERGIES
  • LIST OF FIGURES

  • FIGURE 1. SEGMENTATION OF CROSS-CONNECT SYSTEM MARKET,2021-2031
    FIGURE 2. CROSS-CONNECT SYSTEM MARKET,2021-2031
    FIGURE 3. TOP INVESTMENT POCKETS, BY REGION
    FIGURE 4. PORTER FIVE-1
    FIGURE 5. PORTER FIVE-2
    FIGURE 6. PORTER FIVE-3
    FIGURE 7. PORTER FIVE-4
    FIGURE 8. PORTER FIVE-5
    FIGURE 9. CROSS-CONNECT SYSTEM MARKET:DRIVERS, RESTRAINTS AND OPPORTUNITIES
    FIGURE 10. CROSS-CONNECT SYSTEM MARKET,BY TYPE,2021(%)
    FIGURE 11. COMPARATIVE SHARE ANALYSIS OF FIBER CROSS-CONNECT SYSTEM MARKET, 2021 AND 2031(%)
    FIGURE 12. COMPARATIVE SHARE ANALYSIS OF CAT CABLES CROSS-CONNECT SYSTEM MARKET, 2021 AND 2031(%)
    FIGURE 13. COMPARATIVE SHARE ANALYSIS OF COAX CROSS-CONNECT SYSTEM MARKET, 2021 AND 2031(%)
    FIGURE 14. COMPARATIVE SHARE ANALYSIS OF OTHERS CROSS-CONNECT SYSTEM MARKET, 2021 AND 2031(%)
    FIGURE 15. CROSS-CONNECT SYSTEM MARKET,BY APPLICATION,2021(%)
    FIGURE 16. COMPARATIVE SHARE ANALYSIS OF CONNECTIVITY CROSS-CONNECT SYSTEM MARKET, 2021 AND 2031(%)
    FIGURE 17. COMPARATIVE SHARE ANALYSIS OF PROTECTION SWITCHING AND NETWORK RESTORATION CROSS-CONNECT SYSTEM MARKET, 2021 AND 2031(%)
    FIGURE 18. CROSS-CONNECT SYSTEM MARKET BY REGION,2021
    FIGURE 19. U.S. CROSS-CONNECT SYSTEM MARKET,2021-2031($MILLION)
    FIGURE 20. CANADA CROSS-CONNECT SYSTEM MARKET,2021-2031($MILLION)
    FIGURE 21. UK CROSS-CONNECT SYSTEM MARKET,2021-2031($MILLION)
    FIGURE 22. GERMANY CROSS-CONNECT SYSTEM MARKET,2021-2031($MILLION)
    FIGURE 23. FRANCE CROSS-CONNECT SYSTEM MARKET,2021-2031($MILLION)
    FIGURE 24. ITALY CROSS-CONNECT SYSTEM MARKET,2021-2031($MILLION)
    FIGURE 25. REST OF EUROPE CROSS-CONNECT SYSTEM MARKET,2021-2031($MILLION)
    FIGURE 26. CHINA CROSS-CONNECT SYSTEM MARKET,2021-2031($MILLION)
    FIGURE 27. JAPAN CROSS-CONNECT SYSTEM MARKET,2021-2031($MILLION)
    FIGURE 28. INDIA CROSS-CONNECT SYSTEM MARKET,2021-2031($MILLION)
    FIGURE 29. SOUTH KOREA CROSS-CONNECT SYSTEM MARKET,2021-2031($MILLION)
    FIGURE 30. REST OF ASIA-PACIFIC CROSS-CONNECT SYSTEM MARKET,2021-2031($MILLION)
    FIGURE 31. LATIN AMERICA CROSS-CONNECT SYSTEM MARKET,2021-2031($MILLION)
    FIGURE 32. MIDDLE EAST CROSS-CONNECT SYSTEM MARKET,2021-2031($MILLION)
    FIGURE 33. AFRICA CROSS-CONNECT SYSTEM MARKET,2021-2031($MILLION)
    FIGURE 34. TOP WINNING STRATEGIES, BY YEAR
    FIGURE 35. TOP WINNING STRATEGIES, BY DEVELOPMENT
    FIGURE 36. TOP WINNING STRATEGIES, BY COMPANY
    FIGURE 37. PRODUCT MAPPING OF TOP 10 PLAYERS
    FIGURE 38. COMPETITIVE DASHBOARD
    FIGURE 39. COMPETITIVE HEATMAP OF TOP 10 KEY PLAYERS
    FIGURE 40. TOP PLAYER POSITIONING, 2021
    FIGURE 41. HUAWEI TECHNOLOGIES CO., LTD..: NET SALES ($MILLION)
    FIGURE 42. OPTIWAVE SYSTEMS INC..: NET SALES ($MILLION)
    FIGURE 43. SERCALO MICROTECHNOLOGY LTD..: NET SALES ($MILLION)
    FIGURE 44. XROS INC..: NET SALES ($MILLION)
    FIGURE 45. COMMSCOPE.: NET SALES ($MILLION)
    FIGURE 46. EQUINIX, INC..: NET SALES ($MILLION)
    FIGURE 47. CORESITE.: NET SALES ($MILLION)
    FIGURE 48. CYXTERA TECHNOLOGIES INC..: NET SALES ($MILLION)
    FIGURE 49. FUJITSU LTD..: NET SALES ($MILLION)
    FIGURE 50. ZTE CORPORATION.: NET SALES ($MILLION)


PURCHASE OPTIONS

Call or Email us

U.S.-Canada Toll-free: +1-800-792-5285
Int'l : +1-503-894-6022
Europe : +44-845-528-1300
Email : help@alliedmarketresearch.com
 
FREQUENTLY ASKED QUESTIONS?

A. Connectivity is the leading application of the Cross-Connect System Market.

A. North America is the largest regional market for Cross-Connect System.

A. The industry size of Cross-Connect System is estimated to be $2,483.9 million in 2021

A. Huawei Technologies Co., Ltd., Optiwave Systems Inc., Fujitsu Ltd., Sercalo Microtechnology Ltd. and others are the top companies to hold the market share in the Cross-Connect System Market.

A. The Cross-Connect System Market is expected to grow at a CAGR of 11.12% from 2022-2031.

Looking for Customization?

 Customization Request

Have a Question?

 Speak with Analyst

Any Confusion?

 Inquire Before Buying

Have a glance of the Report

  Request Sample
RELATED TAGS

Purchase Full Report of
Cross-connect System Market

Start reading instantly.
This Report and over 68,075+ more Reports, Available with Avenue Library. T&C*.

  • Online Only
  • $3,570
  • Online cloud access only
  • Restricted print, copy, paste & download
  • Read only
  • Free industry update
    (Within 180 days)
  • Free report update in next update cycle
    (Jan 2024 - Jan 2025)
  • Data Pack
  • $3,840
  • Restricted to one authorized user
  • One print only
  • Available in
    Excel
  • Free industry update
    (Within 180 days)
  •   Free report update in next update cycle
    (Jan 2024 - Jan 2025)
  • Single User
  • $5,730
  • Restricted to one authorized user
  • One print only
  • Available in
    PDF
  • Free industry update
    (Within 180 days)
  •   Free report update in next update cycle
    (Jan 2024 - Jan 2025)
  • Five Users
  • $6,450
  • Limited to five authorized users
  • Print upto five copies
  • Available in
    PDF
  • Free industry update
    (Within 180 days)
  •   Free report update in next update cycle
    (Jan 2024 - Jan 2025)
  • Enterprise
    License/PDF

  • $9,600
  • Unlimited
    within
    company/enterprise
  • Available in Excel & PDF
  • Free industry update
    (Within 180 days)
  •   Free report update in next update cycle
    (Jan 2024 - Jan 2025)
  • Library
    Membership

  • $999 $ 1,175
    Per User/ Per month/ Billed annually
  • Published Content
    E-access
  • Company Profiles
    E-access
  • Newly Added Content Access
  • 10 PDF
    Downloads
  • 5 Excel Data
    Pack Downloads
  • 250 Company Profiles PDF Downloads
  • Buy Now

*Taxes/Fees, if applicable will be added during checkout. All prices in USD

RELATED REPORTS
 

Why Allied Market Research?


Infallible Methodology

To ensure high-level data integrity, accurate analysis, and impeccable forecasts

Analyst Support

For complete satisfaction

Customization

On-demand customization of scope of the report to exactly meet your needs

TARGETED MARKET VIEW

Targeted market view to provide pertinent information and save time of readers

Get fresh content delivered

Get insights on topics that are crucial for your business. Stay abreast of your interest areas.

Get Industry Data Alerts

Why Allied Market Research?

Infallible Methodology

To ensure high-level data integrity, accurate analysis, and impeccable forecasts

Analyst Support

For complete satisfaction

Customization

On-demand customization of scope of the report to exactly meet your needs

TARGETED MARKET VIEW

Targeted market view to provide pertinent information and save time of readers