0
New
New
2023
Cross Laminated Timber Market

Cross Laminated Timber Market

by Layer type (3-ply, 5-ply, Other), by Structure type (Wall, Roof and floor, Other), by Application (Residential, Non-Residential): Global Opportunity Analysis and Industry Forecast, 2023-2032

Report Code: A11967
Jul 2023 | Pages: 193
Tables: 197
Charts: 49
  • Formats*:

  • pdf

    Single User License, Five User
    License & Enterprise User License

  • xls

    Data Pack Excel License

  • ppt

    It comes with the additional cost
    of $2500.00 contact sales.


Cross Laminated Timber Market Research, 2032

The Cross Laminated Timber Market size was valued for $1,575.50 million in 2020 and is estimated to reach $3,735.90 million by 2032, exhibiting a CAGR of 8.4% from 2023 to 2032. Furthermore, in terms of volume, the global cross laminated timber market was valued at 75.03 million cubic feet in 2020, and is projected to reach 160.67 million cubic feet by 2032, registering a CAGR of 7.5% from 2023 to 2032. Cross laminated timber is a type of engineered wood construction material manufactured by stacking and gluing two or more layers of solid wood perpendicular to the lower layer. This gives the cross-laminated timber high strength in all four directions. CLT is primarily made of softwood such as spruce, pine, and fir.
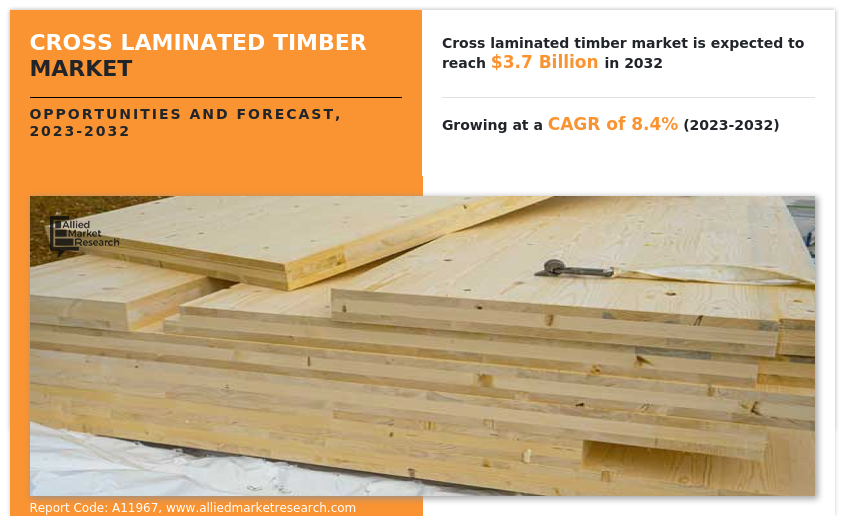
The cross laminated timber market is anticipated to grow with a considerable CAGR in the coming decade, however, the market is negatively impacted by the inflation triggered by the war in Ukraine and the impact of the coronavirus pandemic. The high prices of raw materials and the continued rise in the cost of energy have severe impacts on the construction industry; thereby, limiting the cross laminated timber market growth.

Cross Laminated Timber Market

Market Dynamics

The cross laminated timber market is primarily driven by various factors such as the growing demand for premium and affordable residential and non-residential buildings to accommodate the increasing population worldwide. Simultaneously, the rising pollution is driving demand for sustainable construction materials including cross-laminated timber.

Cross-laminated Timber (CLT) is an environment-friendly construction material, which is typically made from wood sourced from sustainably harvested forests. The use of CLT helps reduce carbon emissions from the overall construction process and promotes the use of renewable resources. CLT has comparable strength to steel or concrete, thus providing excellent load-bearing capacity and dimensional stability. In addition, properties such as fire resistance, and higher thermal insulation than steel and concrete make CLT a suitable choice for residential and commercial buildings. For instance, in 2020, the production of CLT in Italy, the Czech Republic, and the DACH region which includes Germany, Austria, and Switzerland, increased, and crossed the sales volume of 1 million m³ for the first time. In addition, in 2021, major CLT producers such as HBS Berga, KLH, the Pfeifer Group, and Schwarzwald Holzbausysteme, expanded their production capabilities in Europe to meet the increasing demand for CLT. Such an increase in the production of CLT driven by rising demand for CLT from the rising construction sector in the region is fostering the growth of the market. Additionally, cross-laminated timber is widely used in the construction of prefabricated housing across the world. The concept of prefabricated housing was first unveiled at the end of World War 2, and it has since been evolving with respect to technology, design flexibility, and durability. It involves the construction of houses using cross-laminated timbers as well as other materials at offsite manufacturing facilities, which are then shipped to and assembled at the predefined location, resulting in quick and inexpensive construction. In addition, stringent environmental regulations, resulting from concerns over increasing pollution, and labor shortages due to the aging population are playing a crucial role in the growth of the prefabrication housing industry which is driving the growth of the cross-laminated timber. Prefabricated houses are provided with enhanced efficiency, resilience, and versatility, thus meeting the long-term demand and construction requirements of high-performance houses. Countries such as Japan, China, the U.S., Sweden, and various others are leading the cross-laminated timber prefabricated houses industry. For instance, in 2021, Green Canopy Homes, a U.S.-based CLT modular home manufacturer merged with NODE a construction technology company to form Green Canopy NODE. The new company is involved in conventional construction as well as sales of prefabricated Integrated Building Kits and Utility Kits. In March 2023, the same company unveiled a prototype made of CLT which has two stories, 1,200 sq. ft. of floor space, two bedrooms, 1.5 bathrooms, and a rooftop deck. In addition, in 2021, Forterra, a major wood-based construction material manufacturer unveiled its Forest to Home initiative, where it acquires sustainably harvested local timber, processes it to cross-laminated timber, and then uses it for modular homes. Moreover, in October 2021, Countryside, a UK-based closed panel home manufacturer delivered its 5,000th closed panel home to Ribblesdale Place in Accrington, Lancashire. Such developments in the CLT-based prefabricated homes is positively affecting the cross laminated timber market overview.

However, the high initial cost of the cross-laminated timber (CLT) is a major restraint for the market growth. For example, according to a study published in the Forest Products Journal (2020), Volume 70, Issue 4, a mass timber building has 26% higher front-end costs than its concrete alternative.

Moreover, technological development is a primary cross laminated timber market opportunity for the key market players. The introduction of automation in the cross-laminated timber is expected to play a crucial role in the market growth. For instance, February 2022, Stora Enso OYJ, invested more than $10 million in the development of its automated CLT (cross-laminated timber) coating line at the YBBS sawmill in Austria. This facility is anticipated to be completed in the third quarter of 2023 and will offer pre-applied CLT coatings on the CLT walls and floors. This will allow the company to solve the issue of labor shortage and will also help the company to increase and optimize the production in a given time frame.

The cross laminated timber market witnesses various obstructions in its regular operations due to the COVID-19 pandemic and inflation. Earlier, the global lockdowns resulted in reduced construction activities, eventually leading to reduced demand for cross-laminated timber from various sectors such as construction and industrial. However, COVID-19 has subsided, and the major manufacturers in 2023 are performing well. Contrarily, the rise in global inflation is a new major obstructing factor for the entire industry. The inflation, which is a direct result of the Ukraine-Russia war and few long-term impacts of the coronavirus pandemic, has introduced volatility in the prices of wood used for manufacturing cross-laminated timber. In addition, the cost of oil & gas has also increased substantially, and many countries; especially, the countries in Europe, Latin America, North America, and Sub-Saharan Africa experience severe negative impacts in industrial production, including the production of cross-laminated timber. Moreover, the cost of construction has risen substantially, discouraging builders from initiating new projects, which is also expected to negatively affect the cross laminated timber market growth. However, India and China are performing relatively well. In addition, inflation is expected to worsen in the coming years, as the possibility of the ending of the war between Ukraine and Russia is less. However, with the continued talks between different countries, a peace agreement between Ukraine and Russia can be devised, which is expected to end the war between them and reduce the global inflation.

Segmental Overview

The cross laminated timber market is segmented on the basis of layer type, structure type, application, and region. By layer type, the market is divided into 3-Ply, 5-Ply, and 7-Ply. Depending upon the structure type, the market is categorized into wall, roof and floor, and others. On the basis of application, it is divided into residential and non-residential. Region-wise, it is analyzed across North America (U.S., Canada, and Mexico), Europe (Germany, France, Italy, UK, and rest of Europe), Asia-Pacific (China, India, Japan, South Korea, and rest of Asia-Pacific), and LAMEA (Latin America, Middle East, and Africa).

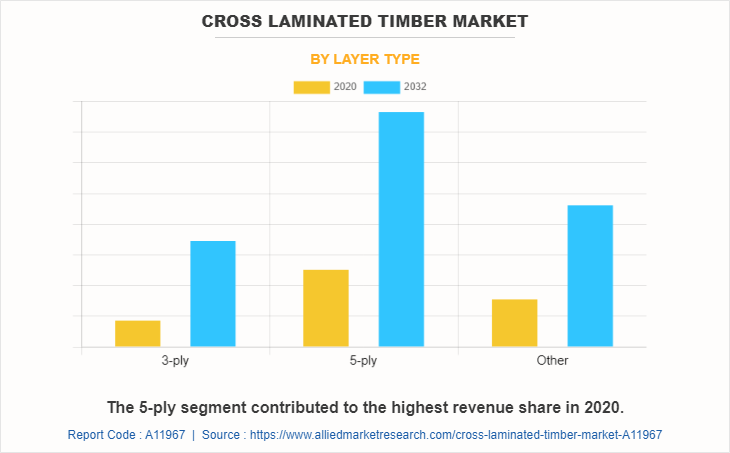
By layer type: The cross laminated timber market is divided into 3-Ply, 5-Ply, and 7-Ply. In 2022, the 5-ply cross laminated timber segment dominated the cross laminated timber market share, in terms of revenue, the same segment is expected to dominate the cross laminated timber market forecast by growing with a higher CAGR. The 5-ply CLT is among the most cost-effective CLT and offers a perfect balance in terms of their cost as well as strength. It comprises a number of layers, making them lighter and easy to handle during construction. Moreover, it can support larger spans and heavier loads, as compared to 3-ply CLT. It exhibits improved resistance to horizontal forces, such as wind loads. This makes them suitable for structures in regions with higher wind loads or seismic activity.
Cross Laminated Timber Market

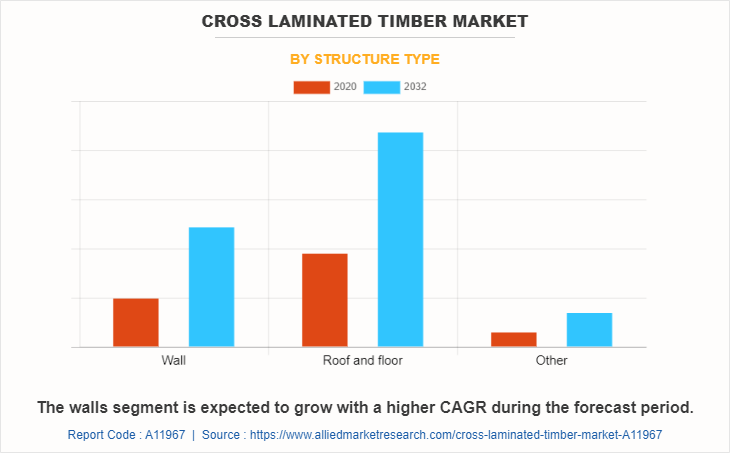
By structure type: The cross laminated timber market is divided into wall, rood and floor, and others. In 2022, the roof and floor segment dominated the cross laminated timber market, in terms of revenue, and the walls segment is expected to witness growth at a higher CAGR during the forecast period. CLT panels provide excellent structural performance for roofs and floors. The cross-laminated configuration of solid wood layers creates a strong and rigid material capable of supporting heavy loads and spanning large distances. Moreover, the wall segment includes the use of cross-laminated timber panels for the construction of walls in buildings. Such factors are driving the growth of others segment.
Cross Laminated Timber Market

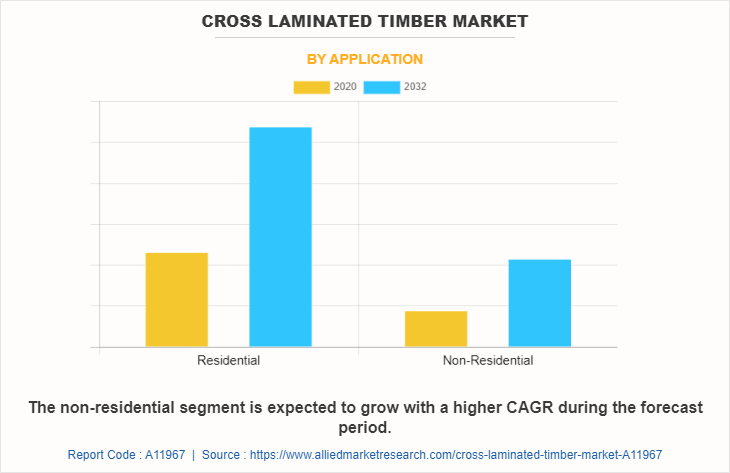
By application: The cross laminated timber market is divided into residential and non-residential. The residential segment accounted for the highest market share in 2022. The residential construction segment has witnessed substantial growth due to an increase in population, eventually leading to an increased number of households in countries such as the U.S., Japan, and others. However, the non-residential segment is anticipated to register a higher growth rate during the forecast period, owing to a rise in industrialization, especially in the developing nations.
Cross Laminated Timber Market

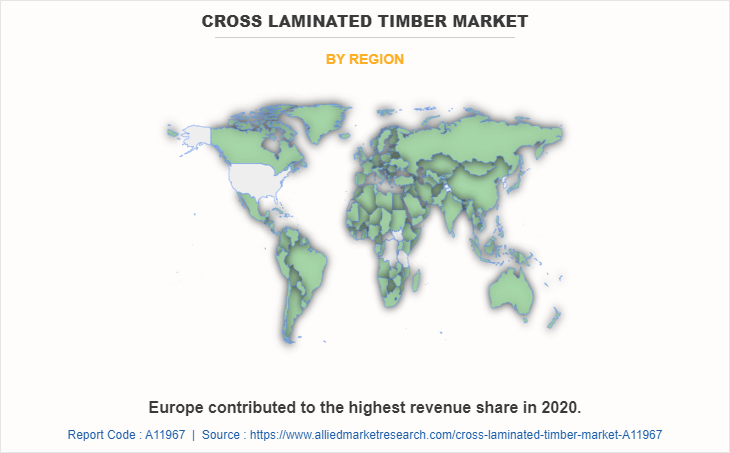
By region: Europe accounted for the highest market share in 2022 and North America is expected to grow with a highest CAGR during the forecast period. Europe has been in the forefront of the cross laminated timber market as it is the largest producer of CLT and is also a major consumer. Moreover, Asia-Pacific is a highly developing region with the fastest growing population. According to the United Nations, nearly two-thirds of the world population resides in Asia-Pacific, with China and India alone accounting for one-third of the global population. In addition, the rate of urbanization in Asia-Pacific is also high. Thus, owing to high population growth and urbanization in the region, demand for construction is high, thereby, positively affecting the cross laminated timber market.
Cross Laminated Timber Market

  Competition Analysis

Competitive analysis and profiles of the major players in the cross laminated timber market are provided in the report. Major companies in the report include Mayr-Melnhof Holz Holding AG, Mercer International Inc., SmartLam LLC, Stora Enso Oyj, KLH Massivholz GmbH, XLam Pty Ltd., SIPEUROPE s.r.o., Schilliger Holz AG, HESS TIMBER GmbH, and Binderholz GmbH & Co. KG.

Major players adopt development strategies such as product launches, product development, acquisition, and expansion to remain competitive in the market. For instance, in May 2022, Stora Enso acquired 35% shares of France based ACDF Industrie SAS which is involved in manufacturing engineered wood products like CLT, Glulam and LVL (laminated veneer lumber). This move will help Stora Enso to capitalize on the increasing demand for timber in France.

Key Benefits for Stakeholders

  • The report provides an extensive analysis of the current and emerging cross laminated timber market trends and historic data. 
  • In-depth cross laminated timber market analysis is conducted by constructing market estimations for key market segments between 2020 and 2032.
  • Extensive analysis of the cross laminated timber market is conducted by following key product positioning and monitoring of top competitors within the market framework.
  • A comprehensive analysis of all the regions is provided to determine the prevailing opportunities.
  • The cross laminated timber market revenue and volume forecast analysis from 2023 to 2032 is included in the report.
  • The key players within the cross laminated timber market are profiled in this report and their strategies are analyzed thoroughly, which helps understand the competitive outlook of the cross laminated timber industry.


Cross Laminated Timber Market Report Highlights

Aspects Details
Market Size By 2032 USD 3.7 billion
Growth Rate CAGR of 8.4%
Forecast period 2020 - 2032
Report Pages 193
By Layer type
  • 3-ply
  • 5-ply
  • Other
By Structure type
  • Wall
  • Roof and floor
  • Other
By Application
  • Residential
  • Non-Residential
By Region
  • North America  (U.S., Canada, Mexico)
  • Europe  (Germany, France, UK, Italy, Rest of Europe)
  • Asia-Pacific  (China, Japan, India, South Korea, Rest of Asia-Pacific)
  • LAMEA  (Latin America, Middle East, Africa)
Key Market Players Binderholz GmbH & Co. KG, KLH Massivholz GmbH, Mercer International Inc., Schilliger Holz AG, HESS TIMBER GmbH, SIPEUROPE s.r.o., SmartLam LLC, Stora Enso Oyj, Mayr-Melnhof Holz Holding AG, XLam Pty Ltd.

Analyst Review

The cross-laminated timber (CLT) market has witnessed significant growth in the past few years, owing to an increase in construction activities involving the use of strong, durable, and sustainable construction materials. As per DI Richard Stralz, Chairman of the Board and CEO of Mayr-Melnhof Holz Holding AG, in the last two decades demand for CLT is driven by efforts to use more climate-friendly, and sustainable resources. In an interview he said, one cubic meter of wood is able to bind one ton of CO2.  Moreover, wood including CLT replaces other CO2 intensive, non-renewable materials and thus prevents the emission of greenhouse gases from the construction sector at large.

In addition, Europe is the leader in the construction involving cross-laminated timber and is expected to be a major driver for the market in the coming years as well. On the other hand, a greater potential for growth of the CLT market lies in Asia-Pacific, owing to its high population growth and the targets that the government has put forth to reduce pollution.

The developing nations are still lagging behind the developed nations when it comes to the active adoption of cross laminate timber. This is attributed to the unavailability of enough resources. Furthermore, the lower-income countries are still to be industrialized, and their contribution to global climate change is very less; thus, they have not actively incentivized the use of timber. Similarly, countries experiencing large-scale deforestation are also not inclined toward adopting CLT in construction.

 
  • CHAPTER 1: INTRODUCTION

    • 1.1. Report description

    • 1.2. Key market segments

    • 1.3. Key benefits to the stakeholders

    • 1.4. Research Methodology

      • 1.4.1. Primary research

      • 1.4.2. Secondary research

      • 1.4.3. Analyst tools and models

  • CHAPTER 2: EXECUTIVE SUMMARY

    • 2.1. CXO Perspective

  • CHAPTER 3: MARKET OVERVIEW

    • 3.1. Market definition and scope

    • 3.2. Key findings

      • 3.2.1. Top impacting factors

      • 3.2.2. Top investment pockets

    • 3.3. Porter’s five forces analysis

      • 3.3.1. Low bargaining power of suppliers

      • 3.3.2. Low threat of new entrants

      • 3.3.3. Low threat of substitutes

      • 3.3.4. Low intensity of rivalry

      • 3.3.5. Low bargaining power of buyers

    • 3.4. Market dynamics

      • 3.4.1. Drivers

        • 3.4.1.1. Growth of the building construction industry
        • 3.4.1.2. Rise in demand for sustainable construction materials
        • 3.4.1.3. Advantages of cross-laminated timber

      • 3.4.2. Restraints

        • 3.4.2.1. High initial cost
        • 3.4.2.2. Structural Limitations

      • 3.4.3. Opportunities

        • 3.4.3.1. Introduction of automation in CLT production

    • 3.5. COVID-19 Impact Analysis on the market

  • CHAPTER 4: CROSS LAMINATED TIMBER MARKET, BY LAYER TYPE

    • 4.1. Overview

      • 4.1.1. Market size and forecast

    • 4.2. 3-ply

      • 4.2.1. Key market trends, growth factors and opportunities

      • 4.2.2. Market size and forecast, by region

      • 4.2.3. Market share analysis by country

    • 4.3. 5-ply

      • 4.3.1. Key market trends, growth factors and opportunities

      • 4.3.2. Market size and forecast, by region

      • 4.3.3. Market share analysis by country

    • 4.4. Other

      • 4.4.1. Key market trends, growth factors and opportunities

      • 4.4.2. Market size and forecast, by region

      • 4.4.3. Market share analysis by country

  • CHAPTER 5: CROSS LAMINATED TIMBER MARKET, BY STRUCTURE TYPE

    • 5.1. Overview

      • 5.1.1. Market size and forecast

    • 5.2. Wall

      • 5.2.1. Key market trends, growth factors and opportunities

      • 5.2.2. Market size and forecast, by region

      • 5.2.3. Market share analysis by country

    • 5.3. Roof and floor

      • 5.3.1. Key market trends, growth factors and opportunities

      • 5.3.2. Market size and forecast, by region

      • 5.3.3. Market share analysis by country

    • 5.4. Other

      • 5.4.1. Key market trends, growth factors and opportunities

      • 5.4.2. Market size and forecast, by region

      • 5.4.3. Market share analysis by country

  • CHAPTER 6: CROSS LAMINATED TIMBER MARKET, BY APPLICATION

    • 6.1. Overview

      • 6.1.1. Market size and forecast

    • 6.2. Residential

      • 6.2.1. Key market trends, growth factors and opportunities

      • 6.2.2. Market size and forecast, by region

      • 6.2.3. Market share analysis by country

    • 6.3. Non-Residential

      • 6.3.1. Key market trends, growth factors and opportunities

      • 6.3.2. Market size and forecast, by region

      • 6.3.3. Market share analysis by country

  • CHAPTER 7: CROSS LAMINATED TIMBER MARKET, BY REGION

    • 7.1. Overview

      • 7.1.1. Market size and forecast By Region

    • 7.2. North America

      • 7.2.1. Key trends and opportunities

      • 7.2.2. Market size and forecast, by Layer type

      • 7.2.3. Market size and forecast, by Structure type

      • 7.2.4. Market size and forecast, by Application

      • 7.2.5. Market size and forecast, by country

        • 7.2.5.1. U.S.
          • 7.2.5.1.1. Key market trends, growth factors and opportunities
          • 7.2.5.1.2. Market size and forecast, by Layer type
          • 7.2.5.1.3. Market size and forecast, by Structure type
          • 7.2.5.1.4. Market size and forecast, by Application
        • 7.2.5.2. Canada
          • 7.2.5.2.1. Key market trends, growth factors and opportunities
          • 7.2.5.2.2. Market size and forecast, by Layer type
          • 7.2.5.2.3. Market size and forecast, by Structure type
          • 7.2.5.2.4. Market size and forecast, by Application
        • 7.2.5.3. Mexico
          • 7.2.5.3.1. Key market trends, growth factors and opportunities
          • 7.2.5.3.2. Market size and forecast, by Layer type
          • 7.2.5.3.3. Market size and forecast, by Structure type
          • 7.2.5.3.4. Market size and forecast, by Application
    • 7.3. Europe

      • 7.3.1. Key trends and opportunities

      • 7.3.2. Market size and forecast, by Layer type

      • 7.3.3. Market size and forecast, by Structure type

      • 7.3.4. Market size and forecast, by Application

      • 7.3.5. Market size and forecast, by country

        • 7.3.5.1. Germany
          • 7.3.5.1.1. Key market trends, growth factors and opportunities
          • 7.3.5.1.2. Market size and forecast, by Layer type
          • 7.3.5.1.3. Market size and forecast, by Structure type
          • 7.3.5.1.4. Market size and forecast, by Application
        • 7.3.5.2. France
          • 7.3.5.2.1. Key market trends, growth factors and opportunities
          • 7.3.5.2.2. Market size and forecast, by Layer type
          • 7.3.5.2.3. Market size and forecast, by Structure type
          • 7.3.5.2.4. Market size and forecast, by Application
        • 7.3.5.3. UK
          • 7.3.5.3.1. Key market trends, growth factors and opportunities
          • 7.3.5.3.2. Market size and forecast, by Layer type
          • 7.3.5.3.3. Market size and forecast, by Structure type
          • 7.3.5.3.4. Market size and forecast, by Application
        • 7.3.5.4. Italy
          • 7.3.5.4.1. Key market trends, growth factors and opportunities
          • 7.3.5.4.2. Market size and forecast, by Layer type
          • 7.3.5.4.3. Market size and forecast, by Structure type
          • 7.3.5.4.4. Market size and forecast, by Application
        • 7.3.5.5. Rest of Europe
          • 7.3.5.5.1. Key market trends, growth factors and opportunities
          • 7.3.5.5.2. Market size and forecast, by Layer type
          • 7.3.5.5.3. Market size and forecast, by Structure type
          • 7.3.5.5.4. Market size and forecast, by Application
    • 7.4. Asia-Pacific

      • 7.4.1. Key trends and opportunities

      • 7.4.2. Market size and forecast, by Layer type

      • 7.4.3. Market size and forecast, by Structure type

      • 7.4.4. Market size and forecast, by Application

      • 7.4.5. Market size and forecast, by country

        • 7.4.5.1. China
          • 7.4.5.1.1. Key market trends, growth factors and opportunities
          • 7.4.5.1.2. Market size and forecast, by Layer type
          • 7.4.5.1.3. Market size and forecast, by Structure type
          • 7.4.5.1.4. Market size and forecast, by Application
        • 7.4.5.2. Japan
          • 7.4.5.2.1. Key market trends, growth factors and opportunities
          • 7.4.5.2.2. Market size and forecast, by Layer type
          • 7.4.5.2.3. Market size and forecast, by Structure type
          • 7.4.5.2.4. Market size and forecast, by Application
        • 7.4.5.3. India
          • 7.4.5.3.1. Key market trends, growth factors and opportunities
          • 7.4.5.3.2. Market size and forecast, by Layer type
          • 7.4.5.3.3. Market size and forecast, by Structure type
          • 7.4.5.3.4. Market size and forecast, by Application
        • 7.4.5.4. South Korea
          • 7.4.5.4.1. Key market trends, growth factors and opportunities
          • 7.4.5.4.2. Market size and forecast, by Layer type
          • 7.4.5.4.3. Market size and forecast, by Structure type
          • 7.4.5.4.4. Market size and forecast, by Application
        • 7.4.5.5. Rest of Asia-Pacific
          • 7.4.5.5.1. Key market trends, growth factors and opportunities
          • 7.4.5.5.2. Market size and forecast, by Layer type
          • 7.4.5.5.3. Market size and forecast, by Structure type
          • 7.4.5.5.4. Market size and forecast, by Application
    • 7.5. LAMEA

      • 7.5.1. Key trends and opportunities

      • 7.5.2. Market size and forecast, by Layer type

      • 7.5.3. Market size and forecast, by Structure type

      • 7.5.4. Market size and forecast, by Application

      • 7.5.5. Market size and forecast, by country

        • 7.5.5.1. Latin America
          • 7.5.5.1.1. Key market trends, growth factors and opportunities
          • 7.5.5.1.2. Market size and forecast, by Layer type
          • 7.5.5.1.3. Market size and forecast, by Structure type
          • 7.5.5.1.4. Market size and forecast, by Application
        • 7.5.5.2. Middle East
          • 7.5.5.2.1. Key market trends, growth factors and opportunities
          • 7.5.5.2.2. Market size and forecast, by Layer type
          • 7.5.5.2.3. Market size and forecast, by Structure type
          • 7.5.5.2.4. Market size and forecast, by Application
        • 7.5.5.3. Africa
          • 7.5.5.3.1. Key market trends, growth factors and opportunities
          • 7.5.5.3.2. Market size and forecast, by Layer type
          • 7.5.5.3.3. Market size and forecast, by Structure type
          • 7.5.5.3.4. Market size and forecast, by Application
  • CHAPTER 8: COMPETITIVE LANDSCAPE

    • 8.1. Introduction

    • 8.2. Top winning strategies

    • 8.3. Product Mapping of Top 10 Player

    • 8.4. Competitive Dashboard

    • 8.5. Competitive Heatmap

    • 8.6. Top player positioning, 2020

  • CHAPTER 9: COMPANY PROFILES

    • 9.1. KLH Massivholz GmbH

      • 9.1.1. Company overview

      • 9.1.2. Key Executives

      • 9.1.3. Company snapshot

      • 9.1.4. Operating business segments

      • 9.1.5. Product portfolio

    • 9.2. Mayr-Melnhof Holz Holding AG

      • 9.2.1. Company overview

      • 9.2.2. Key Executives

      • 9.2.3. Company snapshot

      • 9.2.4. Operating business segments

      • 9.2.5. Product portfolio

      • 9.2.6. Key strategic moves and developments

    • 9.3. Mercer International Inc.

      • 9.3.1. Company overview

      • 9.3.2. Key Executives

      • 9.3.3. Company snapshot

      • 9.3.4. Operating business segments

      • 9.3.5. Product portfolio

      • 9.3.6. Business performance

      • 9.3.7. Key strategic moves and developments

    • 9.4. HESS TIMBER GmbH

      • 9.4.1. Company overview

      • 9.4.2. Key Executives

      • 9.4.3. Company snapshot

      • 9.4.4. Operating business segments

      • 9.4.5. Product portfolio

    • 9.5. Schilliger Holz AG

      • 9.5.1. Company overview

      • 9.5.2. Key Executives

      • 9.5.3. Company snapshot

      • 9.5.4. Operating business segments

      • 9.5.5. Product portfolio

      • 9.5.6. Key strategic moves and developments

    • 9.6. SIPEUROPE s.r.o.

      • 9.6.1. Company overview

      • 9.6.2. Key Executives

      • 9.6.3. Company snapshot

      • 9.6.4. Operating business segments

      • 9.6.5. Product portfolio

    • 9.7. SmartLam LLC

      • 9.7.1. Company overview

      • 9.7.2. Key Executives

      • 9.7.3. Company snapshot

      • 9.7.4. Operating business segments

      • 9.7.5. Product portfolio

    • 9.8. Stora Enso Oyj

      • 9.8.1. Company overview

      • 9.8.2. Key Executives

      • 9.8.3. Company snapshot

      • 9.8.4. Operating business segments

      • 9.8.5. Product portfolio

      • 9.8.6. Business performance

      • 9.8.7. Key strategic moves and developments

    • 9.9. XLam Pty Ltd.

      • 9.9.1. Company overview

      • 9.9.2. Key Executives

      • 9.9.3. Company snapshot

      • 9.9.4. Operating business segments

      • 9.9.5. Product portfolio

    • 9.10. Binderholz GmbH & Co. KG

      • 9.10.1. Company overview

      • 9.10.2. Key Executives

      • 9.10.3. Company snapshot

      • 9.10.4. Operating business segments

      • 9.10.5. Product portfolio

      • 9.10.6. Key strategic moves and developments

  • LIST OF TABLES

  • TABLE 01. GLOBAL CROSS LAMINATED TIMBER MARKET, BY LAYER TYPE, 2020-2032 ($MILLION)
    TABLE 02. GLOBAL CROSS LAMINATED TIMBER MARKET, BY LAYER TYPE, 2020-2032 (MILLION CUBIC FEET)
    TABLE 03. CROSS LAMINATED TIMBER MARKET FOR 3-PLY, BY REGION, 2020-2032 ($MILLION)
    TABLE 04. CROSS LAMINATED TIMBER MARKET FOR 3-PLY, BY REGION, 2020-2032 (MILLION CUBIC FEET)
    TABLE 05. CROSS LAMINATED TIMBER MARKET FOR 5-PLY, BY REGION, 2020-2032 ($MILLION)
    TABLE 06. CROSS LAMINATED TIMBER MARKET FOR 5-PLY, BY REGION, 2020-2032 (MILLION CUBIC FEET)
    TABLE 07. CROSS LAMINATED TIMBER MARKET FOR OTHER, BY REGION, 2020-2032 ($MILLION)
    TABLE 08. CROSS LAMINATED TIMBER MARKET FOR OTHER, BY REGION, 2020-2032 (MILLION CUBIC FEET)
    TABLE 09. GLOBAL CROSS LAMINATED TIMBER MARKET, BY STRUCTURE TYPE, 2020-2032 ($MILLION)
    TABLE 10. GLOBAL CROSS LAMINATED TIMBER MARKET, BY STRUCTURE TYPE, 2020-2032 (MILLION CUBIC FEET)
    TABLE 11. CROSS LAMINATED TIMBER MARKET FOR WALL, BY REGION, 2020-2032 ($MILLION)
    TABLE 12. CROSS LAMINATED TIMBER MARKET FOR WALL, BY REGION, 2020-2032 (MILLION CUBIC FEET)
    TABLE 13. CROSS LAMINATED TIMBER MARKET FOR ROOF AND FLOOR, BY REGION, 2020-2032 ($MILLION)
    TABLE 14. CROSS LAMINATED TIMBER MARKET FOR ROOF AND FLOOR, BY REGION, 2020-2032 (MILLION CUBIC FEET)
    TABLE 15. CROSS LAMINATED TIMBER MARKET FOR OTHER, BY REGION, 2020-2032 ($MILLION)
    TABLE 16. CROSS LAMINATED TIMBER MARKET FOR OTHER, BY REGION, 2020-2032 (MILLION CUBIC FEET)
    TABLE 17. GLOBAL CROSS LAMINATED TIMBER MARKET, BY APPLICATION, 2020-2032 ($MILLION)
    TABLE 18. GLOBAL CROSS LAMINATED TIMBER MARKET, BY APPLICATION, 2020-2032 (MILLION CUBIC FEET)
    TABLE 19. CROSS LAMINATED TIMBER MARKET FOR RESIDENTIAL, BY REGION, 2020-2032 ($MILLION)
    TABLE 20. CROSS LAMINATED TIMBER MARKET FOR RESIDENTIAL, BY REGION, 2020-2032 (MILLION CUBIC FEET)
    TABLE 21. CROSS LAMINATED TIMBER MARKET FOR NON-RESIDENTIAL, BY REGION, 2020-2032 ($MILLION)
    TABLE 22. CROSS LAMINATED TIMBER MARKET FOR NON-RESIDENTIAL, BY REGION, 2020-2032 (MILLION CUBIC FEET)
    TABLE 23. CROSS LAMINATED TIMBER MARKET, BY REGION, 2020-2032 ($MILLION)
    TABLE 24. CROSS LAMINATED TIMBER MARKET, BY REGION, 2020-2032 (MILLION CUBIC FEET)
    TABLE 25. NORTH AMERICA CROSS LAMINATED TIMBER MARKET, BY LAYER TYPE, 2020-2032 ($MILLION)
    TABLE 26. NORTH AMERICA CROSS LAMINATED TIMBER MARKET, BY LAYER TYPE, 2020-2032 (MILLION CUBIC FEET)
    TABLE 27. NORTH AMERICA CROSS LAMINATED TIMBER MARKET, BY STRUCTURE TYPE, 2020-2032 ($MILLION)
    TABLE 28. NORTH AMERICA CROSS LAMINATED TIMBER MARKET, BY STRUCTURE TYPE, 2020-2032 (MILLION CUBIC FEET)
    TABLE 29. NORTH AMERICA CROSS LAMINATED TIMBER MARKET, BY APPLICATION, 2020-2032 ($MILLION)
    TABLE 30. NORTH AMERICA CROSS LAMINATED TIMBER MARKET, BY APPLICATION, 2020-2032 (MILLION CUBIC FEET)
    TABLE 31. NORTH AMERICA CROSS LAMINATED TIMBER MARKET, BY COUNTRY, 2020-2032 ($MILLION)
    TABLE 32. NORTH AMERICA CROSS LAMINATED TIMBER MARKET, BY COUNTRY, 2020-2032 (MILLION CUBIC FEET)
    TABLE 33. U.S. CROSS LAMINATED TIMBER MARKET, BY LAYER TYPE, 2020-2032 ($MILLION)
    TABLE 34. U.S. CROSS LAMINATED TIMBER MARKET, BY LAYER TYPE, 2020-2032 (MILLION CUBIC FEET)
    TABLE 35. U.S. CROSS LAMINATED TIMBER MARKET, BY STRUCTURE TYPE, 2020-2032 ($MILLION)
    TABLE 36. U.S. CROSS LAMINATED TIMBER MARKET, BY STRUCTURE TYPE, 2020-2032 (MILLION CUBIC FEET)
    TABLE 37. U.S. CROSS LAMINATED TIMBER MARKET, BY APPLICATION, 2020-2032 ($MILLION)
    TABLE 38. U.S. CROSS LAMINATED TIMBER MARKET, BY APPLICATION, 2020-2032 (MILLION CUBIC FEET)
    TABLE 39. CANADA CROSS LAMINATED TIMBER MARKET, BY LAYER TYPE, 2020-2032 ($MILLION)
    TABLE 40. CANADA CROSS LAMINATED TIMBER MARKET, BY LAYER TYPE, 2020-2032 (MILLION CUBIC FEET)
    TABLE 41. CANADA CROSS LAMINATED TIMBER MARKET, BY STRUCTURE TYPE, 2020-2032 ($MILLION)
    TABLE 42. CANADA CROSS LAMINATED TIMBER MARKET, BY STRUCTURE TYPE, 2020-2032 (MILLION CUBIC FEET)
    TABLE 43. CANADA CROSS LAMINATED TIMBER MARKET, BY APPLICATION, 2020-2032 ($MILLION)
    TABLE 44. CANADA CROSS LAMINATED TIMBER MARKET, BY APPLICATION, 2020-2032 (MILLION CUBIC FEET)
    TABLE 45. MEXICO CROSS LAMINATED TIMBER MARKET, BY LAYER TYPE, 2020-2032 ($MILLION)
    TABLE 46. MEXICO CROSS LAMINATED TIMBER MARKET, BY LAYER TYPE, 2020-2032 (MILLION CUBIC FEET)
    TABLE 47. MEXICO CROSS LAMINATED TIMBER MARKET, BY STRUCTURE TYPE, 2020-2032 ($MILLION)
    TABLE 48. MEXICO CROSS LAMINATED TIMBER MARKET, BY STRUCTURE TYPE, 2020-2032 (MILLION CUBIC FEET)
    TABLE 49. MEXICO CROSS LAMINATED TIMBER MARKET, BY APPLICATION, 2020-2032 ($MILLION)
    TABLE 50. MEXICO CROSS LAMINATED TIMBER MARKET, BY APPLICATION, 2020-2032 (MILLION CUBIC FEET)
    TABLE 51. EUROPE CROSS LAMINATED TIMBER MARKET, BY LAYER TYPE, 2020-2032 ($MILLION)
    TABLE 52. EUROPE CROSS LAMINATED TIMBER MARKET, BY LAYER TYPE, 2020-2032 (MILLION CUBIC FEET)
    TABLE 53. EUROPE CROSS LAMINATED TIMBER MARKET, BY STRUCTURE TYPE, 2020-2032 ($MILLION)
    TABLE 54. EUROPE CROSS LAMINATED TIMBER MARKET, BY STRUCTURE TYPE, 2020-2032 (MILLION CUBIC FEET)
    TABLE 55. EUROPE CROSS LAMINATED TIMBER MARKET, BY APPLICATION, 2020-2032 ($MILLION)
    TABLE 56. EUROPE CROSS LAMINATED TIMBER MARKET, BY APPLICATION, 2020-2032 (MILLION CUBIC FEET)
    TABLE 57. EUROPE CROSS LAMINATED TIMBER MARKET, BY COUNTRY, 2020-2032 ($MILLION)
    TABLE 58. EUROPE CROSS LAMINATED TIMBER MARKET, BY COUNTRY, 2020-2032 (MILLION CUBIC FEET)
    TABLE 59. GERMANY CROSS LAMINATED TIMBER MARKET, BY LAYER TYPE, 2020-2032 ($MILLION)
    TABLE 60. GERMANY CROSS LAMINATED TIMBER MARKET, BY LAYER TYPE, 2020-2032 (MILLION CUBIC FEET)
    TABLE 61. GERMANY CROSS LAMINATED TIMBER MARKET, BY STRUCTURE TYPE, 2020-2032 ($MILLION)
    TABLE 62. GERMANY CROSS LAMINATED TIMBER MARKET, BY STRUCTURE TYPE, 2020-2032 (MILLION CUBIC FEET)
    TABLE 63. GERMANY CROSS LAMINATED TIMBER MARKET, BY APPLICATION, 2020-2032 ($MILLION)
    TABLE 64. GERMANY CROSS LAMINATED TIMBER MARKET, BY APPLICATION, 2020-2032 (MILLION CUBIC FEET)
    TABLE 65. FRANCE CROSS LAMINATED TIMBER MARKET, BY LAYER TYPE, 2020-2032 ($MILLION)
    TABLE 66. FRANCE CROSS LAMINATED TIMBER MARKET, BY LAYER TYPE, 2020-2032 (MILLION CUBIC FEET)
    TABLE 67. FRANCE CROSS LAMINATED TIMBER MARKET, BY STRUCTURE TYPE, 2020-2032 ($MILLION)
    TABLE 68. FRANCE CROSS LAMINATED TIMBER MARKET, BY STRUCTURE TYPE, 2020-2032 (MILLION CUBIC FEET)
    TABLE 69. FRANCE CROSS LAMINATED TIMBER MARKET, BY APPLICATION, 2020-2032 ($MILLION)
    TABLE 70. FRANCE CROSS LAMINATED TIMBER MARKET, BY APPLICATION, 2020-2032 (MILLION CUBIC FEET)
    TABLE 71. UK CROSS LAMINATED TIMBER MARKET, BY LAYER TYPE, 2020-2032 ($MILLION)
    TABLE 72. UK CROSS LAMINATED TIMBER MARKET, BY LAYER TYPE, 2020-2032 (MILLION CUBIC FEET)
    TABLE 73. UK CROSS LAMINATED TIMBER MARKET, BY STRUCTURE TYPE, 2020-2032 ($MILLION)
    TABLE 74. UK CROSS LAMINATED TIMBER MARKET, BY STRUCTURE TYPE, 2020-2032 (MILLION CUBIC FEET)
    TABLE 75. UK CROSS LAMINATED TIMBER MARKET, BY APPLICATION, 2020-2032 ($MILLION)
    TABLE 76. UK CROSS LAMINATED TIMBER MARKET, BY APPLICATION, 2020-2032 (MILLION CUBIC FEET)
    TABLE 77. ITALY CROSS LAMINATED TIMBER MARKET, BY LAYER TYPE, 2020-2032 ($MILLION)
    TABLE 78. ITALY CROSS LAMINATED TIMBER MARKET, BY LAYER TYPE, 2020-2032 (MILLION CUBIC FEET)
    TABLE 79. ITALY CROSS LAMINATED TIMBER MARKET, BY STRUCTURE TYPE, 2020-2032 ($MILLION)
    TABLE 80. ITALY CROSS LAMINATED TIMBER MARKET, BY STRUCTURE TYPE, 2020-2032 (MILLION CUBIC FEET)
    TABLE 81. ITALY CROSS LAMINATED TIMBER MARKET, BY APPLICATION, 2020-2032 ($MILLION)
    TABLE 82. ITALY CROSS LAMINATED TIMBER MARKET, BY APPLICATION, 2020-2032 (MILLION CUBIC FEET)
    TABLE 83. REST OF EUROPE CROSS LAMINATED TIMBER MARKET, BY LAYER TYPE, 2020-2032 ($MILLION)
    TABLE 84. REST OF EUROPE CROSS LAMINATED TIMBER MARKET, BY LAYER TYPE, 2020-2032 (MILLION CUBIC FEET)
    TABLE 85. REST OF EUROPE CROSS LAMINATED TIMBER MARKET, BY STRUCTURE TYPE, 2020-2032 ($MILLION)
    TABLE 86. REST OF EUROPE CROSS LAMINATED TIMBER MARKET, BY STRUCTURE TYPE, 2020-2032 (MILLION CUBIC FEET)
    TABLE 87. REST OF EUROPE CROSS LAMINATED TIMBER MARKET, BY APPLICATION, 2020-2032 ($MILLION)
    TABLE 88. REST OF EUROPE CROSS LAMINATED TIMBER MARKET, BY APPLICATION, 2020-2032 (MILLION CUBIC FEET)
    TABLE 89. ASIA-PACIFIC CROSS LAMINATED TIMBER MARKET, BY LAYER TYPE, 2020-2032 ($MILLION)
    TABLE 90. ASIA-PACIFIC CROSS LAMINATED TIMBER MARKET, BY LAYER TYPE, 2020-2032 (MILLION CUBIC FEET)
    TABLE 91. ASIA-PACIFIC CROSS LAMINATED TIMBER MARKET, BY STRUCTURE TYPE, 2020-2032 ($MILLION)
    TABLE 92. ASIA-PACIFIC CROSS LAMINATED TIMBER MARKET, BY STRUCTURE TYPE, 2020-2032 (MILLION CUBIC FEET)
    TABLE 93. ASIA-PACIFIC CROSS LAMINATED TIMBER MARKET, BY APPLICATION, 2020-2032 ($MILLION)
    TABLE 94. ASIA-PACIFIC CROSS LAMINATED TIMBER MARKET, BY APPLICATION, 2020-2032 (MILLION CUBIC FEET)
    TABLE 95. ASIA-PACIFIC CROSS LAMINATED TIMBER MARKET, BY COUNTRY, 2020-2032 ($MILLION)
    TABLE 96. ASIA-PACIFIC CROSS LAMINATED TIMBER MARKET, BY COUNTRY, 2020-2032 (MILLION CUBIC FEET)
    TABLE 97. CHINA CROSS LAMINATED TIMBER MARKET, BY LAYER TYPE, 2020-2032 ($MILLION)
    TABLE 98. CHINA CROSS LAMINATED TIMBER MARKET, BY LAYER TYPE, 2020-2032 (MILLION CUBIC FEET)
    TABLE 99. CHINA CROSS LAMINATED TIMBER MARKET, BY STRUCTURE TYPE, 2020-2032 ($MILLION)
    TABLE 100. CHINA CROSS LAMINATED TIMBER MARKET, BY STRUCTURE TYPE, 2020-2032 (MILLION CUBIC FEET)
    TABLE 101. CHINA CROSS LAMINATED TIMBER MARKET, BY APPLICATION, 2020-2032 ($MILLION)
    TABLE 102. CHINA CROSS LAMINATED TIMBER MARKET, BY APPLICATION, 2020-2032 (MILLION CUBIC FEET)
    TABLE 103. JAPAN CROSS LAMINATED TIMBER MARKET, BY LAYER TYPE, 2020-2032 ($MILLION)
    TABLE 104. JAPAN CROSS LAMINATED TIMBER MARKET, BY LAYER TYPE, 2020-2032 (MILLION CUBIC FEET)
    TABLE 105. JAPAN CROSS LAMINATED TIMBER MARKET, BY STRUCTURE TYPE, 2020-2032 ($MILLION)
    TABLE 106. JAPAN CROSS LAMINATED TIMBER MARKET, BY STRUCTURE TYPE, 2020-2032 (MILLION CUBIC FEET)
    TABLE 107. JAPAN CROSS LAMINATED TIMBER MARKET, BY APPLICATION, 2020-2032 ($MILLION)
    TABLE 108. JAPAN CROSS LAMINATED TIMBER MARKET, BY APPLICATION, 2020-2032 (MILLION CUBIC FEET)
    TABLE 109. INDIA CROSS LAMINATED TIMBER MARKET, BY LAYER TYPE, 2020-2032 ($MILLION)
    TABLE 110. INDIA CROSS LAMINATED TIMBER MARKET, BY LAYER TYPE, 2020-2032 (MILLION CUBIC FEET)
    TABLE 111. INDIA CROSS LAMINATED TIMBER MARKET, BY STRUCTURE TYPE, 2020-2032 ($MILLION)
    TABLE 112. INDIA CROSS LAMINATED TIMBER MARKET, BY STRUCTURE TYPE, 2020-2032 (MILLION CUBIC FEET)
    TABLE 113. INDIA CROSS LAMINATED TIMBER MARKET, BY APPLICATION, 2020-2032 ($MILLION)
    TABLE 114. INDIA CROSS LAMINATED TIMBER MARKET, BY APPLICATION, 2020-2032 (MILLION CUBIC FEET)
    TABLE 115. SOUTH KOREA CROSS LAMINATED TIMBER MARKET, BY LAYER TYPE, 2020-2032 ($MILLION)
    TABLE 116. SOUTH KOREA CROSS LAMINATED TIMBER MARKET, BY LAYER TYPE, 2020-2032 (MILLION CUBIC FEET)
    TABLE 117. SOUTH KOREA CROSS LAMINATED TIMBER MARKET, BY STRUCTURE TYPE, 2020-2032 ($MILLION)
    TABLE 118. SOUTH KOREA CROSS LAMINATED TIMBER MARKET, BY STRUCTURE TYPE, 2020-2032 (MILLION CUBIC FEET)
    TABLE 119. SOUTH KOREA CROSS LAMINATED TIMBER MARKET, BY APPLICATION, 2020-2032 ($MILLION)
    TABLE 120. SOUTH KOREA CROSS LAMINATED TIMBER MARKET, BY APPLICATION, 2020-2032 (MILLION CUBIC FEET)
    TABLE 121. REST OF ASIA-PACIFIC CROSS LAMINATED TIMBER MARKET, BY LAYER TYPE, 2020-2032 ($MILLION)
    TABLE 122. REST OF ASIA-PACIFIC CROSS LAMINATED TIMBER MARKET, BY LAYER TYPE, 2020-2032 (MILLION CUBIC FEET)
    TABLE 123. REST OF ASIA-PACIFIC CROSS LAMINATED TIMBER MARKET, BY STRUCTURE TYPE, 2020-2032 ($MILLION)
    TABLE 124. REST OF ASIA-PACIFIC CROSS LAMINATED TIMBER MARKET, BY STRUCTURE TYPE, 2020-2032 (MILLION CUBIC FEET)
    TABLE 125. REST OF ASIA-PACIFIC CROSS LAMINATED TIMBER MARKET, BY APPLICATION, 2020-2032 ($MILLION)
    TABLE 126. REST OF ASIA-PACIFIC CROSS LAMINATED TIMBER MARKET, BY APPLICATION, 2020-2032 (MILLION CUBIC FEET)
    TABLE 127. LAMEA CROSS LAMINATED TIMBER MARKET, BY LAYER TYPE, 2020-2032 ($MILLION)
    TABLE 128. LAMEA CROSS LAMINATED TIMBER MARKET, BY LAYER TYPE, 2020-2032 (MILLION CUBIC FEET)
    TABLE 129. LAMEA CROSS LAMINATED TIMBER MARKET, BY STRUCTURE TYPE, 2020-2032 ($MILLION)
    TABLE 130. LAMEA CROSS LAMINATED TIMBER MARKET, BY STRUCTURE TYPE, 2020-2032 (MILLION CUBIC FEET)
    TABLE 131. LAMEA CROSS LAMINATED TIMBER MARKET, BY APPLICATION, 2020-2032 ($MILLION)
    TABLE 132. LAMEA CROSS LAMINATED TIMBER MARKET, BY APPLICATION, 2020-2032 (MILLION CUBIC FEET)
    TABLE 133. LAMEA CROSS LAMINATED TIMBER MARKET, BY COUNTRY, 2020-2032 ($MILLION)
    TABLE 134. LAMEA CROSS LAMINATED TIMBER MARKET, BY COUNTRY, 2020-2032 (MILLION CUBIC FEET)
    TABLE 135. LATIN AMERICA CROSS LAMINATED TIMBER MARKET, BY LAYER TYPE, 2020-2032 ($MILLION)
    TABLE 136. LATIN AMERICA CROSS LAMINATED TIMBER MARKET, BY LAYER TYPE, 2020-2032 (MILLION CUBIC FEET)
    TABLE 137. LATIN AMERICA CROSS LAMINATED TIMBER MARKET, BY STRUCTURE TYPE, 2020-2032 ($MILLION)
    TABLE 138. LATIN AMERICA CROSS LAMINATED TIMBER MARKET, BY STRUCTURE TYPE, 2020-2032 (MILLION CUBIC FEET)
    TABLE 139. LATIN AMERICA CROSS LAMINATED TIMBER MARKET, BY APPLICATION, 2020-2032 ($MILLION)
    TABLE 140. LATIN AMERICA CROSS LAMINATED TIMBER MARKET, BY APPLICATION, 2020-2032 (MILLION CUBIC FEET)
    TABLE 141. MIDDLE EAST CROSS LAMINATED TIMBER MARKET, BY LAYER TYPE, 2020-2032 ($MILLION)
    TABLE 142. MIDDLE EAST CROSS LAMINATED TIMBER MARKET, BY LAYER TYPE, 2020-2032 (MILLION CUBIC FEET)
    TABLE 143. MIDDLE EAST CROSS LAMINATED TIMBER MARKET, BY STRUCTURE TYPE, 2020-2032 ($MILLION)
    TABLE 144. MIDDLE EAST CROSS LAMINATED TIMBER MARKET, BY STRUCTURE TYPE, 2020-2032 (MILLION CUBIC FEET)
    TABLE 145. MIDDLE EAST CROSS LAMINATED TIMBER MARKET, BY APPLICATION, 2020-2032 ($MILLION)
    TABLE 146. MIDDLE EAST CROSS LAMINATED TIMBER MARKET, BY APPLICATION, 2020-2032 (MILLION CUBIC FEET)
    TABLE 147. AFRICA CROSS LAMINATED TIMBER MARKET, BY LAYER TYPE, 2020-2032 ($MILLION)
    TABLE 148. AFRICA CROSS LAMINATED TIMBER MARKET, BY LAYER TYPE, 2020-2032 (MILLION CUBIC FEET)
    TABLE 149. AFRICA CROSS LAMINATED TIMBER MARKET, BY STRUCTURE TYPE, 2020-2032 ($MILLION)
    TABLE 150. AFRICA CROSS LAMINATED TIMBER MARKET, BY STRUCTURE TYPE, 2020-2032 (MILLION CUBIC FEET)
    TABLE 151. AFRICA CROSS LAMINATED TIMBER MARKET, BY APPLICATION, 2020-2032 ($MILLION)
    TABLE 152. AFRICA CROSS LAMINATED TIMBER MARKET, BY APPLICATION, 2020-2032 (MILLION CUBIC FEET)
    TABLE 153. KLH MASSIVHOLZ GMBH: KEY EXECUTIVES
    TABLE 154. KLH MASSIVHOLZ GMBH: COMPANY SNAPSHOT
    TABLE 155. KLH MASSIVHOLZ GMBH: PRODUCT SEGMENTS
    TABLE 156. KLH MASSIVHOLZ GMBH: PRODUCT PORTFOLIO
    TABLE 157. MAYR-MELNHOF HOLZ HOLDING AG: KEY EXECUTIVES
    TABLE 158. MAYR-MELNHOF HOLZ HOLDING AG: COMPANY SNAPSHOT
    TABLE 159. MAYR-MELNHOF HOLZ HOLDING AG: PRODUCT SEGMENTS
    TABLE 160. MAYR-MELNHOF HOLZ HOLDING AG: PRODUCT PORTFOLIO
    TABLE 161. MAYR-MELNHOF HOLZ HOLDING AG: KEY STRATERGIES
    TABLE 162. MERCER INTERNATIONAL INC.: KEY EXECUTIVES
    TABLE 163. MERCER INTERNATIONAL INC.: COMPANY SNAPSHOT
    TABLE 164. MERCER INTERNATIONAL INC.: PRODUCT SEGMENTS
    TABLE 165. MERCER INTERNATIONAL INC.: PRODUCT PORTFOLIO
    TABLE 166. MERCER INTERNATIONAL INC.: KEY STRATERGIES
    TABLE 167. HESS TIMBER GMBH: KEY EXECUTIVES
    TABLE 168. HESS TIMBER GMBH: COMPANY SNAPSHOT
    TABLE 169. HESS TIMBER GMBH: PRODUCT SEGMENTS
    TABLE 170. HESS TIMBER GMBH: PRODUCT PORTFOLIO
    TABLE 171. SCHILLIGER HOLZ AG: KEY EXECUTIVES
    TABLE 172. SCHILLIGER HOLZ AG: COMPANY SNAPSHOT
    TABLE 173. SCHILLIGER HOLZ AG: PRODUCT SEGMENTS
    TABLE 174. SCHILLIGER HOLZ AG: PRODUCT PORTFOLIO
    TABLE 175. SCHILLIGER HOLZ AG: KEY STRATERGIES
    TABLE 176. SIPEUROPE S.R.O.: KEY EXECUTIVES
    TABLE 177. SIPEUROPE S.R.O.: COMPANY SNAPSHOT
    TABLE 178. SIPEUROPE S.R.O.: PRODUCT SEGMENTS
    TABLE 179. SIPEUROPE S.R.O.: PRODUCT PORTFOLIO
    TABLE 180. SMARTLAM LLC: KEY EXECUTIVES
    TABLE 181. SMARTLAM LLC: COMPANY SNAPSHOT
    TABLE 182. SMARTLAM LLC: PRODUCT SEGMENTS
    TABLE 183. SMARTLAM LLC: PRODUCT PORTFOLIO
    TABLE 184. STORA ENSO OYJ: KEY EXECUTIVES
    TABLE 185. STORA ENSO OYJ: COMPANY SNAPSHOT
    TABLE 186. STORA ENSO OYJ: PRODUCT SEGMENTS
    TABLE 187. STORA ENSO OYJ: PRODUCT PORTFOLIO
    TABLE 188. STORA ENSO OYJ: KEY STRATERGIES
    TABLE 189. XLAM PTY LTD.: KEY EXECUTIVES
    TABLE 190. XLAM PTY LTD.: COMPANY SNAPSHOT
    TABLE 191. XLAM PTY LTD.: PRODUCT SEGMENTS
    TABLE 192. XLAM PTY LTD.: PRODUCT PORTFOLIO
    TABLE 193. BINDERHOLZ GMBH & CO. KG: KEY EXECUTIVES
    TABLE 194. BINDERHOLZ GMBH & CO. KG: COMPANY SNAPSHOT
    TABLE 195. BINDERHOLZ GMBH & CO. KG: PRODUCT SEGMENTS
    TABLE 196. BINDERHOLZ GMBH & CO. KG: PRODUCT PORTFOLIO
    TABLE 197. BINDERHOLZ GMBH & CO. KG: KEY STRATERGIES
  • LIST OF FIGURES

  • FIGURE 01. CROSS LAMINATED TIMBER MARKET, 2020-2032
    FIGURE 02. SEGMENTATION OF CROSS LAMINATED TIMBER MARKET, 2020-2032
    FIGURE 03. TOP INVESTMENT POCKETS IN CROSS LAMINATED TIMBER MARKET (2023-2032)
    FIGURE 04. LOW BARGAINING POWER OF SUPPLIERS
    FIGURE 05. LOW THREAT OF NEW ENTRANTS
    FIGURE 06. LOW THREAT OF SUBSTITUTES
    FIGURE 07. LOW INTENSITY OF RIVALRY
    FIGURE 08. LOW BARGAINING POWER OF BUYERS
    FIGURE 09. DRIVERS, RESTRAINTS AND OPPORTUNITIES: GLOBALCROSS LAMINATED TIMBER MARKET
    FIGURE 09. CROSS LAMINATED TIMBER MARKET, BY LAYER TYPE, 2020(%)
    FIGURE 10. COMPARATIVE SHARE ANALYSIS OF CROSS LAMINATED TIMBER MARKET FOR 3-PLY, BY COUNTRY 2020 AND 2032(%)
    FIGURE 11. COMPARATIVE SHARE ANALYSIS OF CROSS LAMINATED TIMBER MARKET FOR 5-PLY, BY COUNTRY 2020 AND 2032(%)
    FIGURE 12. COMPARATIVE SHARE ANALYSIS OF CROSS LAMINATED TIMBER MARKET FOR OTHER, BY COUNTRY 2020 AND 2032(%)
    FIGURE 13. CROSS LAMINATED TIMBER MARKET, BY STRUCTURE TYPE, 2020(%)
    FIGURE 14. COMPARATIVE SHARE ANALYSIS OF CROSS LAMINATED TIMBER MARKET FOR WALL, BY COUNTRY 2020 AND 2032(%)
    FIGURE 15. COMPARATIVE SHARE ANALYSIS OF CROSS LAMINATED TIMBER MARKET FOR ROOF AND FLOOR, BY COUNTRY 2020 AND 2032(%)
    FIGURE 16. COMPARATIVE SHARE ANALYSIS OF CROSS LAMINATED TIMBER MARKET FOR OTHER, BY COUNTRY 2020 AND 2032(%)
    FIGURE 17. CROSS LAMINATED TIMBER MARKET, BY APPLICATION, 2020(%)
    FIGURE 18. COMPARATIVE SHARE ANALYSIS OF CROSS LAMINATED TIMBER MARKET FOR RESIDENTIAL, BY COUNTRY 2020 AND 2032(%)
    FIGURE 19. COMPARATIVE SHARE ANALYSIS OF CROSS LAMINATED TIMBER MARKET FOR NON-RESIDENTIAL, BY COUNTRY 2020 AND 2032(%)
    FIGURE 20. CROSS LAMINATED TIMBER MARKET BY REGION, 2020
    FIGURE 21. U.S. CROSS LAMINATED TIMBER MARKET, 2020-2032 ($MILLION)
    FIGURE 22. CANADA CROSS LAMINATED TIMBER MARKET, 2020-2032 ($MILLION)
    FIGURE 23. MEXICO CROSS LAMINATED TIMBER MARKET, 2020-2032 ($MILLION)
    FIGURE 24. GERMANY CROSS LAMINATED TIMBER MARKET, 2020-2032 ($MILLION)
    FIGURE 25. FRANCE CROSS LAMINATED TIMBER MARKET, 2020-2032 ($MILLION)
    FIGURE 26. UK CROSS LAMINATED TIMBER MARKET, 2020-2032 ($MILLION)
    FIGURE 27. ITALY CROSS LAMINATED TIMBER MARKET, 2020-2032 ($MILLION)
    FIGURE 28. REST OF EUROPE CROSS LAMINATED TIMBER MARKET, 2020-2032 ($MILLION)
    FIGURE 29. CHINA CROSS LAMINATED TIMBER MARKET, 2020-2032 ($MILLION)
    FIGURE 30. JAPAN CROSS LAMINATED TIMBER MARKET, 2020-2032 ($MILLION)
    FIGURE 31. INDIA CROSS LAMINATED TIMBER MARKET, 2020-2032 ($MILLION)
    FIGURE 32. SOUTH KOREA CROSS LAMINATED TIMBER MARKET, 2020-2032 ($MILLION)
    FIGURE 33. REST OF ASIA-PACIFIC CROSS LAMINATED TIMBER MARKET, 2020-2032 ($MILLION)
    FIGURE 34. LATIN AMERICA CROSS LAMINATED TIMBER MARKET, 2020-2032 ($MILLION)
    FIGURE 35. MIDDLE EAST CROSS LAMINATED TIMBER MARKET, 2020-2032 ($MILLION)
    FIGURE 36. AFRICA CROSS LAMINATED TIMBER MARKET, 2020-2032 ($MILLION)
    FIGURE 37. TOP WINNING STRATEGIES, BY YEAR
    FIGURE 38. TOP WINNING STRATEGIES, BY DEVELOPMENT
    FIGURE 39. TOP WINNING STRATEGIES, BY COMPANY
    FIGURE 40. PRODUCT MAPPING OF TOP 10 PLAYERS
    FIGURE 41. COMPETITIVE DASHBOARD
    FIGURE 42. COMPETITIVE HEATMAP: CROSS LAMINATED TIMBER MARKET
    FIGURE 43. TOP PLAYER POSITIONING, 2020
    FIGURE 44. MERCER INTERNATIONAL INC.: NET REVENUE, 2020-2022 ($MILLION)
    FIGURE 45. MERCER INTERNATIONAL INC.: REVENUE SHARE BY SEGMENT, 2022 (%)
    FIGURE 46. MERCER INTERNATIONAL INC.: REVENUE SHARE BY REGION, 2022 (%)
    FIGURE 47. STORA ENSO OYJ: NET SALES, 2020-2022 ($MILLION)
    FIGURE 48. STORA ENSO OYJ: REVENUE SHARE BY SEGMENT, 2022 (%)
    FIGURE 49. STORA ENSO OYJ: REVENUE SHARE BY REGION, 2022 (%)


PURCHASE OPTIONS

Call or Email us

U.S.-Canada Toll-free: +1-800-792-5285
Int'l : +1-503-894-6022
Europe : +44-845-528-1300
Email : help@alliedmarketresearch.com
 
FREQUENTLY ASKED QUESTIONS?

A. Key factors driving the growth of the cross laminated timber market include the growth of the building construction industry, rise in demand for sustainable construction materials, and various advantages of cross-laminated timber.

A. The latest version of the global cross laminated timber market report can be obtained on demand from the website.

A. The global tire recycling market size was valued at $$1,575.50 million in 2020.

A. The global cross laminated timber market size is estimated to reach $3,735.90 million by 2032, exhibiting a CAGR of 8.4% from 2023 to 2032.

A. A- The forecast period considered for the global cross laminated timber market is 2023 to 2032, wherein, 2022 is the base year, 2023 is the estimated year, and 2032 is the forecast year. In addition, historical period from 2020-2021 is also analysed.

A. Europe is largest regional market for cross laminated timber market.

A. Key companies profiled in the tire recycling market report include Mayr-Melnhof Holz Holding AG, Mercer International Inc., SmartLam LLC, Stora Enso Oyj, KLH Massivholz GmbH, XLam Pty Ltd., SIPEUROPE s.r.o., Schilliger Holz AG, HESS TIMBER GmbH, and Binderholz GmbH & Co. KG.

A. The report contains an exclusive company profile section, where leading companies in the market are profiled. These profiles typically cover company overview, geographical presence, market dominance (in terms of revenue and volume sales), various strategies, and recent developments.

Looking for Customization?

 Customization Request

Have a Question?

 Speak with Analyst

Any Confusion?

 Inquire Before Buying

Have a glance of the Report

  Request Sample
RELATED TAGS

Purchase Full Report of
Cross Laminated Timber Market

Start reading instantly.
This Report and over 67,071+ more Reports, Available with Avenue Library. T&C*.

  • Online Only
  • $3,570
  • Online cloud access only
  • Restricted print, copy, paste & download
  • Read only
  • Free industry update
    (Within 180 days)
  • Free report update in next update cycle
    (Jul 2024 - Jul 2025)
  • Data Pack
  • $3,840
  • Restricted to one authorized user
  • One print only
  • Available in
    Excel
  • Free industry update
    (Within 180 days)
  •   Free report update in next update cycle
    (Jul 2024 - Jul 2025)
  • Single User
  • $5,730
  • Restricted to one authorized user
  • One print only
  • Available in
    PDF
  • Free industry update
    (Within 180 days)
  •   Free report update in next update cycle
    (Jul 2024 - Jul 2025)
  • Five Users
  • $6,450
  • Limited to five authorized users
  • Print upto five copies
  • Available in
    PDF
  • Free industry update
    (Within 180 days)
  •   Free report update in next update cycle
    (Jul 2024 - Jul 2025)
  • Enterprise
    License/PDF

  • $9,600
  • Unlimited
    within
    company/enterprise
  • Available in Excel & PDF
  • Free industry update
    (Within 180 days)
  •   Free report update in next update cycle
    (Jul 2024 - Jul 2025)
  • Library
    Membership

  • $999 $ 1,175
    Per User/ Per month/ Billed annually
  • Published Content
    E-access
  • Company Profiles
    E-access
  • Newly Added Content Access
  • 10 PDF
    Downloads
  • 5 Excel Data
    Pack Downloads
  • 250 Company Profiles PDF Downloads
  • Buy Now

*Taxes/Fees, if applicable will be added during checkout. All prices in USD

RELATED REPORTS
 

Why Allied Market Research?


Infallible Methodology

To ensure high-level data integrity, accurate analysis, and impeccable forecasts

Analyst Support

For complete satisfaction

Customization

On-demand customization of scope of the report to exactly meet your needs

TARGETED MARKET VIEW

Targeted market view to provide pertinent information and save time of readers

Get fresh content delivered

Get insights on topics that are crucial for your business. Stay abreast of your interest areas.

Get Industry Data Alerts

Why Allied Market Research?

Infallible Methodology

To ensure high-level data integrity, accurate analysis, and impeccable forecasts

Analyst Support

For complete satisfaction

Customization

On-demand customization of scope of the report to exactly meet your needs

TARGETED MARKET VIEW

Targeted market view to provide pertinent information and save time of readers