
Crossbows Market Research, 2033
Market Introduction and Definition
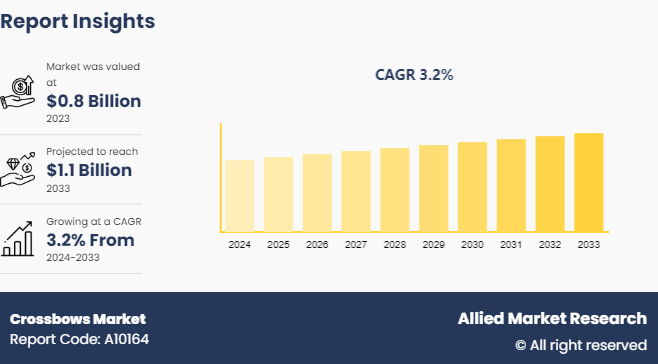
The global crossbows market size was valued at $0.8 billion in 2023, and is projected to reach $1.1 billion by 2033, growing at a CAGR of 3.2% from 2024 to 2033. Crossbows are a ranged weapon for hunting, target shooting, and leisure activities. These tools are bows with stocks that launch projectiles, usually bolts or arrows. Crossbows that cater to both recreational and professional users are widely available in the market, including recurve, compound, and pistol crossbows. Sports shooters, hunters, and archery contests are the main sources of demand, especially in North America and Europe. Furthermore, advancements in design and materials and a rise in interest in leisure activities support the crossbows market growth. Safety concerns and regulatory actions also affect product offerings and market dynamics.
Key Takeaways
The crossbows market study covers 20 countries. The research includes a segment analysis of each country in terms of value for the projected period.
More than 1, 500 product literature, industry releases, annual reports, and other such documents of major crossbows industry participants along with authentic industry journals, trade associations' releases, and government websites have been reviewed for generating high-value industry insights.
The study integrated high-quality data, professional opinions and analysis, and critical independent perspectives. The research approach is intended to provide a balanced view of global markets and to assist stakeholders in making educated decisions in order to achieve their most ambitious growth objectives.
Key market dynamics
The growing popularity of shooting sports for enjoyment and hunting is one of the primary growth factors. Rising demand is a result of crossbow hunting's increased recognition as a difficult and interesting outdoor activity among people looking for new and unique outdoor experiences. Thus, in North America and Europe, where sport hunting is common, this trend has particular significance.
In addition, the changing laws about?hunting and the use of crossbows is another significant growth?factor. Crossbow adoption is expanding because of the relaxation of laws governing them in several nations. An additional opportunity for crossbow-hunting?enthusiasts to participate in the sport has been created by the expansion of crossbow-hunting?seasons in some U.S. states and some European nations.
Furthermore, the development of crossbow technology has also been a major factor in the market's expansion. Nowadays, ?crossbows are lighter, more accurate, and simpler to use due to advancements in engineering, materials, and sighting systems. These developments have expanded the market growth, attracting?both beginner and experienced hunters in search of higher-tech equipment. Another significant factor is the rising popularity of archery as a competitive sport, which has been aided in part by media attention. More people are attending competitive archery events, especially those employing crossbows, and this is encouraging increased grassroots participation.
However, there are several barriers to market expansion. One such barrier is the comparatively expensive cost of crossbows, which may discourage potential customers, particularly in nations with lower incomes. In addition, regions with more stringent regulations?have challenges due to concerns about protecting wildlife and the morality of hunting. As a result, despite some challenges with cost and ethics, the crossbow market?is projected to grow further due to rising consumer interest in hunting and outdoor activities, additional developments, and relaxed regulations.
Parent Market Overview of the Global Crossbows Market
The global crossbows market falls under the broader archery equipment market, which includes bows, arrows, and related accessories. The global archery equipment market was valued at $2.5 billion in 2023, and the crossbows market is valued at 0.8 billion in 2023. Growing interest in leisure activities, the usage of archery equipment in competitive sports and hunting, and the growing popularity of archery as a sport are the main factors driving this parent market. The expansion of this market?is further aided by the increase in outdoor sports participation and marketing campaigns for archery by associations. Crossbow efficiency and accuracy are increasing due to technological innovations including improved materials and creative designs, which are driving the crossbows market demand. Crossbows are also used by the military and law enforcement for specialized tasks, which expands the market. The cultural relevance of archery and the increasing understanding of the regulations of?bowhunting are also important factors.
Parent Market Analysis, 2023
Market Name | Market Size ($ Billion) |
Archery Equipment Market | 2.5 |
Crossbows Market | 0.8 |
Market Segmentation
The crossbows market is segmented into type, application, and region. On the basis of type, the market is divided into compound crossbows, recurve crossbows, and others. On the basis of application, the market is classified into hunting and outdoor, shooting sports, army, and others. Region-wise, the market is analyzed across North America, Europe, Asia-Pacific, and LAMEA.
Regional/Country Market Outlook
The growing popularity of archery sports, hunting, and the use of crossbows by the military and law enforcement has resulted in a major surge in demand for crossbows globally. The market is dominated by North America, particularly in the U.S.?and Canada, where crossbows are extensively utilized for hunting and other leisure activities. The U.S.?market has grown rapidly since crossbow hunting was made legal in several?states. The efficiency and design of crossbows made in North America are also frequently enhanced by their manufacturers, which has helped this sector grow.
Another significant market for crossbows is Europe, where interest in archery activities is growing in nations including the UK, Germany, and France. The demand is being driven by increased consumer interest in outdoor activities, and European archery organizations and clubs are encouraging crossbow use for competitive events. In addition, some enthusiasts now favor crossbows as an alternative to firearms due to strict regulations that prohibit their usage in several European nations.
There is also growing demand for crossbows in the Asia-Pacific region, especially in competitive and recreational archery, in nations such as China, Japan, and South Korea. Crossbows are becoming more?manufactured in China, where a growing number of regional companies are joining the market and providing products at competitive costs. Crossbow demand is being driven by people's increased interest in leisure activities such as archery, which is encouraged by the growing middle class and rising disposable income.
The crossbow market is growing in Latin America and the Middle East and Africa (MEA) regions. Future demand is probably going to be driven by the growing popularity of hunting and outdoor sports, even though these regions are still emerging. Key nations in these regions, where the crossbow market is anticipated to expand gradually over the next several years, include Brazil, South Africa, and the United Arab Emirates.
Industry Trends:
- TenPoint Crossbow Technologies introduced a new line of lightweight, fast crossbows in July 2023, aimed mostly at hunters and sports enthusiasts. With its innovative security features and lightweight construction, the product meets the increasing need for improved outdoor sports performance.
- Excalibur Crossbow mentioned in March 2023 that it would strategically partner with neighborhood merchants to expand its distribution network, with an emphasis on increasing market penetration in suburban and rural areas.
- PSE Archery and a Chinese manufacturer formed a joint venture in April 2023 to develop crossbows at a lower cost for local customers, in response to the growing demand for reasonably priced hunting equipment.
- Major crossbow manufacturer Hoyt Archery increased its footprint in South Korea and Japan in August 2023 by collaborating with local distributors to capitalize on the rising popularity of archery sports.
- Taiwan-based EK Archery Research added new lightweight versions to its portfolio in January 2023, aiming to appeal to younger consumers who enjoy competitive archery and outdoor sports.
Competitive Landscape
The major players operating in the market for increasing their crossbows market share include Barnett Jackal, Arrow Precision, CenterPoint, Excalibur, TenPoint, Ravin, PSE Archery, Parker, Wicked Ridge, and Horton. Other players in the crossbows market includes Armex Archery, Mathews, Man Kung, and SanlidaCarbon Express.
Recent Key Strategies and Developments
- In May 2023, a significant leader in the crossbow industry, Barnett Outdoors LLC, increased its production capacity by purchasing a new facility in Indiana to satisfy rising domestic demand.
- In June 2023, leading Chinese crossbow manufacturer SinoArchery Co., Ltd. established a new alliance with a global outdoor sporting goods retailer to?increase the size of its export market, with a particular emphasis on Southeast Asia and Europe.
Key Benefits For Stakeholders
- This report provides a quantitative analysis of the market segments, current trends, estimations, and dynamics of the crossbows market analysis from 2024 to 2033 to identify the prevailing crossbows market opportunities.
- The market research is offered along with information related to key drivers, restraints, and opportunities.
- Porter's five forces analysis highlights the potency of buyers and suppliers to enable stakeholders make profit-oriented business decisions and strengthen their supplier-buyer network.
- In-depth analysis of the market segmentation assists to determine the prevailing market opportunities during the crossbows market forecast period.
- Major countries in each region are mapped according to their revenue contribution to the global market.
- Market player positioning facilitates benchmarking and provides a clear understanding of the present position of the market players.
- The report includes the analysis of the regional as well as global crossbows market trends, key players, market segments, application areas, and market growth strategies.
Crossbows Market Report Highlights
| Aspects | Details |
| Market Size By 2033 | USD 1.1 Billion |
| Growth Rate | CAGR of 3.2% |
| Forecast period | 2024 - 2033 |
| Report Pages | 230 |
| By Type |
|
| By Application |
|
| By Region |
|
| Key Market Players | Parker, PSE Archery, Horton, Excalibur, TenPoint, Arrow Precision, Barnett Jackal, CenterPoint, Ravin, Wicked Ridge |
The global crossbows market was valued at $0.8 billion in 2023 and is estimated to reach $1.1 billion by 2033, exhibiting a CAGR of 3.1% from 2024 to 2033
The crossbows market registered a CAGR of 3.1% from 2024 to 2033.
The forecast period in the crossbows market report is from 2024 to 2033.
The top companies that hold the market share in the crossbows market include Barnett Jackal, Arrow Precision, CenterPoint, Excalibur, TenPoint, Ravin, PSE Archery, and others.
The crossbows market report has 2 segments. The segments are type and application,
Loading Table Of Content...

