0
2021
Cuttings Re-injection Services Market

Cuttings re-injection services Market

by Type (Dedicated Injection, and Annular Injection), and Application (On-Shore and Off-Shore): Global Opportunity Analysis and Industry Forecast, 2021-2030

Report Code: A13316
Sep 2021 | Pages: 141
Tables: 82
Charts: 47
  • Formats*:

  • pdf

    Single User License, Five User
    License & Enterprise User License

  • xls

    Data Pack Excel License

  • ppt

    It comes with the additional cost
    of $2500.00 contact sales.


COVID-19

Pandemic disrupted the entire world and affected many industries.

Get detailed COVID-19 impact analysis on the Cuttings Re-injection Services Market

Request Now !

Cuttings re-injection services Market Forecast-2030

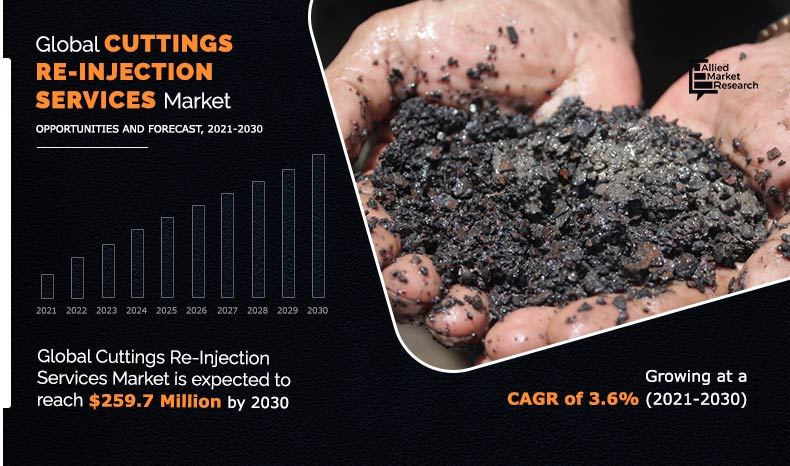
The cuttings re-injection services market size was valued at $180.6 million in 2020, and is projected to reach $259.7 million by 2030, growing at a CAGR of 3.6% from 2021 to 2030. Drilling activity is one of the major parts of the oil & gas industry. The aim of the drilling project is to prove the possible reservoir. The drilling wastes that are being generated during drill activities are drill cuttings, drilling fluid- whole spent, completion fluid and hole cleaning fluid, and excess cement. Cuttings re-injection handles huge amount of cuttings that keep up with the fastest rates of drilling.

The COVID-19 outbreak decreased the demand for oil & gas from numerous countries. This halted the drilling activities which consequently decreased the demand for oilfield services such as cuttings re-injection services.

The factors contributing toward the cuttings re-injection services market growth include increased environmental concerns, and rise in drill waste management regulations. Oil & gas drilling has a significant effect on communities and wildlands. Drilling operations disrupt wildlife, causes pollution, boost climate change, and others. Infrastructure constructed for oil & gas removal can leave behind dangerous effects on wildlands. The release of drill cuttings and produced water from offshore oil & gas platforms are an uninterrupted origin of pollutants entering the sea. In, addition, there are increased levels of trace metals in sediments close to the installations. This is because of discharges of drill cuttings from oil & gas platforms. Furthermore, the release of oil-laden drill cuttings is a major challenge for well engineers. This consequently increases the demand for cutting re-injections types of process. However, availability of alternative drill cuttings management process is expected to hamper the cutting re-injection services market growth during the forecast period. There are numerous alternative processes for drill waste management. Some of them include incineration, solidification, landfarming, and biodegradation. 

Cuttings-Re-Injection-Services-Market-2021-2030

The cutting re-injection services market is segmented on the basis of type, application, and region. By type, the market is segregated into dedicated injection and annular injection. On the basis of application, the market is bifurcated into on-shore and off-shore. Region-wise, the cutting re-injection services market is analyzed across North America, Europe, Asia-Pacific, and LAMEA. The cutting re-injection services market share is analyzed for all segments and countries.

The cuttings re-injection services market analysis covers in-depth information of the major industry participants. Some of the major players in the cuttings re-injection services industry include Baker Hughes Company, NOV Inc., Advantek, Augean PLC, GN Solid Control, Haliburton, Schlumberger, PPLI, Weatherford, and Terralog Technologies

Other players in the cutting re-injection services market are Aker Solutions, Archer Limited, KCA Deutag, Odfjell Drilling, Drill Cuttings Disposal Company/ Apollo Resources, Step Oiltools, Derrick Corporation, Calder Limited, Scomi, and others.

Cuttings Re-injection Services Market, by Type

By type, the annular injection segment garnered highest market share in 2020 in terms of revenue. It has garnered 83.4% in 2020, in terms of revenue and expected to grow at CAGR of 3.3. Short-term annular injection operations are less complex. In addition, it would cost less than dedicated injection.

Cuttings re-injection services Market
By Type

Your browser does not support the canvas element.

Annular Injection is projected as the most lucrative segment.

Get more information on this report : Request Sample Pages

Cuttings Re-injection Services Market, by Application

By application, the onshore segment garnered market share of 18.9% in 2020, in terms of revenue. Offshore disposal is restricted by the rules and regulations but onshore disposal can give additional liability at the disposal location. In onshore drilling, equipment can be effortlessly moved from place to place with the aid of skids and other resources that make drilling sites mobile and flexible.

Cuttings re-injection services Market
By Application

Your browser does not support the canvas element.

On-shore is projected as the most lucrative segment.

Get more information on this report : Request Sample Pages

Cuttings Re-injection Services Market, by Region

Region-wise, Asia-Pacific is expected to grow at a CAGR of 4.8%, in terms of revenue. South China Sea offers opportunities for oil & gas companies. But the South China Sea has growth challenges, most particularly in the form of boundary controversies between Philippines, Vietnam, and China. Geopolitics is one of the major factors indirectly affecting the cuttings re-injection services market growth. 

Cuttings re-injection services Market
By Region

2030
Asia-pacific 
North America
Europe
LAMEA

Asia-Pacific holds a dominant position in 2020 and would continue to maintain the lead over the forecast period.

Get more information on this report : Request Sample Pages

Key benefits for stakeholders

  • The report outlines the current trends and future scenario of the market from 2021 to 2030 to understand the prevailing opportunities and potential investment pockets.
  • The cutting re-injection services market size is provided in terms of revenue.
  • The report provides an in-depth analysis of the market along with the current and future cuttings re-injection services market trends.
  • This report highlights the key drivers, opportunities, and restraints of the market along with impact analysis during the forecast period.
  • The report also covers the impact of governmental regulations on the cutting re-injection services market.
  • Porter’s five forces analysis helps analyze the potential of buyers & suppliers and the competitive scenario of the industry for strategy building.
  • The study provides a comprehensive analysis of the factors that drive and restrain the cutting re-injection services market growth.

Impact of COVID-19 on the cuttings re-injection services market

  • The COVID-19 outbreak decreased the demand for oil & gas from numerous countries. This halted the drilling activities.
  • The final investment decision also got impacted from some of the projects.
  • The spread of COVID-19 in numerous countries has led to demand uncertainty for oil & gas. This uncertainty has negatively impacted the oil & gas sector activity.  
  • The industrial players need to speed up their digitalization and automation initiatives to attain new heights of operational productivity to recover from the negative impact of COVID-19.
  • The world is moving toward clean energy and is expected to decrease oil demand in future, which may have a negative impact not only on oil companies but also on oil & gas services companies.
  • The cutting re-injection services market is expected to witness growth with increase in demand for oil & gas is increasing (but not equivalent to pre-pandemic levels) owing to increasing industrial activities. The industrial activities are gaining pace in the numerous countries because of increased vaccination.  

Key Market Segments

By Type

  • Dedicated Injection
  • Annular Injection

By Application

  • On-Shore
  • Off-Shore

By Region

  • North America 
    • U.S. 
    • Canada 
  • Europe 
    • UK
    • Russia
    • Norway
    • Rest of Europe
  • Asia-Pacific 
    • China
    • Malaysia
    • Australia
    • Rest of Asia-Pacific
  • LAMEA
    • Latin America
    • Middle East
    • Africa

Cuttings re-injection services Market Report Highlights

Aspects Details
By TYPE
  • Dedicated Injection
  • Annular injection
By APPLICATION
  • On-Shore
  • Off-shore
By Region
  • North America  (U.S., Canada, Mexico)
  • Europe  (France, Germany, Italy, Spain, UK, Russia, Rest of Europe)
  • Asia-Pacific  (China, Japan, India, South Korea, Australia, Thailand, Malaysia, Indonesia, Rest of Asia-Pacific)
  • LAMEA  (Brazil, South Africa, Saudi Arabia, UAE, Argentina, Rest of LAMEA)
Key Market Players NOV INC, TERRALOG TECHNOLOGIES INC., BAKER HUGHES COMPANY, PRASADHA PAMUNAH LIMBAH INDUSTRY, GN SOLIDS CONTROL, SCHLUMBERGER, HALLIBURTON, WEATHERFORD, AUGEAN PLC, ADVANTEK
 

CHAPTER 1:INTRODUCTION

1.1.Report description
1.2.Key benefits for stakeholders
1.3.Key market segments
1.4.Research methodology

1.4.1.Primary research
1.4.2.Secondary research
1.4.3.Analyst tools and models

CHAPTER 2:EXECUTIVE SUMMARY

2.1.Key findings of the study
2.2.Key findings

2.2.1.Top investment pockets

2.3.CXO perspective

CHAPTER 3:MARKET OVERVIEW

3.1.Market definition and scope
3.2.Porter's five forces analysis
3.3.Top Player Positioning 2020
3.4.Market dynamics

3.4.1.Drivers

3.4.1.1.Increased environmental concerns
3.4.1.2.Rise in drilling waste management regulations

3.4.2.Restraint

3.4.2.1.Availability of alternative drill waste management process

3.4.3.Opportunity

3.4.3.1.South China Sea offers opportunities for oil & gas companies

3.5.Impact of COVID-19 outbreak on the cuttings re-injection services market

CHAPTER 4:CUTTINGS RE-INJECTION SERVICES MARKET, BY TYPE

4.1.Overview

4.1.1.Market size and forecast

4.2.Dedicated Injection

4.2.1.Key market trends, growth factors, and opportunities
4.2.2.Market size and forecast, by region
4.2.3.Market analysis, by country

4.3.Annular injection

4.3.1.Key market trends, growth factors, and opportunities
4.3.2.Market size and forecast, by region
4.3.3.Market analysis, by country

CHAPTER 5:CUTTINGS RE-INJECTION SERVICES MARKET, BY APPLICATION

5.1.Overview

5.1.1.Market size and forecast

5.2.On-Shore

5.2.1.Key market trends, growth factors, and opportunities
5.2.2.Market size and forecast, by region
5.2.3.Market analysis, by country

5.3.Off-shore

5.3.1.Key market trends, growth factors, and opportunities
5.3.2.Market size and forecast, by region
5.3.3.Market analysis, by country

CHAPTER 6:CUTTINGS RE-INJECTION SERVICES MARKET, BY REGION

6.1.Overview

6.1.1.Market size and forecast

6.2.North America

6.2.1.Key market trends, growth factors, and opportunities
6.2.2.Market size and forecast, by type
6.2.3.Market size and forecast, by application
6.2.4.Market size and forecast, by country

6.2.4.1.U.S.

6.2.4.1.1.Market size and forecast, by type
6.2.4.1.2.Market size and forecast, by application

6.2.4.2.Canada

6.2.4.2.1.Market size and forecast, by type
6.2.4.2.2.Market size and forecast, by application

6.3.Europe

6.3.1.Key market trends, growth factors, and opportunities
6.3.2.Market size and forecast, by type
6.3.3.Market size and forecast, by application
6.3.4.Market size and forecast, by country

6.3.4.1.UK

6.3.4.1.1.Market size and forecast, by type
6.3.4.1.2.Market size and forecast, by application

6.3.4.2.Russia

6.3.4.2.1.Market size and forecast, by type
6.3.4.2.2.Market size and forecast, by application

6.3.4.3.Norway

6.3.4.3.1.Market size and forecast, by type
6.3.4.3.2.Market size and forecast, by application

6.3.4.4.Rest of Europe

6.3.4.4.1.Market size and forecast, by type
6.3.4.4.2.Market size and forecast, by application

6.4.Asia-Pacific

6.4.1.Key market trends, growth factors, and opportunities
6.4.2.Market size and forecast, by type
6.4.3.Market size and forecast, by application
6.4.4.Market size and forecast, by country

6.4.4.1.China

6.4.4.1.1.Market size and forecast, by type
6.4.4.1.2.Market size and forecast, by application

6.4.4.2.Malaysia

6.4.4.2.1.Market size and forecast, by type
6.4.4.2.2.Market size and forecast, by application

6.4.4.3.Australia

6.4.4.3.1.Market size and forecast, by type
6.4.4.3.2.Market size and forecast, by application

6.4.4.4.Rest of Asia-Pacific

6.4.4.4.1.Market size and forecast, by type
6.4.4.4.2.Market size and forecast, by application

6.5.LAMEA

6.5.1.Key market trends, growth factors, and opportunities
6.5.2.Market size and forecast, by type
6.5.3.Market size and forecast, by application
6.5.4.Market size and forecast, by country

6.5.4.1.Latin America

6.5.4.1.1.Market size and forecast, by type
6.5.4.1.2.Market size and forecast, by application

6.5.4.2.Middle East

6.5.4.2.1.Market size and forecast, by type
6.5.4.2.2.Market size and forecast, by application

6.5.4.3.Africa

6.5.4.3.1.Market size and forecast, by type
6.5.4.3.2.Market size and forecast, by application

CHAPTER 7:COMPANY PROFILES

7.1.BAKER HUGHES COMPANY

7.1.1.Company overview
7.1.2.Key executive
7.1.3.Company snapshot
7.1.4.Operating business segments
7.1.5.Product portfolio
7.1.6.Business performance

7.2.NOV INC

7.2.1.Company overview
7.2.2.Key executive
7.2.3.Company snapshot
7.2.4.Operating business segments
7.2.5.Product portfolio
7.2.6.Business performance

7.3.ADVANTEK

7.3.1.Company overview
7.3.2.Key executive
7.3.3.Company snapshot
7.3.4.Product portfolio

7.4.AUGEAN PLC

7.4.1.Company overview
7.4.2.Key executive
7.4.3.Company snapshot
7.4.4.Operating business segments
7.4.5.Product portfolio
7.4.6.Business performance

7.5.GN SOLIDS CONTROL

7.5.1.Company overview
7.5.2.Key executive
7.5.3.Company snapshot
7.5.4.Product portfolio

7.6.HALLIBURTON

7.6.1.Company overview
7.6.2.Company snapshot
7.6.3.Operating business segments
7.6.4.Product portfolio
7.6.5.Business performance

7.7.SCHLUMBERGER

7.7.1.Company overview
7.7.2.Company snapshot
7.7.3.Operating business segments
7.7.4.Product portfolio
7.7.5.Business performance

7.8.PRASADHA PAMUNAH LIMBAH INDUSTRY

7.8.1.Company overview
7.8.2.Company snapshot
7.8.3.Product portfolio

7.9.WEATHERFORD

7.9.1.Company overview
7.9.2.Company snapshot
7.9.3.Operating business segments
7.9.4.Product portfolio
7.9.5.Business performance

7.10.TERRALOG TECHNOLOGIES INC.

7.10.1.Company overview
7.10.2.Company snapshot
7.10.3.Product portfolio

LIST OF TABLES

TABLE 01.CUTTINGS RE-INJECTION SERVICES MARKET, BY TYPE, 2020-2030 ($MILLION)
TABLE 02.CUTTINGS RE-INJECTION SERVICES MARKET, FOR DEDCIATED INJECTION, BY REGION, 2020-2030 ($MILLION)
TABLE 03.CUTTINGS RE-INJECTION SERVICES MARKET, FOR ANNULAR INJECTION, BY REGION, 2020-2030 ($MILLION)
TABLE 04.CUTTINGS RE-INJECTION SERVICES MARKET, BY APPLICATION, 2020-2030 ($MILLION)
TABLE 05.CUTTINGS RE-INJECTION SERVICES MARKET, FOR ON-SHOR E, BY REGION, 2020-2030 ($MILLION)
TABLE 06.CUTTINGS RE-INJECTION SERVICES MARKET, FOR OFF-SHORE, BY REGION, 2020-2030 ($MILLION)
TABLE 07.CUTTINGS RE-INJECTION SERVICES MARKET, BY REGION, 2020-2030 ($MILLION)
TABLE 08.NORTH AMERICA CUTTINGS RE-INJECTION SERVICES MARKET, BY TYPE, 2020-2030 ($MILLION)
TABLE 09.NORTH AMERICA CUTTINGS RE-INJECTION SERVICES MARKET, BY APPLICATION, 2020-2030 ($MILLION)
TABLE 10.NORTH AMERICA CUTTINGS RE-INJECTION SERVICES MARKET, BY COUNTRY, 2020-2030 ($MILLION)
TABLE 11.U.S. CUTTINGS RE-INJECTION SERVICES MARKET, BY TYPE, 2020-2030 ($MILLION)
TABLE 12.U.S. CUTTINGS RE-INJECTION SERVICES MARKET, BY APPLICATION, 2020-2030 ($MILLION)
TABLE 13.CANADA CUTTINGS RE-INJECTION SERVICES MARKET, BY TYPE, 2020-2030 ($MILLION)
TABLE 14.CANADA CUTTINGS RE-INJECTION SERVICES MARKET, BY APPLICATION, 2020-2030 ($MILLION)
TABLE 15.EUROPE CUTTINGS RE-INJECTION SERVICES MARKET, BY TYPE, 2020-2030 ($MILLION)
TABLE 16.EUROPE CUTTINGS RE-INJECTION SERVICES MARKET, BY APPLICATION, 2020-2030 ($MILLION)
TABLE 17.EUROPE CUTTINGS RE-INJECTION SERVICES MARKET, BY COUNTRY, 2020-2030 ($MILLION)
TABLE 18.UK CUTTINGS RE-INJECTION SERVICES MARKET, BY TYPE, 2020-2030 ($MILLION)
TABLE 19.UK CUTTINGS RE-INJECTION SERVICES MARKET, BY APPLICATION, 2020-2030 ($MILLION)
TABLE 20.RUSSIA CUTTINGS RE-INJECTION SERVICES MARKET, BY TYPE, 2020-2030 ($MILLION)
TABLE 21.RUSSIA CUTTINGS RE-INJECTION SERVICES MARKET, BY APPLICATION, 2020-2030 ($MILLION)
TABLE 22.NORWAY CUTTINGS RE-INJECTION SERVICES MARKET, BY TYPE, 2020-2030 ($MILLION)
TABLE 23.NORWAY CUTTINGS RE-INJECTION SERVICES MARKET, BY APPLICATION, 2020-2030 ($MILLION)
TABLE 24.REST OF EUROPE CUTTINGS RE-INJECTION SERVICES MARKET, BY TYPE, 2020-2030 ($MILLION)
TABLE 25.REST OF EUROPE CUTTINGS RE-INJECTION SERVICES MARKET, BY APPLICATION, 2020-2030 ($MILLION)
TABLE 26.ASIA-PACIFIC CUTTINGS RE-INJECTION SERVICES MARKET, BY TYPE, 2020-2030 ($MILLION)
TABLE 27.ASIA-PACIFIC CUTTINGS RE-INJECTION SERVICES MARKET, BY APPLICATION, 2020-2030 ($MILLION)
TABLE 28.ASIA-PACIFIC CUTTINGS RE-INJECTION SERVICES MARKET, BY COUNTRY, 2020-2030 ($MILLION)
TABLE 29.CHINA CUTTINGS RE-INJECTION SERVICES MARKET, BY TYPE, 2020-2030 ($MILLION)
TABLE 30.CHINA CUTTINGS RE-INJECTION SERVICES MARKET, BY APPLICATION, 2020-2030 ($MILLION)
TABLE 31.MALAYSIA CUTTINGS RE-INJECTION SERVICES MARKET, BY TYPE, 2020-2030 ($MILLION)
TABLE 32.MALAYSIA CUTTINGS RE-INJECTION SERVICES MARKET, BY APPLICATION, 2020-2030 ($MILLION)
TABLE 33.AUSTRALIA CUTTINGS RE-INJECTION SERVICES MARKET, BY TYPE, 2020-2030 ($MILLION)
TABLE 34.AUSTRALIA CUTTINGS RE-INJECTION SERVICES MARKET, BY APPLICATION, 2020-2030 ($MILLION)
TABLE 35.REST OF ASIA-PACIFIC CUTTINGS RE-INJECTION SERVICES MARKET, BY TYPE, 2020-2030 ($MILLION)
TABLE 36.REST OF ASIA-PACIFIC CUTTINGS RE-INJECTION SERVICES MARKET, BY APPLICATION, 2020-2030 ($MILLION)
TABLE 37.LAMEA CUTTINGS RE-INJECTION SERVICES MARKET, BY TYPE, 2020-2030 ($MILLION)
TABLE 38.LAMEA CUTTINGS RE-INJECTION SERVICES MARKET, BY APPLICATION, 2020-2030 ($MILLION)
TABLE 39.LAMEA CUTTINGS RE-INJECTION SERVICES MARKET, BY COUNTRY, 2020-2030 ($MILLION)
TABLE 40.LATIN AMERICA CUTTINGS RE-INJECTION SERVICES MARKET, BY TYPE, 2020-2030 ($MILLION)
TABLE 41.LATIN AMERICA CUTTINGS RE-INJECTION SERVICES MARKET, BY APPLICATION, 2020-2030 ($MILLION)
TABLE 42.MIDDLE EAST CUTTINGS RE-INJECTION SERVICES MARKET, BY TYPE, 2020-2030 ($MILLION)
TABLE 43.MIDDLE EAST CUTTINGS RE-INJECTION SERVICES MARKET, BY APPLICATION, 2020-2030 ($MILLION)
TABLE 44.AFRICA CUTTINGS RE-INJECTION SERVICES MARKET, BY TYPE, 2020-2030 ($MILLION)
TABLE 45.AFRICA CUTTINGS RE-INJECTION SERVICES MARKET, BY APPLICATION, 2020-2030 ($MILLION)
TABLE 46.BAKER HUGHES: KEY EXECUTIVES
TABLE 47.BAKER HUGHES: COMPANY SNAPSHOT
TABLE 48.BAKER HUGHES: OPERATING SEGMENTS
TABLE 49.BAKER HUGHES: PRODUCT PORTFOLIO
TABLE 50.BAKER HUGHES: NET SALES, 2018–2020 ($MILLION)
TABLE 51.NOV: KEY EXECUTIVES
TABLE 52.NOV: COMPANY SNAPSHOT
TABLE 53.NOV: OPERATING SEGMENTS
TABLE 54.NOV: PRODUCT PORTFOLIO
TABLE 55.NOV: NET SALES, 2018–2020($MILLION)
TABLE 56.ADVANTEK: KEY EXECUTIVES
TABLE 57.ADVANTEK: COMPANY SNAPSHOT
TABLE 58.ADVANTEK: PRODUCT PORTFOLIO
TABLE 59.AUGEAN: KEY EXECUTIVES
TABLE 60.AUGEAN: COMPANY SNAPSHOT
TABLE 61.AUGEAN: OPERATING SEGMENTS
TABLE 62.AUGEAN: PRODUCT PORTFOLIO
TABLE 63.AUGEAN: NET SALES, 2018–2020 ($MILLION)
TABLE 64.GN SOLIDS: KEY EXECUTIVES
TABLE 65.GN SOLIDS: COMPANY SNAPSHOT
TABLE 66.GN SOLIDS: PRODUCT PORTFOLIO
TABLE 67.HALLIBURTON: COMPANY SNAPSHOT
TABLE 68.HALLIBURTON: OPERATING SEGMENT
TABLE 69.HALLIBURTON: PRODUCT PORTFOLIO
TABLE 70.OVERALL FINANCIAL STATUS ($MILLION)
TABLE 71.SCHLUMBERGER: COMPANY SNAPSHOT
TABLE 72.SCHLUMBERGER: OPERATING SEGMENTS
TABLE 73.SCHLUMBERGER: PRODUCT PORTFOLIO
TABLE 74.OVERALL FINANCIAL STATUS ($MILLION)
TABLE 75.PPLI: COMPANY SNAPSHOT
TABLE 76.PPLI: PRODUCT PORTFOLIO
TABLE 77.WEATHERFORD: COMPANY SNAPSHOT
TABLE 78.WEATHERFORD: OPERATING SEGMENTS
TABLE 79.WEATHERFORD: PRODUCT PORTFOLIO
TABLE 80.OVERALL FINANCIAL STATUS ($MILLION)
TABLE 81.TERRALOG I: COMPANY SNAPSHOT
TABLE 82.TERRALOG : PRODUCT PORTFOLIO

LIST OF FIGURES

FIGURE 01.KEY MARKET SEGMENTS
FIGURE 02.CUTTINGS RE-INJECTION SERVICES MARKET SNAPSHOT, BY SEGMENTATION, 2021–2030
FIGURE 03.CUTTINGS RE-INJECTION SERVICES MARKET SNAPSHOT, BY REGION, 2021–2030
FIGURE 04.TOP INVESTMENT POCKETS, BY COUNTRY
FIGURE 05.HIGH BARGAINING POWER OF SUPPLIERS
FIGURE 06.MODERATE BARGAINING POWER OF BUYERS
FIGURE 07.HIGH THREAT OF SUBSTITUTES
FIGURE 08.MODERATE THREAT OF NEW ENTRANTS
FIGURE 09.MODERATE INTENSITY OF RIVALRY
FIGURE 10.TOP PLAYER POSITIONING, 2020
FIGURE 11.CUTTINGS RE-INJECTION SERVICES: MARKET DYNAMICS
FIGURE 12.CUTTINGS RE-INJECTION SERVICES MARKET, BY TYPE, 2020–2030 ($MILLION)
FIGURE 13.COMPARATIVE ANALYSIS OF CUTTINGS RE-INJECTION SERVICES MARKET, FOR DEDICATED INJECTION, BY COUNTRY, 2020 & 2030 ($MILLION)
FIGURE 14.COMPARATIVE ANALYSIS OF CUTTINGS RE-INJECTION SERVICES MARKET, FOR ANNULAR INJECTION,  BY COUNTRY, 2020 & 2030 ($MILLION)
FIGURE 15.CUTTINGS RE-INJECTION SERVICES MARKET, BY APPLICATION, 2020–2030 ($MILLION)
FIGURE 16.COMPARATIVE ANALYSIS OF CUTTINGS RE-INJECTION SERVICES MARKET, FOR ON-SHORE, BY COUNTRY,  2020 & 2030 ($MILLION)
FIGURE 17.COMPARATIVE ANALYSIS OF CUTTINGS RE-INJECTION SERVICES MARKET, FOR OFF-SHORE, BY COUNTRY,  2020 & 2030 ($MILLION)
FIGURE 18.U.S. CUTTINGS RE-INJECTION SERVICES MARKET REVENUE, 2020-2030 ($MILLION)
FIGURE 19.CANADA CUTTINGS RE-INJECTION SERVICES MARKET REVENUE, 2020-2030 ($MILLION)
FIGURE 20.UK CUTTINGS RE-INJECTION SERVICES MARKET REVENUE, 2020-2030 ($MILLION)
FIGURE 21.RUSSIA CUTTINGS RE-INJECTION SERVICES MARKET REVENUE, 2020-2030 ($MILLION)
FIGURE 22.NORWAY CUTTINGS RE-INJECTION SERVICES MARKET REVENUE, 2020-2030 ($MILLION)
FIGURE 23.REST OF EUROPE CUTTINGS RE-INJECTION SERVICES MARKET REVENUE, 2020-2030 ($MILLION)
FIGURE 24.CHINA CUTTINGS RE-INJECTION SERVICES MARKET REVENUE, 2020-2030 ($MILLION)
FIGURE 25.MALAYSIA CUTTINGS RE-INJECTION SERVICES MARKET REVENUE, 2020-2030 ($MILLION)
FIGURE 26.AUSTRALIA CUTTINGS RE-INJECTION SERVICES MARKET REVENUE, 2020-2030 ($MILLION)
FIGURE 27.REST OF ASIA-PACIFIC CUTTINGS RE-INJECTION SERVICES MARKET REVENUE, 2020-2030 ($MILLION)
FIGURE 28.LATIN AMERICA CUTTINGS RE-INJECTION SERVICES MARKET REVENUE, 2020-2030 ($MILLION)
FIGURE 29.MIDDLE EAST CUTTINGS RE-INJECTION SERVICES MARKET REVENUE, 2020-2030 ($MILLION)
FIGURE 30.AFRICA CUTTINGS RE-INJECTION SERVICES MARKET REVENUE, 2020-2030 ($MILLION)
FIGURE 31.BAKER HUGHES: NET SALES, 2018–2020 ($MILLION)
FIGURE 32.BAKER HUGHES: REVENUE SHARE BY SEGMENT, 2020 (%)
FIGURE 33.BAKER HUGHES: REVENUE SHARE BY REGION, 2020 (%)
FIGURE 34.NOV: NET SALES, 2018–2020 ($MILLION)
FIGURE 35.NOV: REVENUE SHARE BY SEGMENT, 2020 (%)
FIGURE 36.NOV: REVENUE SHARE BY REGION, 2020 (%)
FIGURE 37.AUGEAN: NET SALES, 2018–2020 ($MILLION)
FIGURE 38.AUGEAN: REVENUE SHARE BY SEGMENT, 2020 (%)
FIGURE 39.HALLIBURTON: REVENUE, 2018–2020 ($MILLION)
FIGURE 40.HALLIBURTON: REVENUE SHARE BY SEGMENT, 2020 (%)
FIGURE 41.HALLIBURTON: REVENUE SHARE BY REGION, 2020 (%)
FIGURE 42.SCHLUMBERGER: REVENUE, 2018–2020 ($MILLION)
FIGURE 43.SCHLUMBERGER: REVENUE SHARE BY SEGMENT, 2019 (%)
FIGURE 44.SCHLUMBERGER: REVENUE SHARE BY REGION, 2019 (%)
FIGURE 45.WEATHERFORD: NET SALES, 2018–2020 ($MILLION)
FIGURE 46.WEATHERFORD: REVENUE SHARE BY SEGMENT, 2020 (%)
FIGURE 47.WEATHERFORD: REVENUE SHARE BY REGION, 2020 (%)


The market witnessed very low asset utilization owing to project delay, cancellations, and production closedown.

Furthermore, the business models are hugely challenged by much lower levels of drilling activity. If industry participants desire to keep the growth, they need to turn into energy transition and assist via quick innovation & development of advanced solutions for energy producers and consumers. Furthermore, the rising environmental concerns is expected to boost the demand for drill waste management services.

PURCHASE OPTIONS

Call or Email us

U.S.-Canada Toll-free: +1-800-792-5285
Int'l : +1-503-894-6022
Europe : +44-845-528-1300
Email : help@alliedmarketresearch.com
 
FREQUENTLY ASKED QUESTIONS?

A. The rising environmental concerns and stringent governmental regulations regarding drill waste are some of the factors driving the market.

A. Agreement/Contract is the key growth strategies adopted by cuttings re-injection Services market players

A. The report sample for global Cuttings re-injection Services market report can be obtained on demand from the website. Also, the 24*7 chat support and direct call services are provided to procure the sample report.

A. Asia-Pacific is expected to offer more business opportunities for cuttings re-injection Services in future.

A. MI SWACO, Baker Hughes are some of the leading players in the cuttings re-injection services market.

A. The top ten market players are selected based on two key attributes - competitive strength and market positioning

A. On the basis of type, annular injection segment garnered highest share in the cuttings re-injection services market.

A. The oil and gas companies are the potential customers for cutting re-injection services.

A. The market is expected to grow at moderate growth rate owing to rising drill waste concerns.

A. The report provides extensive qualitative and quantitative analysis of the current trends and future estimations of the market from 2021 to 2030 to determine the prevailing opportunities. A comprehensive analysis of the factors that drive and restrict the growth of the market is provided. Estimations and forecast are based on factors impacting the market growth, in terms of revenue.

A. The world moving towards clean energy will negative influence the oil and gas sector which will consequently decrease the demand for oilfield services such as cuttings re-injection services.

Looking for Customization?

 Customization Request

Have a Question?

 Speak with Analyst

Any Confusion?

 Inquire Before Buying

Have a glance of the Report

  Request Sample
RELATED TAGS

Purchase Full Report of
Cuttings Re-injection Services Market

Start reading instantly.
This Report and over 66,804+ more Reports, Available with Avenue Library. T&C*.

  • Online Only
  • $3,456
  • Online cloud access only
  • Restricted print, copy, paste & download
  • Read only
  • Free industry update
    (Within 180 days)
  • Free report update in next update cycle
    (Sep 2022 - Sep 2023)
  • Data Pack
  • $3,840
  • Restricted to one authorized user
  • One print only
  • Available in
    Excel
  • Free industry update
    (Within 180 days)
  •   Free report update in next update cycle
    (Sep 2022 - Sep 2023)
  • Single User
  • $5,769
  • Restricted to one authorized user
  • One print only
  • Available in
    PDF
  • Free industry update
    (Within 180 days)
  •   Free report update in next update cycle
    (Sep 2022 - Sep 2023)
  • Five Users
  • $6,450
  • Limited to five authorized users
  • Print upto five copies
  • Available in
    PDF
  • Free industry update
    (Within 180 days)
  •   Free report update in next update cycle
    (Sep 2022 - Sep 2023)
  • Enterprise
    License/PDF

  • $10,995
  • Unlimited
    within
    company/enterprise
  • Available in Excel & PDF
  • Free industry update
    (Within 180 days)
  •   Free report update in next update cycle
    (Sep 2022 - Sep 2023)
  • Library
    Membership

  • $999 $ 1,175
    Per User/ Per month/ Billed annually
  • Published Content
    E-access
  • Company Profiles
    E-access
  • Newly Added Content Access
  • 10 PDF
    Downloads
  • 5 Excel Data
    Pack Downloads
  • 250 Company Profiles PDF Downloads
  • Buy Now

*Taxes/Fees, if applicable will be added during checkout. All prices in USD

RELATED REPORTS
 

Why Allied Market Research?


Infallible Methodology

To ensure high-level data integrity, accurate analysis, and impeccable forecasts

Analyst Support

For complete satisfaction

Customization

On-demand customization of scope of the report to exactly meet your needs

TARGETED MARKET VIEW

Targeted market view to provide pertinent information and save time of readers

Get fresh content delivered

Get insights on topics that are crucial for your business. Stay abreast of your interest areas.

Get Industry Data Alerts

Why Allied Market Research?

Infallible Methodology

To ensure high-level data integrity, accurate analysis, and impeccable forecasts

Analyst Support

For complete satisfaction

Customization

On-demand customization of scope of the report to exactly meet your needs

TARGETED MARKET VIEW

Targeted market view to provide pertinent information and save time of readers