0
2022
Data Virtualization Market

Data Virtualization Market

by Component (Solution, Services), by Deployment Model (On-premise, Cloud), by Enterprise size (Large Enterprises, SMEs), by End User (IT and telecom, BFSI, Government and Defense, Healthcare and Life Sciences, Retail, Manufacturing, Education, Others): Global Opportunity Analysis and Industry Forecast, 2021-2031

Report Code: A17598
Aug 2022 | Pages: 334
Tables: 202
Charts: 72
  • Formats*:

  • pdf

    Single User License, Five User
    License & Enterprise User License

  • xls

    Data Pack Excel License

  • ppt

    It comes with the additional cost
    of $2500.00 contact sales.


Data Virtualization Market Research, 2031

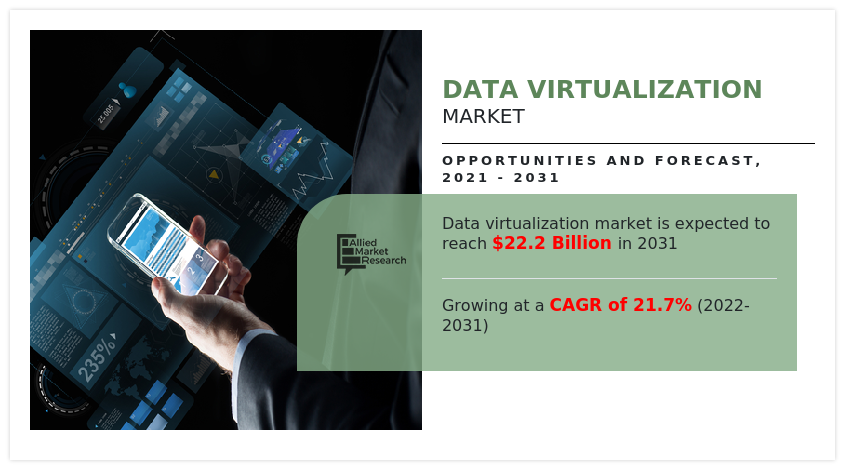
The global data virtualization market was valued at $3.2 billion in 2021, and is projected to reach $22.2 billion by 2031, growing at a CAGR of 21.7% from 2022 to 2031.

The data virtualization market has seen a huge surge in demand for a secure and flexible cloud computing environment solution. However, lack of skill workforce availability across the world, halted, due to the economic slowdown and global lockdown. Subsequently, affecting the growth of data virtualization market during 2020

Data virtualization is a technique that enables a system to compile data from several sources and convert it to produce a virtual, logical, and unified customer picture. It can be accessed through front-end solutions such as apps, displays, and portals, and it is not necessary to know technical details about the data, such as where it is physically situated or how it has been formatted. The National Institute of Standards and Technology (NIST) reports that the use of complete virtualization products and services has recently increased, due to a number of benefits. Organizations from a variety of industries are heavily using this solution, particularly those in the manufacturing, banking, and telecommunications sectors. For example, global pharma and biotechnology company Pfizer adopted data virtualization solution from Tibco to improve data delivery speed to its researchers. Retail company city furniture, uses data virtualization solution from Denodo to manage all critical business data in its marketing, operation, supply chain, and other departments. One of the main factors anticipated to propel Data Virtualization Market Growth during the projected period is the expanding volume of data from various sources across enterprises and the rising requirement for data integration tools. In addition, increase in cloud-based solution demand and increased business intelligence software usage are anticipated to boost industry expansion and Data Virtualization Industry revenue growth.

Major growth drivers of the market include enterprises' increase in demand for advanced visualization technology, production of enormous volumes of data, and increase in investments in visualization platforms and business collaborations.

Data Virtualization Market, Data Virtualization Industry, Data Virtualization Market Size, Data Virtualization Market Share, Data Virtualization Market Trends, Data Virtualization Market Growth, Data Virtualization Market Forecast, Data Virtualization Market Analysis

The data virtualization market is segmented into Component, Deployment Model, Enterprise size and End User.By component, it is segmented into standalone software, data integration solution, and application tool solution. By data integration solution, it is segmented into BI tools, enterprise application, mobile and web application. Based on deployment model, the market is categorized into on-premise and cloud. Based on enterprise size, the market is categorized into SMEs and large enterprises. Based on end user, the market is categorized into IT and telecom, BFSI, government and defense, healthcare and life science, retail, manufacturing, education, others.  Region wise, it is analyzed across North America, Europe, Asia-Pacific and LAMEA.

Data Virtualization Market

On the basis of component, the solution segment dominated the Data Virtualization Industry in 2021, and is expected to maintain the dominance in the upcoming years, owing to restrict and maintain internal cyber threats and risks, such as unauthorized access, data theft, and more. However, the services is expected to witness the highest growth rate during the Data Virtualization Market Forecast period. Data virtualization services mechanisms manage and secure accounts that have system access beyond that of a standard user to secure the confidentiality of data servers.

Data Virtualization Market

On the basis end user, the IT and telecom segment dominated the Data Virtualization Market Share in 2021, and is expected to maintain its dominance in the upcoming years. It is because, it helps the organizations to optimize their artificial intelligence-powered IT infrastructure resource utilization core competency and save operating costs. However, the retail segment is expected to witness the highest growth rate during the forecast period, as to reduce the price of document generation, printing, and dissemination. In addition, a variety of printing and mailroom concerns can be resolved with Data Virtualization Software.

Data Virtualization Market

North America is a rapidly growing region in the global data virtualization market, in terms of technological advancements and adoption. It possesses well-equipped infrastructure and the ability to afford data virtualization solutions. Furthermore, owing to rise in competition between cloud-based service providers in North America, key players are providing more data management for data by ensuring quick access and greater outreach of their services to the clients, which drives the growth of the data virtualization market in this region. In addition, the major factors that are contribute toward the growth of data virtualization in North America are increase in usage of mobile & web. In addition, increase in dependency on internet and social media platforms is another major factor fueling the market growth in this region.

COVID-19 impact analysis

Post COVID-19, the data virtualization market size is estimated to grow from $3,170 million in 2021, and is projected to reach $22224.7 million by 2031, registering a CAGR of 21.7%. It is projected that the COVID-19 outbreak will benefit the development of the data virtualization business. This is due to the fact that the implementation of COVID-19 will make it possible for businesses to handle security concerns and provide secured information access when conducting remote operations. In addition, the data virtualization market has seen a huge surge in demand for a secure and flexible cloud computing environment solution. However, lack of skill workforce availability across the world, halted, due to the economic slowdown and global lockdown. Subsequently, affecting the growth of data virtualization market during 2020.

Countries across the globe have suffered major loss of business and revenue, owing to shutdown of manufacturing or type units. But the rise in adoption of cloud computing or application container major enterprises across prime economies is expected to offer significant opportunities for the growth of Data Virtualization Software market. This is expected to hamper the growth of market in by the end of 2021

Top impacting factors   

Enterprises' increasing demand for advanced visualization technology

The amount of data produced during the last few years by various technologies, including the Internet of Things (IoT) and other data sources, is growing dramatically. Both structured and unstructured data are present in this enormous data set. To manage massive volumes of data and produce a better and more informed interpretation of statistics, businesses are increasingly choosing business intelligence software with cutting-edge technology like artificial intelligence (AI).

In addition, visualization technologies provide a high degree of customization and specificity to comprehend complex data. For instance, one of the major players in the advisory services market, Deloitte Touche Tohmatsu Ltd., introduced an advanced public data visualization tool in September 2019. This tool offers insights based on coding algorithms, visualization techniques, and further refines them with technologies like artificial intelligence (AI), machine learning (ML), blockchain, and big data analytics, among others. Such cutting-edge technology integration is supporting market expansion.                                                 

Production of enormous volumes of data

Organizations have generated more data over the past few years for a variety of reasons, including digitalization, the Internet of Things, and improvements in older technology. In addition, one of the key contributors to the production of enormous volumes of data is the use of devices that are connected to the internet. Quick access to data has grown challenging since the data generated by these sources is kept in diverse formats at distinct physical locations. In addition, the development of numerous applications, including cloud, software as a service (SaaS), and internet of things (IoT), is adding to the massive volume of data collected. As a result, managing and integrating data from diverse sources is essential for real-time data availability. In addition, data virtualization solutions have advantages including better data management, a quicker time to market, and increased data quality. These are a few of the important variables propelling the data virtualization market's overall expansion.

Key Benefits For Stakeholders

  • This report provides a quantitative analysis of the market segments, current trends, estimations, and dynamics of the data virtualization market analysis from 2021 to 2031 to identify the prevailing data virtualization market opportunities.
  • The market research is offered along with information related to key drivers, restraints, and opportunities.
  • Porter's five forces analysis highlights the potency of buyers and suppliers to enable stakeholders make profit-oriented business decisions and strengthen their supplier-buyer network.
  • In-depth analysis of the data virtualization market segmentation assists to determine the prevailing market opportunities.
  • Major countries in each region are mapped according to their revenue contribution to the global market.
  • Market player positioning facilitates benchmarking and provides a clear understanding of the present position of the market players.
  • The report includes the analysis of the regional as well as global data virtualization market trends, key players, market segments, application areas, and market growth strategies.

Data Virtualization Market Report Highlights

Aspects Details
By Component
  • Solution
    • Standalone Software
    • Data Integration Solution
    • Application Tool Solution
  • Services
By Deployment Model
  • On-premise
  • Cloud
By Enterprise size
  • Large Enterprises
  • SMEs
By End User
  • IT and telecom
  • BFSI
  • Government and Defense
  • Healthcare and Life Sciences
  • Retail
  • Manufacturing
  • Education
  • Others
By Region
  • North America  (U.S., Canada)
  • Europe  (UK, Germany, France, Italy, Spain, Rest of Europe)
  • Asia-Pacific  (China, India, Japan, Australia, South Korea, Rest of Asia-Pacific)
  • LAMEA  (Latin America, Middle East, Africa)
Key Market Players Oracle Corporation, Informatica Inc., Microsoft Corporation, Domo Inc., SAP SE, Tableau Software Inc, Cisco Systems, Inc., OpenLink Software Inc., SAS Institute Inc., Alteryx Inc., Adaptive Insights, QlikTech International AB, IBM, Denodo Technologies Inc., ChartBlocks ltd., Cluvio GmbH
 
  • CHAPTER 1:INTRODUCTION

    • 1.1.Report description

    • 1.2.Key market segments

    • 1.3.Key benefits to the stakeholders

    • 1.4.Research Methodology

      • 1.4.1.Secondary research

      • 1.4.2.Primary research

      • 1.4.3.Analyst tools and models

  • CHAPTER 2:EXECUTIVE SUMMARY

    • 2.1.Key findings of the study

    • 2.2.CXO Perspective

  • CHAPTER 3:MARKET OVERVIEW

    • 3.1.Market definition and scope

    • 3.2.Key findings

      • 3.2.1.Top investment pockets

    • 3.3.Porter’s five forces analysis

    • 3.4.Top player positioning

    • 3.5.Market dynamics

      • 3.5.1.Drivers

      • 3.5.2.Restraints

      • 3.5.3.Opportunities

    • 3.6.COVID-19 Impact Analysis on the market

    • 3.7.Patent Landscape

    • 3.8.Key Regulation Analysis

  • CHAPTER 4: DATA VIRTUALIZATION MARKET, BY COMPONENT

    • 4.1 Overview

      • 4.1.1 Market size and forecast

    • 4.2 Solution

      • 4.2.1 Key market trends, growth factors and opportunities

      • 4.2.2 Market size and forecast, by region

      • 4.2.3 Market analysis by country

    • 4.3 Services

      • 4.3.1 Key market trends, growth factors and opportunities

      • 4.3.2 Market size and forecast, by region

      • 4.3.3 Market analysis by country

  • CHAPTER 5: DATA VIRTUALIZATION MARKET, BY DEPLOYMENT MODEL

    • 5.1 Overview

      • 5.1.1 Market size and forecast

    • 5.2 On-premise

      • 5.2.1 Key market trends, growth factors and opportunities

      • 5.2.2 Market size and forecast, by region

      • 5.2.3 Market analysis by country

    • 5.3 Cloud

      • 5.3.1 Key market trends, growth factors and opportunities

      • 5.3.2 Market size and forecast, by region

      • 5.3.3 Market analysis by country

  • CHAPTER 6: DATA VIRTUALIZATION MARKET, BY ENTERPRISE SIZE

    • 6.1 Overview

      • 6.1.1 Market size and forecast

    • 6.2 Large Enterprises

      • 6.2.1 Key market trends, growth factors and opportunities

      • 6.2.2 Market size and forecast, by region

      • 6.2.3 Market analysis by country

    • 6.3 SMEs

      • 6.3.1 Key market trends, growth factors and opportunities

      • 6.3.2 Market size and forecast, by region

      • 6.3.3 Market analysis by country

  • CHAPTER 7: DATA VIRTUALIZATION MARKET, BY END USER

    • 7.1 Overview

      • 7.1.1 Market size and forecast

    • 7.2 IT and telecom

      • 7.2.1 Key market trends, growth factors and opportunities

      • 7.2.2 Market size and forecast, by region

      • 7.2.3 Market analysis by country

    • 7.3 BFSI

      • 7.3.1 Key market trends, growth factors and opportunities

      • 7.3.2 Market size and forecast, by region

      • 7.3.3 Market analysis by country

    • 7.4 Government and Defense

      • 7.4.1 Key market trends, growth factors and opportunities

      • 7.4.2 Market size and forecast, by region

      • 7.4.3 Market analysis by country

    • 7.5 Healthcare and Life Sciences

      • 7.5.1 Key market trends, growth factors and opportunities

      • 7.5.2 Market size and forecast, by region

      • 7.5.3 Market analysis by country

    • 7.6 Retail

      • 7.6.1 Key market trends, growth factors and opportunities

      • 7.6.2 Market size and forecast, by region

      • 7.6.3 Market analysis by country

    • 7.7 Manufacturing

      • 7.7.1 Key market trends, growth factors and opportunities

      • 7.7.2 Market size and forecast, by region

      • 7.7.3 Market analysis by country

    • 7.8 Education

      • 7.8.1 Key market trends, growth factors and opportunities

      • 7.8.2 Market size and forecast, by region

      • 7.8.3 Market analysis by country

    • 7.9 Others

      • 7.9.1 Key market trends, growth factors and opportunities

      • 7.9.2 Market size and forecast, by region

      • 7.9.3 Market analysis by country

  • CHAPTER 8: DATA VIRTUALIZATION MARKET, BY REGION

    • 8.1 Overview

      • 8.1.1 Market size and forecast

    • 8.2 North America

      • 8.2.1 Key trends and opportunities

      • 8.2.2 North America Market size and forecast, by Component

      • 8.2.3 North America Market size and forecast, by Deployment Model

      • 8.2.4 North America Market size and forecast, by Enterprise size

      • 8.2.5 North America Market size and forecast, by End User

      • 8.2.6 North America Market size and forecast, by country

        • 8.2.6.1 U.S.
          • 8.2.6.1.1 Market size and forecast, by Component
          • 8.2.6.1.2 Market size and forecast, by Deployment Model
          • 8.2.6.1.3 Market size and forecast, by Enterprise size
          • 8.2.6.1.4 Market size and forecast, by End User
        • 8.2.6.2 Canada
          • 8.2.6.2.1 Market size and forecast, by Component
          • 8.2.6.2.2 Market size and forecast, by Deployment Model
          • 8.2.6.2.3 Market size and forecast, by Enterprise size
          • 8.2.6.2.4 Market size and forecast, by End User
    • 8.3 Europe

      • 8.3.1 Key trends and opportunities

      • 8.3.2 Europe Market size and forecast, by Component

      • 8.3.3 Europe Market size and forecast, by Deployment Model

      • 8.3.4 Europe Market size and forecast, by Enterprise size

      • 8.3.5 Europe Market size and forecast, by End User

      • 8.3.6 Europe Market size and forecast, by country

        • 8.3.6.1 UK
          • 8.3.6.1.1 Market size and forecast, by Component
          • 8.3.6.1.2 Market size and forecast, by Deployment Model
          • 8.3.6.1.3 Market size and forecast, by Enterprise size
          • 8.3.6.1.4 Market size and forecast, by End User
        • 8.3.6.2 Germany
          • 8.3.6.2.1 Market size and forecast, by Component
          • 8.3.6.2.2 Market size and forecast, by Deployment Model
          • 8.3.6.2.3 Market size and forecast, by Enterprise size
          • 8.3.6.2.4 Market size and forecast, by End User
        • 8.3.6.3 France
          • 8.3.6.3.1 Market size and forecast, by Component
          • 8.3.6.3.2 Market size and forecast, by Deployment Model
          • 8.3.6.3.3 Market size and forecast, by Enterprise size
          • 8.3.6.3.4 Market size and forecast, by End User
        • 8.3.6.4 Italy
          • 8.3.6.4.1 Market size and forecast, by Component
          • 8.3.6.4.2 Market size and forecast, by Deployment Model
          • 8.3.6.4.3 Market size and forecast, by Enterprise size
          • 8.3.6.4.4 Market size and forecast, by End User
        • 8.3.6.5 Spain
          • 8.3.6.5.1 Market size and forecast, by Component
          • 8.3.6.5.2 Market size and forecast, by Deployment Model
          • 8.3.6.5.3 Market size and forecast, by Enterprise size
          • 8.3.6.5.4 Market size and forecast, by End User
        • 8.3.6.6 Rest of Europe
          • 8.3.6.6.1 Market size and forecast, by Component
          • 8.3.6.6.2 Market size and forecast, by Deployment Model
          • 8.3.6.6.3 Market size and forecast, by Enterprise size
          • 8.3.6.6.4 Market size and forecast, by End User
    • 8.4 Asia-Pacific

      • 8.4.1 Key trends and opportunities

      • 8.4.2 Asia-Pacific Market size and forecast, by Component

      • 8.4.3 Asia-Pacific Market size and forecast, by Deployment Model

      • 8.4.4 Asia-Pacific Market size and forecast, by Enterprise size

      • 8.4.5 Asia-Pacific Market size and forecast, by End User

      • 8.4.6 Asia-Pacific Market size and forecast, by country

        • 8.4.6.1 China
          • 8.4.6.1.1 Market size and forecast, by Component
          • 8.4.6.1.2 Market size and forecast, by Deployment Model
          • 8.4.6.1.3 Market size and forecast, by Enterprise size
          • 8.4.6.1.4 Market size and forecast, by End User
        • 8.4.6.2 India
          • 8.4.6.2.1 Market size and forecast, by Component
          • 8.4.6.2.2 Market size and forecast, by Deployment Model
          • 8.4.6.2.3 Market size and forecast, by Enterprise size
          • 8.4.6.2.4 Market size and forecast, by End User
        • 8.4.6.3 Japan
          • 8.4.6.3.1 Market size and forecast, by Component
          • 8.4.6.3.2 Market size and forecast, by Deployment Model
          • 8.4.6.3.3 Market size and forecast, by Enterprise size
          • 8.4.6.3.4 Market size and forecast, by End User
        • 8.4.6.4 Australia
          • 8.4.6.4.1 Market size and forecast, by Component
          • 8.4.6.4.2 Market size and forecast, by Deployment Model
          • 8.4.6.4.3 Market size and forecast, by Enterprise size
          • 8.4.6.4.4 Market size and forecast, by End User
        • 8.4.6.5 South Korea
          • 8.4.6.5.1 Market size and forecast, by Component
          • 8.4.6.5.2 Market size and forecast, by Deployment Model
          • 8.4.6.5.3 Market size and forecast, by Enterprise size
          • 8.4.6.5.4 Market size and forecast, by End User
        • 8.4.6.6 Rest of Asia-Pacific
          • 8.4.6.6.1 Market size and forecast, by Component
          • 8.4.6.6.2 Market size and forecast, by Deployment Model
          • 8.4.6.6.3 Market size and forecast, by Enterprise size
          • 8.4.6.6.4 Market size and forecast, by End User
    • 8.5 LAMEA

      • 8.5.1 Key trends and opportunities

      • 8.5.2 LAMEA Market size and forecast, by Component

      • 8.5.3 LAMEA Market size and forecast, by Deployment Model

      • 8.5.4 LAMEA Market size and forecast, by Enterprise size

      • 8.5.5 LAMEA Market size and forecast, by End User

      • 8.5.6 LAMEA Market size and forecast, by country

        • 8.5.6.1 Latin America
          • 8.5.6.1.1 Market size and forecast, by Component
          • 8.5.6.1.2 Market size and forecast, by Deployment Model
          • 8.5.6.1.3 Market size and forecast, by Enterprise size
          • 8.5.6.1.4 Market size and forecast, by End User
        • 8.5.6.2 Middle East
          • 8.5.6.2.1 Market size and forecast, by Component
          • 8.5.6.2.2 Market size and forecast, by Deployment Model
          • 8.5.6.2.3 Market size and forecast, by Enterprise size
          • 8.5.6.2.4 Market size and forecast, by End User
        • 8.5.6.3 Africa
          • 8.5.6.3.1 Market size and forecast, by Component
          • 8.5.6.3.2 Market size and forecast, by Deployment Model
          • 8.5.6.3.3 Market size and forecast, by Enterprise size
          • 8.5.6.3.4 Market size and forecast, by End User
  • CHAPTER 9: COMPANY LANDSCAPE

    • 9.1. Introduction

    • 9.2. Top winning strategies

    • 9.3. Product Mapping of Top 10 Player

    • 9.4. Competitive Dashboard

    • 9.5. Competitive Heatmap

    • 9.6. Key developments

  • CHAPTER 10: COMPANY PROFILES

    • 10.1 Adaptive Insights

      • 10.1.1 Company overview

      • 10.1.2 Company snapshot

      • 10.1.3 Operating business segments

      • 10.1.4 Product portfolio

      • 10.1.5 Business performance

      • 10.1.6 Key strategic moves and developments

    • 10.2 Alteryx Inc.

      • 10.2.1 Company overview

      • 10.2.2 Company snapshot

      • 10.2.3 Operating business segments

      • 10.2.4 Product portfolio

      • 10.2.5 Business performance

      • 10.2.6 Key strategic moves and developments

    • 10.3 ChartBlocks ltd.

      • 10.3.1 Company overview

      • 10.3.2 Company snapshot

      • 10.3.3 Operating business segments

      • 10.3.4 Product portfolio

      • 10.3.5 Business performance

      • 10.3.6 Key strategic moves and developments

    • 10.4 Cluvio GmbH

      • 10.4.1 Company overview

      • 10.4.2 Company snapshot

      • 10.4.3 Operating business segments

      • 10.4.4 Product portfolio

      • 10.4.5 Business performance

      • 10.4.6 Key strategic moves and developments

    • 10.5 Domo Inc.

      • 10.5.1 Company overview

      • 10.5.2 Company snapshot

      • 10.5.3 Operating business segments

      • 10.5.4 Product portfolio

      • 10.5.5 Business performance

      • 10.5.6 Key strategic moves and developments

    • 10.6 Tableau Software Inc

      • 10.6.1 Company overview

      • 10.6.2 Company snapshot

      • 10.6.3 Operating business segments

      • 10.6.4 Product portfolio

      • 10.6.5 Business performance

      • 10.6.6 Key strategic moves and developments

    • 10.7 QlikTech International AB

      • 10.7.1 Company overview

      • 10.7.2 Company snapshot

      • 10.7.3 Operating business segments

      • 10.7.4 Product portfolio

      • 10.7.5 Business performance

      • 10.7.6 Key strategic moves and developments

    • 10.8 Oracle Corporation

      • 10.8.1 Company overview

      • 10.8.2 Company snapshot

      • 10.8.3 Operating business segments

      • 10.8.4 Product portfolio

      • 10.8.5 Business performance

      • 10.8.6 Key strategic moves and developments

    • 10.9 IBM

      • 10.9.1 Company overview

      • 10.9.2 Company snapshot

      • 10.9.3 Operating business segments

      • 10.9.4 Product portfolio

      • 10.9.5 Business performance

      • 10.9.6 Key strategic moves and developments

    • 10.10 Cisco Systems, Inc.

      • 10.10.1 Company overview

      • 10.10.2 Company snapshot

      • 10.10.3 Operating business segments

      • 10.10.4 Product portfolio

      • 10.10.5 Business performance

      • 10.10.6 Key strategic moves and developments

    • 10.11 SAP SE

      • 10.11.1 Company overview

      • 10.11.2 Company snapshot

      • 10.11.3 Operating business segments

      • 10.11.4 Product portfolio

      • 10.11.5 Business performance

      • 10.11.6 Key strategic moves and developments

    • 10.12 SAS Institute Inc.

      • 10.12.1 Company overview

      • 10.12.2 Company snapshot

      • 10.12.3 Operating business segments

      • 10.12.4 Product portfolio

      • 10.12.5 Business performance

      • 10.12.6 Key strategic moves and developments

    • 10.13 Microsoft Corporation

      • 10.13.1 Company overview

      • 10.13.2 Company snapshot

      • 10.13.3 Operating business segments

      • 10.13.4 Product portfolio

      • 10.13.5 Business performance

      • 10.13.6 Key strategic moves and developments

    • 10.14 Denodo Technologies Inc.

      • 10.14.1 Company overview

      • 10.14.2 Company snapshot

      • 10.14.3 Operating business segments

      • 10.14.4 Product portfolio

      • 10.14.5 Business performance

      • 10.14.6 Key strategic moves and developments

    • 10.15 Informatica Inc.

      • 10.15.1 Company overview

      • 10.15.2 Company snapshot

      • 10.15.3 Operating business segments

      • 10.15.4 Product portfolio

      • 10.15.5 Business performance

      • 10.15.6 Key strategic moves and developments

    • 10.16 OpenLink Software Inc.

      • 10.16.1 Company overview

      • 10.16.2 Company snapshot

      • 10.16.3 Operating business segments

      • 10.16.4 Product portfolio

      • 10.16.5 Business performance

      • 10.16.6 Key strategic moves and developments

  • LIST OF TABLES

  • TABLE 1. GLOBAL DATA VIRTUALIZATION MARKET, BY COMPONENT, 2021-2031 ($MILLION)
    TABLE 2. DATA VIRTUALIZATION MARKET SIZE, FOR SOLUTION, BY REGION, 2021-2031 ($MILLION)
    TABLE 3. DATA VIRTUALIZATION MARKET FOR SOLUTION, BY COUNTRY, 2021-2031 ($MILLION)
    TABLE 4. DATA VIRTUALIZATION MARKET SIZE, FOR SERVICES, BY REGION, 2021-2031 ($MILLION)
    TABLE 5. DATA VIRTUALIZATION MARKET FOR SERVICES, BY COUNTRY, 2021-2031 ($MILLION)
    TABLE 6. GLOBAL DATA VIRTUALIZATION MARKET, BY DEPLOYMENT MODEL, 2021-2031 ($MILLION)
    TABLE 7. DATA VIRTUALIZATION MARKET SIZE, FOR ON-PREMISE, BY REGION, 2021-2031 ($MILLION)
    TABLE 8. DATA VIRTUALIZATION MARKET FOR ON-PREMISE, BY COUNTRY, 2021-2031 ($MILLION)
    TABLE 9. DATA VIRTUALIZATION MARKET SIZE, FOR CLOUD, BY REGION, 2021-2031 ($MILLION)
    TABLE 10. DATA VIRTUALIZATION MARKET FOR CLOUD, BY COUNTRY, 2021-2031 ($MILLION)
    TABLE 11. GLOBAL DATA VIRTUALIZATION MARKET, BY ENTERPRISE SIZE, 2021-2031 ($MILLION)
    TABLE 12. DATA VIRTUALIZATION MARKET SIZE, FOR LARGE ENTERPRISES, BY REGION, 2021-2031 ($MILLION)
    TABLE 13. DATA VIRTUALIZATION MARKET FOR LARGE ENTERPRISES, BY COUNTRY, 2021-2031 ($MILLION)
    TABLE 14. DATA VIRTUALIZATION MARKET SIZE, FOR SMES, BY REGION, 2021-2031 ($MILLION)
    TABLE 15. DATA VIRTUALIZATION MARKET FOR SMES, BY COUNTRY, 2021-2031 ($MILLION)
    TABLE 16. GLOBAL DATA VIRTUALIZATION MARKET, BY END USER, 2021-2031 ($MILLION)
    TABLE 17. DATA VIRTUALIZATION MARKET SIZE, FOR IT AND TELECOM, BY REGION, 2021-2031 ($MILLION)
    TABLE 18. DATA VIRTUALIZATION MARKET FOR IT AND TELECOM, BY COUNTRY, 2021-2031 ($MILLION)
    TABLE 19. DATA VIRTUALIZATION MARKET SIZE, FOR BFSI, BY REGION, 2021-2031 ($MILLION)
    TABLE 20. DATA VIRTUALIZATION MARKET FOR BFSI, BY COUNTRY, 2021-2031 ($MILLION)
    TABLE 21. DATA VIRTUALIZATION MARKET SIZE, FOR GOVERNMENT AND DEFENSE, BY REGION, 2021-2031 ($MILLION)
    TABLE 22. DATA VIRTUALIZATION MARKET FOR GOVERNMENT AND DEFENSE, BY COUNTRY, 2021-2031 ($MILLION)
    TABLE 23. DATA VIRTUALIZATION MARKET SIZE, FOR HEALTHCARE AND LIFE SCIENCES, BY REGION, 2021-2031 ($MILLION)
    TABLE 24. DATA VIRTUALIZATION MARKET FOR HEALTHCARE AND LIFE SCIENCES, BY COUNTRY, 2021-2031 ($MILLION)
    TABLE 25. DATA VIRTUALIZATION MARKET SIZE, FOR RETAIL, BY REGION, 2021-2031 ($MILLION)
    TABLE 26. DATA VIRTUALIZATION MARKET FOR RETAIL, BY COUNTRY, 2021-2031 ($MILLION)
    TABLE 27. DATA VIRTUALIZATION MARKET SIZE, FOR MANUFACTURING, BY REGION, 2021-2031 ($MILLION)
    TABLE 28. DATA VIRTUALIZATION MARKET FOR MANUFACTURING, BY COUNTRY, 2021-2031 ($MILLION)
    TABLE 29. DATA VIRTUALIZATION MARKET SIZE, FOR EDUCATION, BY REGION, 2021-2031 ($MILLION)
    TABLE 30. DATA VIRTUALIZATION MARKET FOR EDUCATION, BY COUNTRY, 2021-2031 ($MILLION)
    TABLE 31. DATA VIRTUALIZATION MARKET SIZE, FOR OTHERS, BY REGION, 2021-2031 ($MILLION)
    TABLE 32. DATA VIRTUALIZATION MARKET FOR OTHERS, BY COUNTRY, 2021-2031 ($MILLION)
    TABLE 33. DATA VIRTUALIZATION MARKET, BY REGION, 2021-2031 ($MILLION)
    TABLE 34. NORTH AMERICA DATA VIRTUALIZATION MARKET, BY COMPONENT, 2021-2031 ($MILLION)
    TABLE 35. NORTH AMERICA DATA VIRTUALIZATION MARKET, BY DEPLOYMENT MODEL, 2021-2031 ($MILLION)
    TABLE 36. NORTH AMERICA DATA VIRTUALIZATION MARKET, BY ENTERPRISE SIZE, 2021-2031 ($MILLION)
    TABLE 37. NORTH AMERICA DATA VIRTUALIZATION MARKET, BY END USER, 2021-2031 ($MILLION)
    TABLE 38. NORTH AMERICA DATA VIRTUALIZATION MARKET, BY COUNTRY, 2021-2031 ($MILLION)
    TABLE 39. U.S. DATA VIRTUALIZATION MARKET, BY COMPONENT, 2021-2031 ($MILLION)
    TABLE 40. U.S. DATA VIRTUALIZATION MARKET, BY DEPLOYMENT MODEL, 2021-2031 ($MILLION)
    TABLE 41. U.S. DATA VIRTUALIZATION MARKET, BY ENTERPRISE SIZE, 2021-2031 ($MILLION)
    TABLE 42. U.S. DATA VIRTUALIZATION MARKET, BY END USER, 2021-2031 ($MILLION)
    TABLE 43. CANADA DATA VIRTUALIZATION MARKET, BY COMPONENT, 2021-2031 ($MILLION)
    TABLE 44. CANADA DATA VIRTUALIZATION MARKET, BY DEPLOYMENT MODEL, 2021-2031 ($MILLION)
    TABLE 45. CANADA DATA VIRTUALIZATION MARKET, BY ENTERPRISE SIZE, 2021-2031 ($MILLION)
    TABLE 46. CANADA DATA VIRTUALIZATION MARKET, BY END USER, 2021-2031 ($MILLION)
    TABLE 47. EUROPE DATA VIRTUALIZATION MARKET, BY COMPONENT, 2021-2031 ($MILLION)
    TABLE 48. EUROPE DATA VIRTUALIZATION MARKET, BY DEPLOYMENT MODEL, 2021-2031 ($MILLION)
    TABLE 49. EUROPE DATA VIRTUALIZATION MARKET, BY ENTERPRISE SIZE, 2021-2031 ($MILLION)
    TABLE 50. EUROPE DATA VIRTUALIZATION MARKET, BY END USER, 2021-2031 ($MILLION)
    TABLE 51. EUROPE DATA VIRTUALIZATION MARKET, BY COUNTRY, 2021-2031 ($MILLION)
    TABLE 52. UK DATA VIRTUALIZATION MARKET, BY COMPONENT, 2021-2031 ($MILLION)
    TABLE 53. UK DATA VIRTUALIZATION MARKET, BY DEPLOYMENT MODEL, 2021-2031 ($MILLION)
    TABLE 54. UK DATA VIRTUALIZATION MARKET, BY ENTERPRISE SIZE, 2021-2031 ($MILLION)
    TABLE 55. UK DATA VIRTUALIZATION MARKET, BY END USER, 2021-2031 ($MILLION)
    TABLE 56. GERMANY DATA VIRTUALIZATION MARKET, BY COMPONENT, 2021-2031 ($MILLION)
    TABLE 57. GERMANY DATA VIRTUALIZATION MARKET, BY DEPLOYMENT MODEL, 2021-2031 ($MILLION)
    TABLE 58. GERMANY DATA VIRTUALIZATION MARKET, BY ENTERPRISE SIZE, 2021-2031 ($MILLION)
    TABLE 59. GERMANY DATA VIRTUALIZATION MARKET, BY END USER, 2021-2031 ($MILLION)
    TABLE 60. FRANCE DATA VIRTUALIZATION MARKET, BY COMPONENT, 2021-2031 ($MILLION)
    TABLE 61. FRANCE DATA VIRTUALIZATION MARKET, BY DEPLOYMENT MODEL, 2021-2031 ($MILLION)
    TABLE 62. FRANCE DATA VIRTUALIZATION MARKET, BY ENTERPRISE SIZE, 2021-2031 ($MILLION)
    TABLE 63. FRANCE DATA VIRTUALIZATION MARKET, BY END USER, 2021-2031 ($MILLION)
    TABLE 64. ITALY DATA VIRTUALIZATION MARKET, BY COMPONENT, 2021-2031 ($MILLION)
    TABLE 65. ITALY DATA VIRTUALIZATION MARKET, BY DEPLOYMENT MODEL, 2021-2031 ($MILLION)
    TABLE 66. ITALY DATA VIRTUALIZATION MARKET, BY ENTERPRISE SIZE, 2021-2031 ($MILLION)
    TABLE 67. ITALY DATA VIRTUALIZATION MARKET, BY END USER, 2021-2031 ($MILLION)
    TABLE 68. SPAIN DATA VIRTUALIZATION MARKET, BY COMPONENT, 2021-2031 ($MILLION)
    TABLE 69. SPAIN DATA VIRTUALIZATION MARKET, BY DEPLOYMENT MODEL, 2021-2031 ($MILLION)
    TABLE 70. SPAIN DATA VIRTUALIZATION MARKET, BY ENTERPRISE SIZE, 2021-2031 ($MILLION)
    TABLE 71. SPAIN DATA VIRTUALIZATION MARKET, BY END USER, 2021-2031 ($MILLION)
    TABLE 72. REST OF EUROPE DATA VIRTUALIZATION MARKET, BY COMPONENT, 2021-2031 ($MILLION)
    TABLE 73. REST OF EUROPE DATA VIRTUALIZATION MARKET, BY DEPLOYMENT MODEL, 2021-2031 ($MILLION)
    TABLE 74. REST OF EUROPE DATA VIRTUALIZATION MARKET, BY ENTERPRISE SIZE, 2021-2031 ($MILLION)
    TABLE 75. REST OF EUROPE DATA VIRTUALIZATION MARKET, BY END USER, 2021-2031 ($MILLION)
    TABLE 76. ASIA-PACIFIC DATA VIRTUALIZATION MARKET, BY COMPONENT, 2021-2031 ($MILLION)
    TABLE 77. ASIA-PACIFIC DATA VIRTUALIZATION MARKET, BY DEPLOYMENT MODEL, 2021-2031 ($MILLION)
    TABLE 78. ASIA-PACIFIC DATA VIRTUALIZATION MARKET, BY ENTERPRISE SIZE, 2021-2031 ($MILLION)
    TABLE 79. ASIA-PACIFIC DATA VIRTUALIZATION MARKET, BY END USER, 2021-2031 ($MILLION)
    TABLE 80. ASIA-PACIFIC DATA VIRTUALIZATION MARKET, BY COUNTRY, 2021-2031 ($MILLION)
    TABLE 81. CHINA DATA VIRTUALIZATION MARKET, BY COMPONENT, 2021-2031 ($MILLION)
    TABLE 82. CHINA DATA VIRTUALIZATION MARKET, BY DEPLOYMENT MODEL, 2021-2031 ($MILLION)
    TABLE 83. CHINA DATA VIRTUALIZATION MARKET, BY ENTERPRISE SIZE, 2021-2031 ($MILLION)
    TABLE 84. CHINA DATA VIRTUALIZATION MARKET, BY END USER, 2021-2031 ($MILLION)
    TABLE 85. INDIA DATA VIRTUALIZATION MARKET, BY COMPONENT, 2021-2031 ($MILLION)
    TABLE 86. INDIA DATA VIRTUALIZATION MARKET, BY DEPLOYMENT MODEL, 2021-2031 ($MILLION)
    TABLE 87. INDIA DATA VIRTUALIZATION MARKET, BY ENTERPRISE SIZE, 2021-2031 ($MILLION)
    TABLE 88. INDIA DATA VIRTUALIZATION MARKET, BY END USER, 2021-2031 ($MILLION)
    TABLE 89. JAPAN DATA VIRTUALIZATION MARKET, BY COMPONENT, 2021-2031 ($MILLION)
    TABLE 90. JAPAN DATA VIRTUALIZATION MARKET, BY DEPLOYMENT MODEL, 2021-2031 ($MILLION)
    TABLE 91. JAPAN DATA VIRTUALIZATION MARKET, BY ENTERPRISE SIZE, 2021-2031 ($MILLION)
    TABLE 92. JAPAN DATA VIRTUALIZATION MARKET, BY END USER, 2021-2031 ($MILLION)
    TABLE 93. AUSTRALIA DATA VIRTUALIZATION MARKET, BY COMPONENT, 2021-2031 ($MILLION)
    TABLE 94. AUSTRALIA DATA VIRTUALIZATION MARKET, BY DEPLOYMENT MODEL, 2021-2031 ($MILLION)
    TABLE 95. AUSTRALIA DATA VIRTUALIZATION MARKET, BY ENTERPRISE SIZE, 2021-2031 ($MILLION)
    TABLE 96. AUSTRALIA DATA VIRTUALIZATION MARKET, BY END USER, 2021-2031 ($MILLION)
    TABLE 97. SOUTH KOREA DATA VIRTUALIZATION MARKET, BY COMPONENT, 2021-2031 ($MILLION)
    TABLE 98. SOUTH KOREA DATA VIRTUALIZATION MARKET, BY DEPLOYMENT MODEL, 2021-2031 ($MILLION)
    TABLE 99. SOUTH KOREA DATA VIRTUALIZATION MARKET, BY ENTERPRISE SIZE, 2021-2031 ($MILLION)
    TABLE 100. SOUTH KOREA DATA VIRTUALIZATION MARKET, BY END USER, 2021-2031 ($MILLION)
    TABLE 101. REST OF ASIA-PACIFIC DATA VIRTUALIZATION MARKET, BY COMPONENT, 2021-2031 ($MILLION)
    TABLE 102. REST OF ASIA-PACIFIC DATA VIRTUALIZATION MARKET, BY DEPLOYMENT MODEL, 2021-2031 ($MILLION)
    TABLE 103. REST OF ASIA-PACIFIC DATA VIRTUALIZATION MARKET, BY ENTERPRISE SIZE, 2021-2031 ($MILLION)
    TABLE 104. REST OF ASIA-PACIFIC DATA VIRTUALIZATION MARKET, BY END USER, 2021-2031 ($MILLION)
    TABLE 105. LAMEA DATA VIRTUALIZATION MARKET, BY COMPONENT, 2021-2031 ($MILLION)
    TABLE 106. LAMEA DATA VIRTUALIZATION MARKET, BY DEPLOYMENT MODEL, 2021-2031 ($MILLION)
    TABLE 107. LAMEA DATA VIRTUALIZATION MARKET, BY ENTERPRISE SIZE, 2021-2031 ($MILLION)
    TABLE 108. LAMEA DATA VIRTUALIZATION MARKET, BY END USER, 2021-2031 ($MILLION)
    TABLE 109. LAMEA DATA VIRTUALIZATION MARKET, BY COUNTRY, 2021-2031 ($MILLION)
    TABLE 110. LATIN AMERICA DATA VIRTUALIZATION MARKET, BY COMPONENT, 2021-2031 ($MILLION)
    TABLE 111. LATIN AMERICA DATA VIRTUALIZATION MARKET, BY DEPLOYMENT MODEL, 2021-2031 ($MILLION)
    TABLE 112. LATIN AMERICA DATA VIRTUALIZATION MARKET, BY ENTERPRISE SIZE, 2021-2031 ($MILLION)
    TABLE 113. LATIN AMERICA DATA VIRTUALIZATION MARKET, BY END USER, 2021-2031 ($MILLION)
    TABLE 114. MIDDLE EAST DATA VIRTUALIZATION MARKET, BY COMPONENT, 2021-2031 ($MILLION)
    TABLE 115. MIDDLE EAST DATA VIRTUALIZATION MARKET, BY DEPLOYMENT MODEL, 2021-2031 ($MILLION)
    TABLE 116. MIDDLE EAST DATA VIRTUALIZATION MARKET, BY ENTERPRISE SIZE, 2021-2031 ($MILLION)
    TABLE 117. MIDDLE EAST DATA VIRTUALIZATION MARKET, BY END USER, 2021-2031 ($MILLION)
    TABLE 118. AFRICA DATA VIRTUALIZATION MARKET, BY COMPONENT, 2021-2031 ($MILLION)
    TABLE 119. AFRICA DATA VIRTUALIZATION MARKET, BY DEPLOYMENT MODEL, 2021-2031 ($MILLION)
    TABLE 120. AFRICA DATA VIRTUALIZATION MARKET, BY ENTERPRISE SIZE, 2021-2031 ($MILLION)
    TABLE 121. AFRICA DATA VIRTUALIZATION MARKET, BY END USER, 2021-2031 ($MILLION)
    TABLE 122.ADAPTIVE INSIGHTS: COMPANY SNAPSHOT
    TABLE 123.ADAPTIVE INSIGHTS: OPERATING SEGMENTS
    TABLE 124.ADAPTIVE INSIGHTS: PRODUCT PORTFOLIO
    TABLE 125.ADAPTIVE INSIGHTS: NET SALES,
    TABLE 126.ADAPTIVE INSIGHTS: KEY STRATERGIES
    TABLE 127.ALTERYX INC.: COMPANY SNAPSHOT
    TABLE 128.ALTERYX INC.: OPERATING SEGMENTS
    TABLE 129.ALTERYX INC.: PRODUCT PORTFOLIO
    TABLE 130.ALTERYX INC.: NET SALES,
    TABLE 131.ALTERYX INC.: KEY STRATERGIES
    TABLE 132.CHARTBLOCKS LTD.: COMPANY SNAPSHOT
    TABLE 133.CHARTBLOCKS LTD.: OPERATING SEGMENTS
    TABLE 134.CHARTBLOCKS LTD.: PRODUCT PORTFOLIO
    TABLE 135.CHARTBLOCKS LTD.: NET SALES,
    TABLE 136.CHARTBLOCKS LTD.: KEY STRATERGIES
    TABLE 137.CLUVIO GMBH: COMPANY SNAPSHOT
    TABLE 138.CLUVIO GMBH: OPERATING SEGMENTS
    TABLE 139.CLUVIO GMBH: PRODUCT PORTFOLIO
    TABLE 140.CLUVIO GMBH: NET SALES,
    TABLE 141.CLUVIO GMBH: KEY STRATERGIES
    TABLE 142.DOMO INC.: COMPANY SNAPSHOT
    TABLE 143.DOMO INC.: OPERATING SEGMENTS
    TABLE 144.DOMO INC.: PRODUCT PORTFOLIO
    TABLE 145.DOMO INC.: NET SALES,
    TABLE 146.DOMO INC.: KEY STRATERGIES
    TABLE 147.TABLEAU SOFTWARE INC: COMPANY SNAPSHOT
    TABLE 148.TABLEAU SOFTWARE INC: OPERATING SEGMENTS
    TABLE 149.TABLEAU SOFTWARE INC: PRODUCT PORTFOLIO
    TABLE 150.TABLEAU SOFTWARE INC: NET SALES,
    TABLE 151.TABLEAU SOFTWARE INC: KEY STRATERGIES
    TABLE 152.QLIKTECH INTERNATIONAL AB: COMPANY SNAPSHOT
    TABLE 153.QLIKTECH INTERNATIONAL AB: OPERATING SEGMENTS
    TABLE 154.QLIKTECH INTERNATIONAL AB: PRODUCT PORTFOLIO
    TABLE 155.QLIKTECH INTERNATIONAL AB: NET SALES,
    TABLE 156.QLIKTECH INTERNATIONAL AB: KEY STRATERGIES
    TABLE 157.ORACLE CORPORATION: COMPANY SNAPSHOT
    TABLE 158.ORACLE CORPORATION: OPERATING SEGMENTS
    TABLE 159.ORACLE CORPORATION: PRODUCT PORTFOLIO
    TABLE 160.ORACLE CORPORATION: NET SALES,
    TABLE 161.ORACLE CORPORATION: KEY STRATERGIES
    TABLE 162.IBM: COMPANY SNAPSHOT
    TABLE 163.IBM: OPERATING SEGMENTS
    TABLE 164.IBM: PRODUCT PORTFOLIO
    TABLE 165.IBM: NET SALES,
    TABLE 166.IBM: KEY STRATERGIES
    TABLE 167.CISCO SYSTEMS, INC.: COMPANY SNAPSHOT
    TABLE 168.CISCO SYSTEMS, INC.: OPERATING SEGMENTS
    TABLE 169.CISCO SYSTEMS, INC.: PRODUCT PORTFOLIO
    TABLE 170.CISCO SYSTEMS, INC.: NET SALES,
    TABLE 171.CISCO SYSTEMS, INC.: KEY STRATERGIES
    TABLE 172.SAP SE: COMPANY SNAPSHOT
    TABLE 173.SAP SE: OPERATING SEGMENTS
    TABLE 174.SAP SE: PRODUCT PORTFOLIO
    TABLE 175.SAP SE: NET SALES,
    TABLE 176.SAP SE: KEY STRATERGIES
    TABLE 177.SAS INSTITUTE INC.: COMPANY SNAPSHOT
    TABLE 178.SAS INSTITUTE INC.: OPERATING SEGMENTS
    TABLE 179.SAS INSTITUTE INC.: PRODUCT PORTFOLIO
    TABLE 180.SAS INSTITUTE INC.: NET SALES,
    TABLE 181.SAS INSTITUTE INC.: KEY STRATERGIES
    TABLE 182.MICROSOFT CORPORATION: COMPANY SNAPSHOT
    TABLE 183.MICROSOFT CORPORATION: OPERATING SEGMENTS
    TABLE 184.MICROSOFT CORPORATION: PRODUCT PORTFOLIO
    TABLE 185.MICROSOFT CORPORATION: NET SALES,
    TABLE 186.MICROSOFT CORPORATION: KEY STRATERGIES
    TABLE 187.DENODO TECHNOLOGIES INC.: COMPANY SNAPSHOT
    TABLE 188.DENODO TECHNOLOGIES INC.: OPERATING SEGMENTS
    TABLE 189.DENODO TECHNOLOGIES INC.: PRODUCT PORTFOLIO
    TABLE 190.DENODO TECHNOLOGIES INC.: NET SALES,
    TABLE 191.DENODO TECHNOLOGIES INC.: KEY STRATERGIES
    TABLE 192.INFORMATICA INC.: COMPANY SNAPSHOT
    TABLE 193.INFORMATICA INC.: OPERATING SEGMENTS
    TABLE 194.INFORMATICA INC.: PRODUCT PORTFOLIO
    TABLE 195.INFORMATICA INC.: NET SALES,
    TABLE 196.INFORMATICA INC.: KEY STRATERGIES
    TABLE 197.OPENLINK SOFTWARE INC.: COMPANY SNAPSHOT
    TABLE 198.OPENLINK SOFTWARE INC.: OPERATING SEGMENTS
    TABLE 199.OPENLINK SOFTWARE INC.: PRODUCT PORTFOLIO
    TABLE 200.OPENLINK SOFTWARE INC.: NET SALES,
    TABLE 201.OPENLINK SOFTWARE INC.: KEY STRATERGIES
  • LIST OF FIGURES

  • FIGURE 1.DATA VIRTUALIZATION MARKET SEGMENTATION
    FIGURE 2.DATA VIRTUALIZATION MARKET,2021-2031
    FIGURE 3.DATA VIRTUALIZATION MARKET,2021-2031
    FIGURE 4. TOP INVESTMENT POCKETS, BY REGION
    FIGURE 5.PORTER FIVE-1
    FIGURE 6.PORTER FIVE-2
    FIGURE 7.PORTER FIVE-3
    FIGURE 8.PORTER FIVE-4
    FIGURE 9.PORTER FIVE-5
    FIGURE 10.TOP PLAYER POSITIONING
    FIGURE 11.DATA VIRTUALIZATION MARKET:DRIVERS, RESTRAINTS AND OPPORTUNITIES
    FIGURE 12.PATENT ANALYSIS BY COMPANY
    FIGURE 13.PATENT ANALYSIS BY COUNTRY
    FIGURE 14.KEY REGULATION ANALYSIS
    FIGURE 15.DATA VIRTUALIZATION MARKET,BY COMPONENT,2021(%)
    FIGURE 16.COMPARATIVE SHARE ANALYSIS OF SOLUTION DATA VIRTUALIZATION MARKET,2021-2031(%)
    FIGURE 17.COMPARATIVE SHARE ANALYSIS OF SERVICES DATA VIRTUALIZATION MARKET,2021-2031(%)
    FIGURE 18.DATA VIRTUALIZATION MARKET,BY DEPLOYMENT MODEL,2021(%)
    FIGURE 19.COMPARATIVE SHARE ANALYSIS OF ON-PREMISE DATA VIRTUALIZATION MARKET,2021-2031(%)
    FIGURE 20.COMPARATIVE SHARE ANALYSIS OF CLOUD DATA VIRTUALIZATION MARKET,2021-2031(%)
    FIGURE 21.DATA VIRTUALIZATION MARKET,BY ENTERPRISE SIZE,2021(%)
    FIGURE 22.COMPARATIVE SHARE ANALYSIS OF LARGE ENTERPRISES DATA VIRTUALIZATION MARKET,2021-2031(%)
    FIGURE 23.COMPARATIVE SHARE ANALYSIS OF SMES DATA VIRTUALIZATION MARKET,2021-2031(%)
    FIGURE 24.DATA VIRTUALIZATION MARKET,BY END USER,2021(%)
    FIGURE 25.COMPARATIVE SHARE ANALYSIS OF IT AND TELECOM DATA VIRTUALIZATION MARKET,2021-2031(%)
    FIGURE 26.COMPARATIVE SHARE ANALYSIS OF BFSI DATA VIRTUALIZATION MARKET,2021-2031(%)
    FIGURE 27.COMPARATIVE SHARE ANALYSIS OF GOVERNMENT AND DEFENSE DATA VIRTUALIZATION MARKET,2021-2031(%)
    FIGURE 28.COMPARATIVE SHARE ANALYSIS OF HEALTHCARE AND LIFE SCIENCES DATA VIRTUALIZATION MARKET,2021-2031(%)
    FIGURE 29.COMPARATIVE SHARE ANALYSIS OF RETAIL DATA VIRTUALIZATION MARKET,2021-2031(%)
    FIGURE 30.COMPARATIVE SHARE ANALYSIS OF MANUFACTURING DATA VIRTUALIZATION MARKET,2021-2031(%)
    FIGURE 31.COMPARATIVE SHARE ANALYSIS OF EDUCATION DATA VIRTUALIZATION MARKET,2021-2031(%)
    FIGURE 32.COMPARATIVE SHARE ANALYSIS OF OTHERS DATA VIRTUALIZATION MARKET,2021-2031(%)
    FIGURE 33.DATA VIRTUALIZATION MARKET BY REGION,2021
    FIGURE 34.U.S. DATA VIRTUALIZATION MARKET,2021-2031($MILLION)
    FIGURE 35.CANADA DATA VIRTUALIZATION MARKET,2021-2031($MILLION)
    FIGURE 36.UK DATA VIRTUALIZATION MARKET,2021-2031($MILLION)
    FIGURE 37.GERMANY DATA VIRTUALIZATION MARKET,2021-2031($MILLION)
    FIGURE 38.FRANCE DATA VIRTUALIZATION MARKET,2021-2031($MILLION)
    FIGURE 39.ITALY DATA VIRTUALIZATION MARKET,2021-2031($MILLION)
    FIGURE 40.SPAIN DATA VIRTUALIZATION MARKET,2021-2031($MILLION)
    FIGURE 41.REST OF EUROPE DATA VIRTUALIZATION MARKET,2021-2031($MILLION)
    FIGURE 42.CHINA DATA VIRTUALIZATION MARKET,2021-2031($MILLION)
    FIGURE 43.INDIA DATA VIRTUALIZATION MARKET,2021-2031($MILLION)
    FIGURE 44.JAPAN DATA VIRTUALIZATION MARKET,2021-2031($MILLION)
    FIGURE 45.AUSTRALIA DATA VIRTUALIZATION MARKET,2021-2031($MILLION)
    FIGURE 46.SOUTH KOREA DATA VIRTUALIZATION MARKET,2021-2031($MILLION)
    FIGURE 47.REST OF ASIA-PACIFIC DATA VIRTUALIZATION MARKET,2021-2031($MILLION)
    FIGURE 48.LATIN AMERICA DATA VIRTUALIZATION MARKET,2021-2031($MILLION)
    FIGURE 49.MIDDLE EAST DATA VIRTUALIZATION MARKET,2021-2031($MILLION)
    FIGURE 50.AFRICA DATA VIRTUALIZATION MARKET,2021-2031($MILLION)
    FIGURE 51. TOP WINNING STRATEGIES, BY YEAR
    FIGURE 52. TOP WINNING STRATEGIES, BY DEVELOPMENT
    FIGURE 53. TOP WINNING STRATEGIES, BY COMPANY
    FIGURE 54.PRODUCT MAPPING OF TOP 10 PLAYERS
    FIGURE 55.COMPETITIVE DASHBOARD
    FIGURE 56.COMPETITIVE HEATMAP OF TOP 10 KEY PLAYERS
    FIGURE 57.ADAPTIVE INSIGHTS.: NET SALES ,($MILLION)
    FIGURE 58.ALTERYX INC..: NET SALES ,($MILLION)
    FIGURE 59.CHARTBLOCKS LTD..: NET SALES ,($MILLION)
    FIGURE 60.CLUVIO GMBH.: NET SALES ,($MILLION)
    FIGURE 61.DOMO INC..: NET SALES ,($MILLION)
    FIGURE 62.TABLEAU SOFTWARE INC.: NET SALES ,($MILLION)
    FIGURE 63.QLIKTECH INTERNATIONAL AB.: NET SALES ,($MILLION)
    FIGURE 64.ORACLE CORPORATION.: NET SALES ,($MILLION)
    FIGURE 65.IBM.: NET SALES ,($MILLION)
    FIGURE 66.CISCO SYSTEMS, INC..: NET SALES ,($MILLION)
    FIGURE 67.SAP SE.: NET SALES ,($MILLION)
    FIGURE 68.SAS INSTITUTE INC..: NET SALES ,($MILLION)
    FIGURE 69.MICROSOFT CORPORATION.: NET SALES ,($MILLION)
    FIGURE 70.DENODO TECHNOLOGIES INC..: NET SALES ,($MILLION)
    FIGURE 71.INFORMATICA INC..: NET SALES ,($MILLION)
    FIGURE 72.OPENLINK SOFTWARE INC..: NET SALES ,($MILLION)


Data virtualization solutions provide a common platform for data consumers to access massive amounts of data in the format of their choice, regardless of the server or source location. The amount of data generated in businesses has grown recently owing to a number of causes, including digitalization, IoT, and improvements in traditional technology. In addition, a significant factor in the production of enormous amounts of data is linked devices that are connected to the internet. Getting timely access to the data produced by various sources has grown challenging due to the fact that it is kept in a variety of physical locations and forms. Multiple applications, such as the cloud, Software as a Service (SaaS), and the Internet of Things (IoT), are advancing, contributing to the massive volume of data collected. As a result, the requirement to manage and integrate data from several sources has become critical in order to achieve real-time data availability.

In addition, the benefits of data virtualization include better data management, a quicker time to market, and superior data quality. These are a few of the main factors propelling the data virtualization market's expansion overall. The planning and management at the enterprise level have a significant impact on business strategies. A key component of this planning is the use of data in accordance with company strategies. Companies must take into account different data protection and privacy rules imposed by the country in order to access the information because this process necessitates the transmission of significant amounts of data from diverse sources. Organizations need diverse data types, such as customer details, transaction data, and healthcare data, to implement these strategies.

The CXOs continued by stating that there are numerous regional and international suppliers competing in the data virtualization industry on grounds like price, dependability, features, and support services. Rapid developments in data virtualization offerings have an impact on market expansion, whereas COVID-19 conditions and industry development have an impact on vendor performance. Due to rivalry, industry players are providing improved application security products and services to enhance the client experience.

PURCHASE OPTIONS

Call or Email us

U.S.-Canada Toll-free: +1-800-792-5285
Int'l : +1-503-894-6022
Europe : +44-845-528-1300
Email : help@alliedmarketresearch.com
 
FREQUENTLY ASKED QUESTIONS?

A. The data virtualization market size is estimated to grow from $3,170 million in 2021, and is projected to reach $22224.7 million by 2031, registering a CAGR of 21.7%.

A. North America dominated the global market

A. On the basis end user, the IT and telecom segment dominated the data virtualization market in 2021.

A. Increase in cloud-based solution demand and increased business intelligence software usage are anticipated to boost industry expansion and market revenue growth

A. Key players operating in the market include Adaptive Insights, Alteryx Inc., ChartBlocks Ltd., Cisco Systems, Cluvio GmbH, Denodo Technologies, Domo Inc., International Business Machine (IBM), Informatica, Microsoft Corporation, OpenLink Software, Oracle Corporation, QlikTech International AB, SAP SE, SAS Institute, Tableau Software, and Visually Inc.

Looking for Customization?

 Customization Request

Have a Question?

 Speak with Analyst

Any Confusion?

 Inquire Before Buying

Have a glance of the Report

  Request Sample
RELATED TAGS

Purchase Full Report of
Data Virtualization Market

Start reading instantly.
This Report and over 66,965+ more Reports, Available with Avenue Library. T&C*.

  • Online Only
  • $3,570
  • Online cloud access only
  • Restricted print, copy, paste & download
  • Read only
  • Free industry update
    (Within 180 days)
  • Free report update in next update cycle
    (Aug 2023 - Aug 2024)
  • Data Pack
  • $3,840
  • Restricted to one authorized user
  • One print only
  • Available in
    Excel
  • Free industry update
    (Within 180 days)
  •   Free report update in next update cycle
    (Aug 2023 - Aug 2024)
  • Single User
  • $5,730
  • Restricted to one authorized user
  • One print only
  • Available in
    PDF
  • Free industry update
    (Within 180 days)
  •   Free report update in next update cycle
    (Aug 2023 - Aug 2024)
  • Five Users
  • $6,450
  • Limited to five authorized users
  • Print upto five copies
  • Available in
    PDF
  • Free industry update
    (Within 180 days)
  •   Free report update in next update cycle
    (Aug 2023 - Aug 2024)
  • Enterprise
    License/PDF

  • $9,600
  • Unlimited
    within
    company/enterprise
  • Available in Excel & PDF
  • Free industry update
    (Within 180 days)
  •   Free report update in next update cycle
    (Aug 2023 - Aug 2024)
  • Library
    Membership

  • $999 $ 1,175
    Per User/ Per month/ Billed annually
  • Published Content
    E-access
  • Company Profiles
    E-access
  • Newly Added Content Access
  • 10 PDF
    Downloads
  • 5 Excel Data
    Pack Downloads
  • 250 Company Profiles PDF Downloads
  • Buy Now

*Taxes/Fees, if applicable will be added during checkout. All prices in USD

RELATED REPORTS
 

Why Allied Market Research?


Infallible Methodology

To ensure high-level data integrity, accurate analysis, and impeccable forecasts

Analyst Support

For complete satisfaction

Customization

On-demand customization of scope of the report to exactly meet your needs

TARGETED MARKET VIEW

Targeted market view to provide pertinent information and save time of readers

Get fresh content delivered

Get insights on topics that are crucial for your business. Stay abreast of your interest areas.

Get Industry Data Alerts

Why Allied Market Research?

Infallible Methodology

To ensure high-level data integrity, accurate analysis, and impeccable forecasts

Analyst Support

For complete satisfaction

Customization

On-demand customization of scope of the report to exactly meet your needs

TARGETED MARKET VIEW

Targeted market view to provide pertinent information and save time of readers